
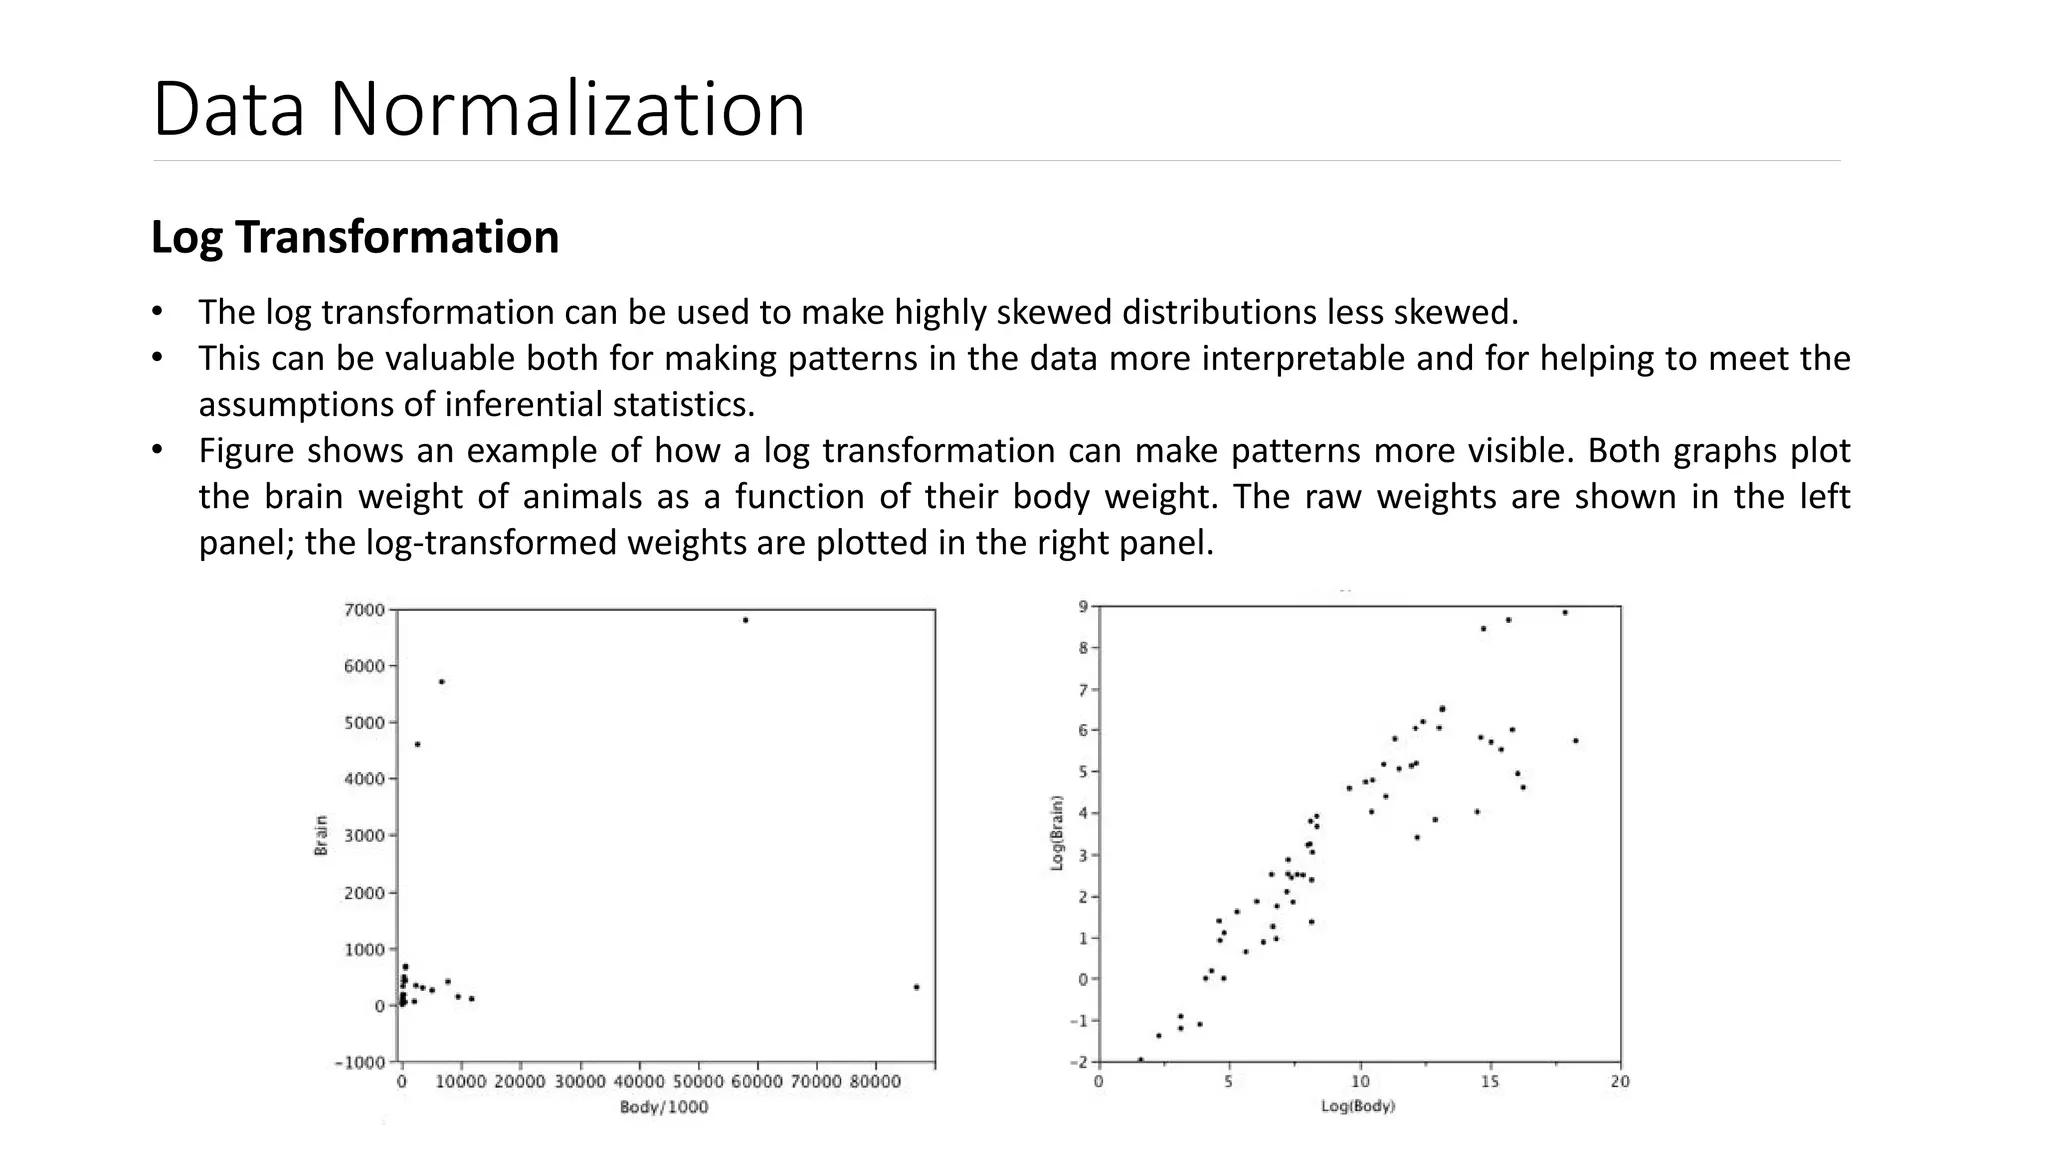
![Scaling of data
• Variable scaling requires taking values that span a specific range and representing them in another range.
• The standard method is to scale variables to [0,1].
• This may introduce various distortions or biases into the data but the distribution or shape remains same.
• Depending on the modeling tool, scaling variable ranges can be beneficial or sometimes even required.
One way of doing this is:
Linear Scaling Transform
• First task in this scaling is to determine the minimum and maximum values of variables.
• Then applying the transform:
(x - min{x1, xN}) / (max{x1, xN} - min{x1, xN})
• This introduces no distortion to the variable distribution.
• Has a one-to-one relationship between the original and scaled values.](https://image.slidesharecdn.com/lesson5scalingandnormalization-200626230146/75/Scaling-and-Normalization-3-2048.jpg)
![Scaling of data
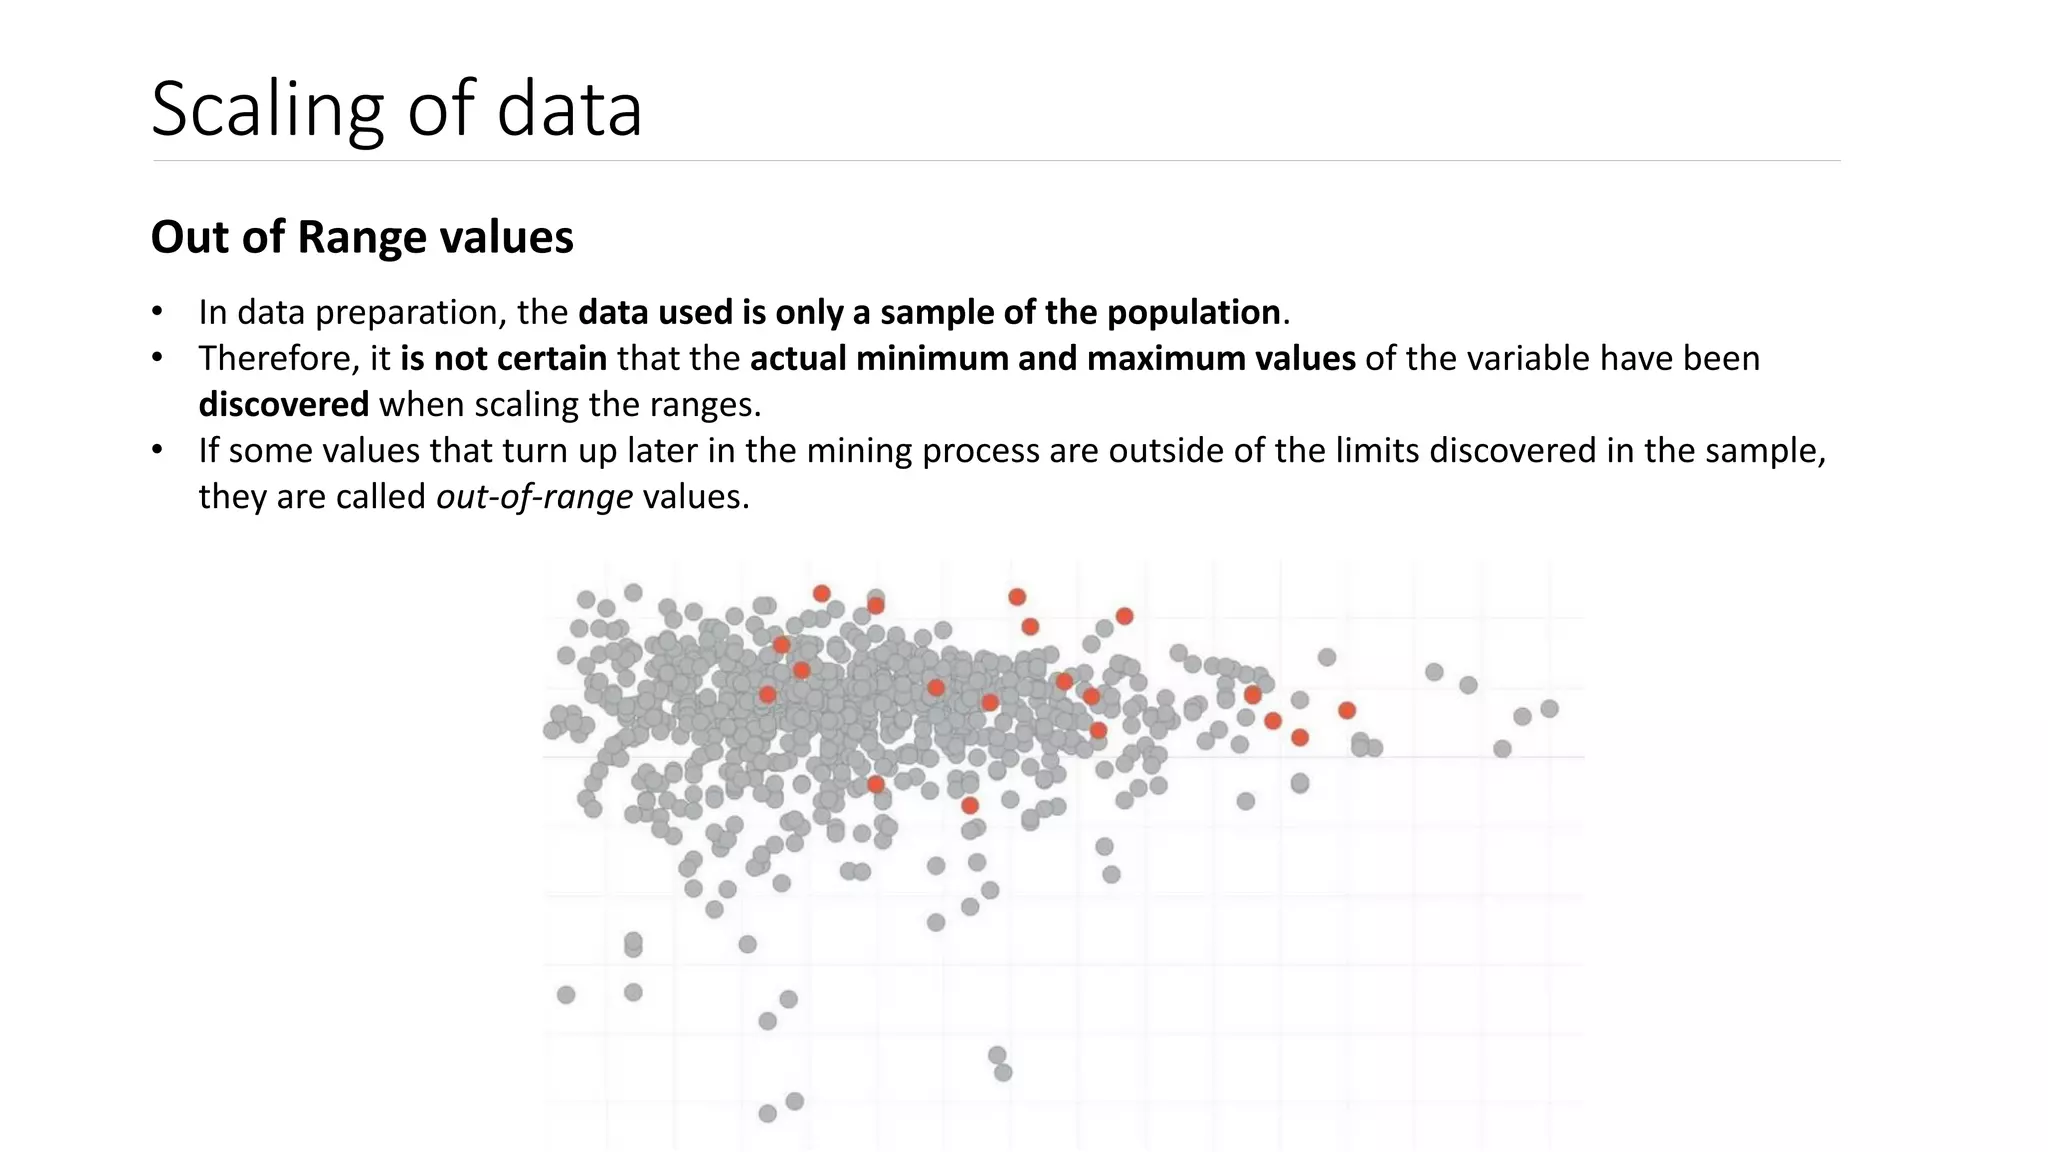
Dealing with Out of Range values
• After range scaling, all variables should be in the range of [0,1].
• Out-of-range values, however, have values like -0.2 or 1.1 which can cause unwanted behavior.
Solution 1: Ignore that the range has been exceeded.
• Most modeling tools have (at least) some capacity to handle numbers outside the scaling range.
• Important question to ask: Does this affect the quality of the model?
Solution 2: Exclude the out of range instances.
• One problem is that reducing the number of instances reduces the confidence that the sample represents
the population.
• Another problem: Introduction of bias. Out-of-range values may occur with a certain pattern and ignoring
these instances removes samples according to a pattern introducing distortion to the sample](https://image.slidesharecdn.com/lesson5scalingandnormalization-200626230146/75/Scaling-and-Normalization-5-2048.jpg)
![Scaling of data
Dealing with Out of Range values
Solution 3: Clip the out of range values
• If the value is greater than 1, assign 1 to it. If less than 0, assign 0.
• This approach assumes that out-of-range values are somehow equivalent with range limit values.
• Therefore, the information content on the limits is distorted by projecting multiple values into a single
value.
• This also introduces some bias.
Solution 4: Making room for out of range values
• The linear scaling transform provides an undistorted normalization but suffers from out-of-range values.
• Therefore, we should modify it to somehow include also values that are out of range.
• Most of the population is inside the range so for these values the normalization should be linear.
• The solution is to reserve some part of the range for the out-of-range values.
• Reserved amount of space depends on the confidence level of the sample:
e.g. - 98% confidence linear part is [0.01, 0.99]](https://image.slidesharecdn.com/lesson5scalingandnormalization-200626230146/75/Scaling-and-Normalization-6-2048.jpg)
![Scaling of data
Dealing with Out of Range values
Softmax Scaling –
• The extent of the linear part can be controlled by one parameter.
• The space assigned for out-of-range values can be controlled by the level of uncertainty in the sample.
• Non identical values have always different normalized values.
Softmax scaling is based on the logistic function:
y = 1 / (1 + e-x)
Where y is the scaled value and x is the input value.
• The logistic function transforms the original range of
[-,] to [0,1] and also has a linear part on the transform.](https://image.slidesharecdn.com/lesson5scalingandnormalization-200626230146/75/Scaling-and-Normalization-8-2048.jpg)

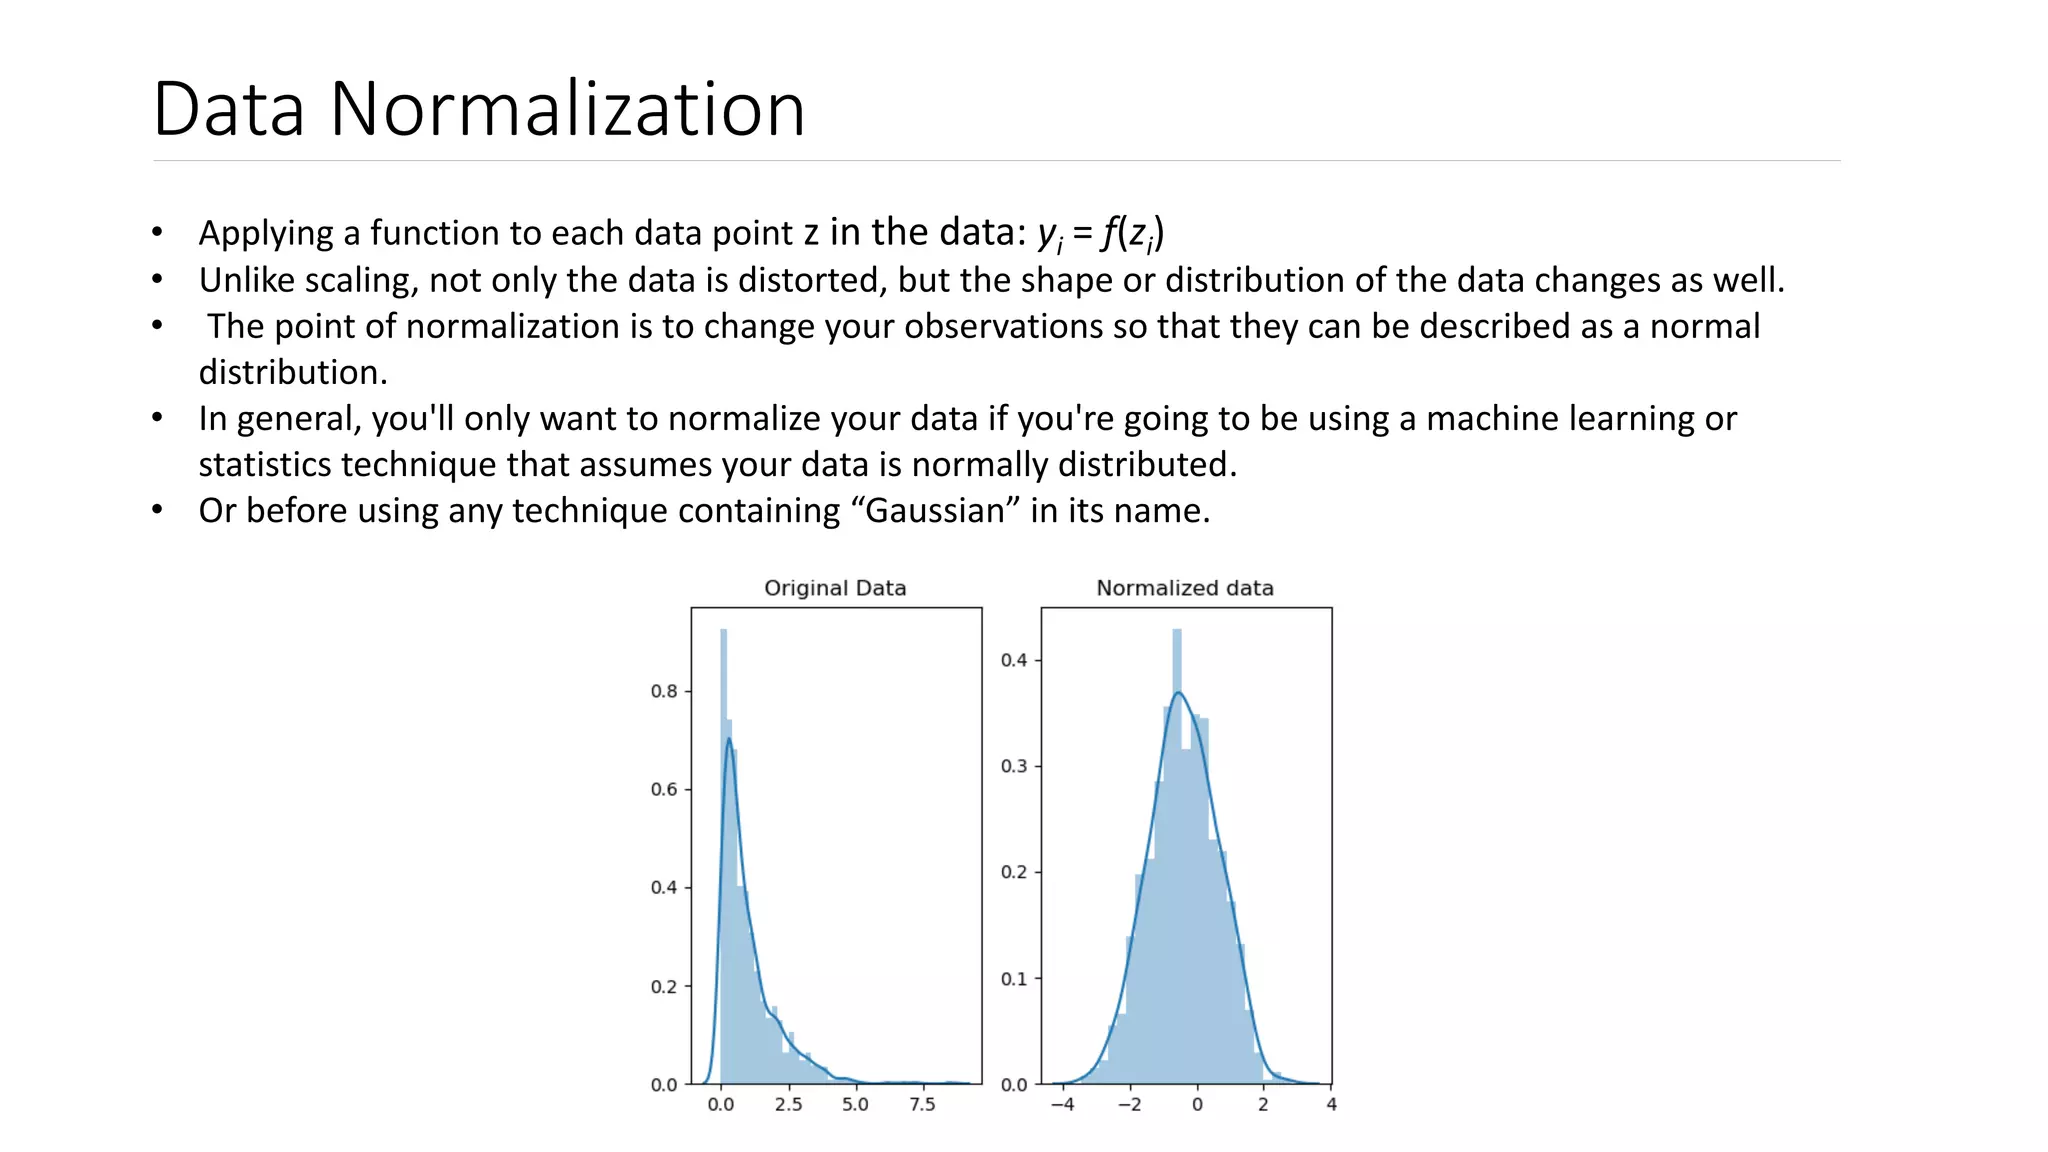


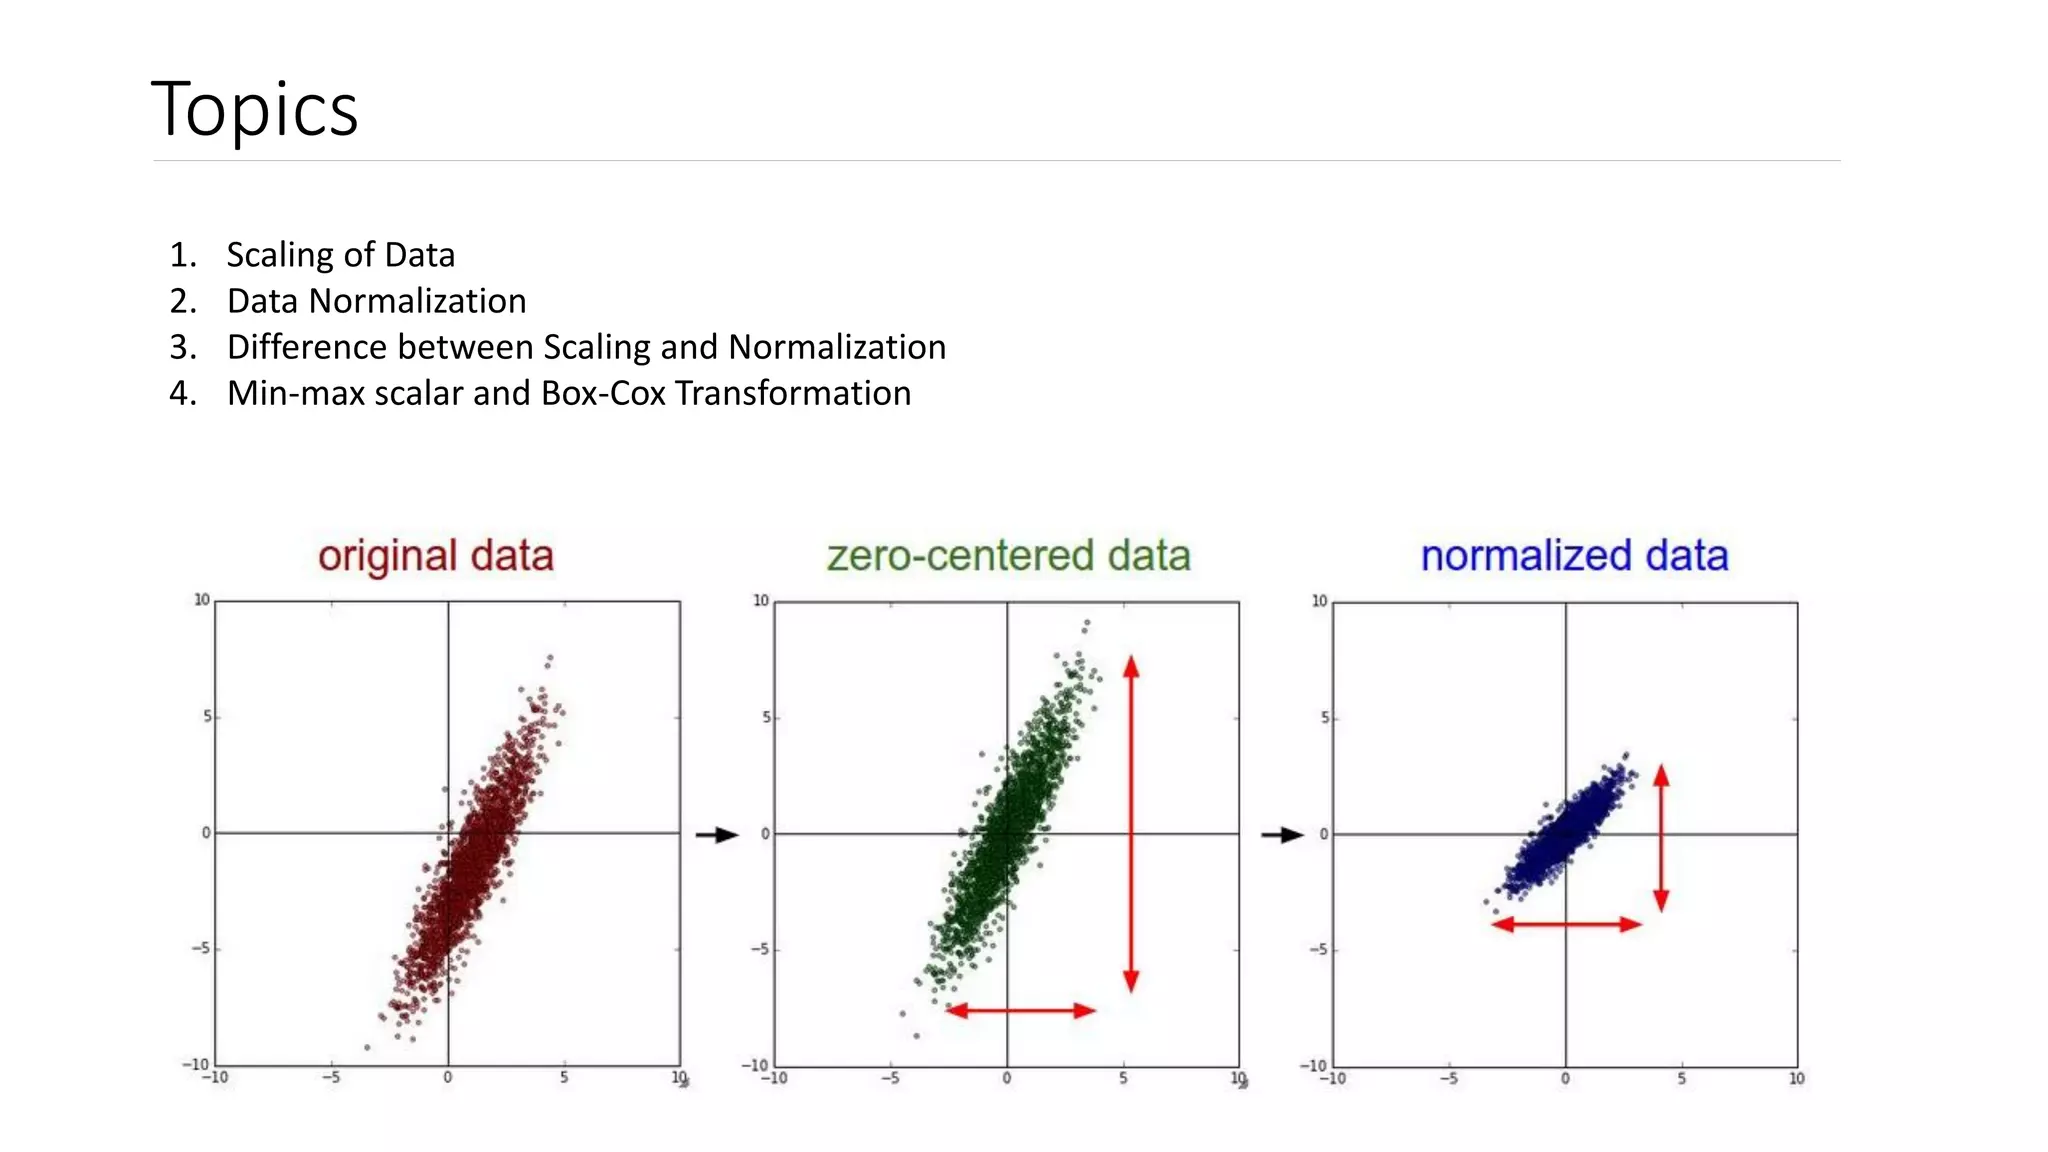
Scaling transforms data values to fall within a specific range, such as 0 to 1, without changing the data distribution. Normalization changes the data distribution to be normal. Common normalization techniques include standardization, which transforms data to have mean 0 and standard deviation 1, and Box-Cox transformation, which finds the best lambda value to make data more normal. Normalization is useful for algorithms that assume normal data distributions and can improve model performance and interpretation.


![[DSC Europe 25] Dusan Jovicic - AI Story: From on-prem to cloud and back agai...](https://cdn.slidesharecdn.com/ss_thumbnails/8kp49m6uq22ifnbwhfnk-2-251205085715-964d11a6-thumbnail.jpg?width=640&height=640&fit=bounds)
![[DSC Europe 25] Jim Sterne - Adopting Generative AI Capabilities Into the Ent...](https://cdn.slidesharecdn.com/ss_thumbnails/sxhpofuorcagxsaulkmt-3-251204082258-7e66bc48-thumbnail.jpg?width=640&height=640&fit=bounds)


![[DSC Europe 25] Dragana Ilic - AI for Big Data in Astronomy.pptx](https://cdn.slidesharecdn.com/ss_thumbnails/8palya86qaatvjhva1ms-2-dragana-ilic-ai-ilic-251208151906-652b819c-thumbnail.jpg?width=640&height=640&fit=bounds)


![[DSC Europe 25] Goran Obradovic - The Rise of Sovereign AI: Building the Regi...](https://cdn.slidesharecdn.com/ss_thumbnails/7nw2xxixrxqdxvrb5wca-6-251205085714-ab09a2ac-thumbnail.jpg?width=640&height=640&fit=bounds)
![[DSC Europe 25] Bogdan Daniel Maruneac - AI - It starts with you.pptx](https://cdn.slidesharecdn.com/ss_thumbnails/odov3snhrcqs9hx5ny2n-4-251205085715-f1daacfe-thumbnail.jpg?width=640&height=640&fit=bounds)