This document discusses feature engineering, which is the process of transforming raw data into features that better represent the underlying problem for predictive models. It covers feature engineering categories like feature selection, feature transformation, and feature extraction. Specific techniques covered include imputation, handling outliers, binning, log transforms, scaling, and feature subset selection methods like filter, wrapper, and embedded methods. The goal of feature engineering is to improve machine learning model performance by preparing proper input data compatible with algorithm requirements.


![21
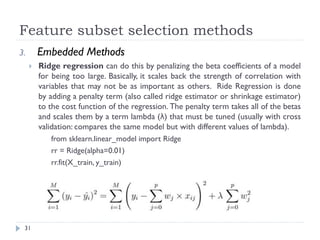
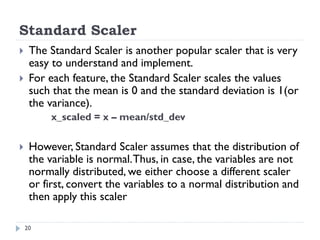
from sklearn.preprocessing import StandardScaler
scaler = StandardScaler()
df_scaled[col_names] = scaler.fit_transform(features.values)
df_scaled](https://image.slidesharecdn.com/ml-unit-4-231213121706-b789c840/85/ML-Unit-4-pdf-21-320.jpg)