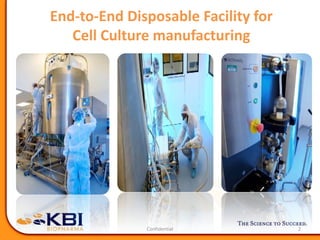
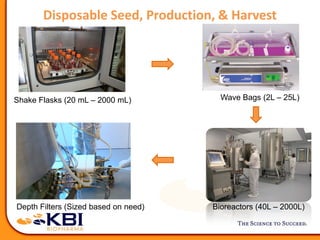
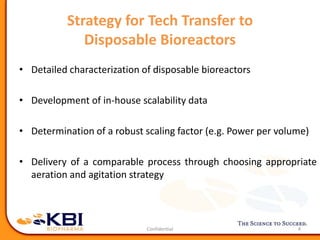
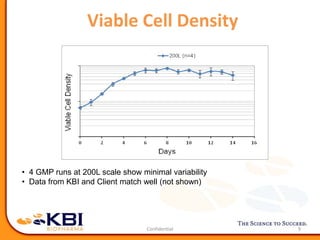
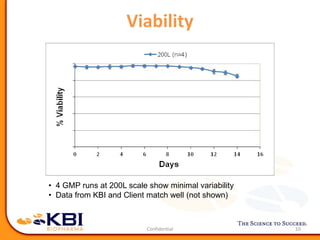
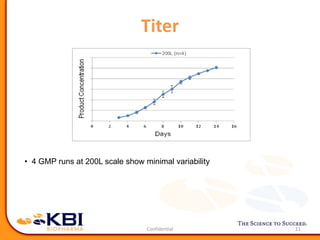
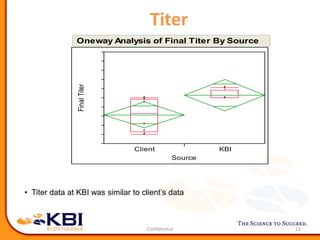
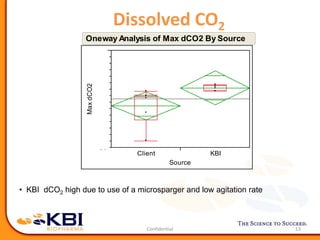
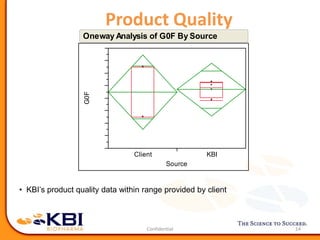
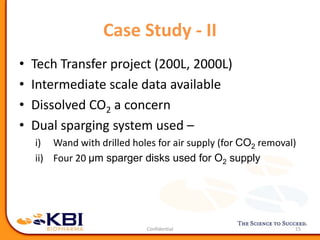
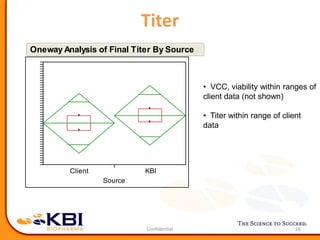
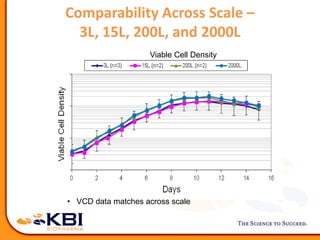
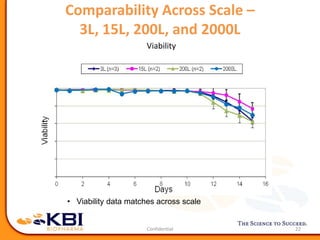
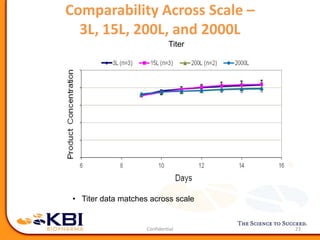
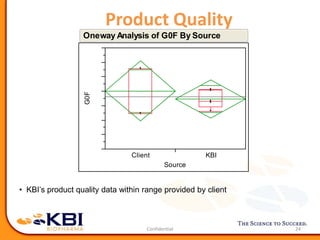
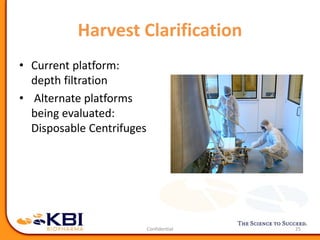
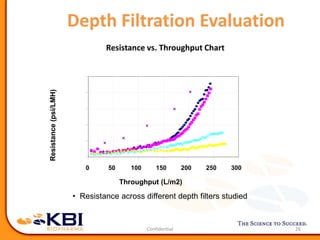
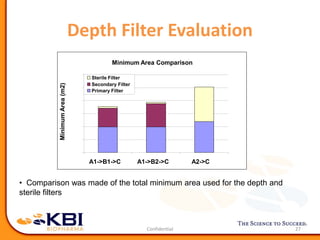
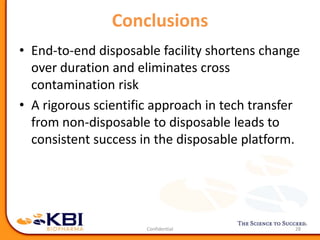
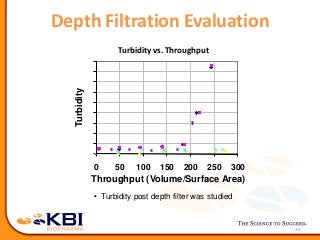
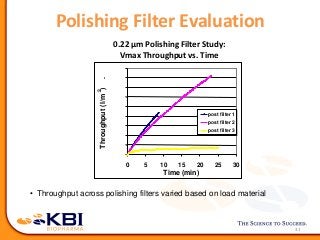
A Case Study of Scale-up and Tech
Transfer from Non-Disposable to Fully
Disposable Systems
Sigma S. Mostafa, Ph.D., Director, Upstream Development
Abhinav Shukla, Ph.D., Vice President , Process Development
2Confidential
End-to-End Disposable Facility for
Cell Culture manufacturing
Disposable Seed, Production, & Harvest
Shake Flasks (20 mL – 2000 mL) Wave Bags (2L – 25L)
Bioreactors (40L – 2000L)Depth Filters (Sized based on need)
Strategy for Tech Transfer to
Disposable Bioreactors
• Detailed characterization of disposable bioreactors
• Development of in-house scalability data
• Determination of a robust scaling factor (e.g. Power per volume)
• Delivery of a comparable process through choosing appropriate
aeration and agitation strategy
4
Characterization of Bioreactors
• Response surface DOE for Mass Transfer Coefficient (kLa)
• Salt solution with ionic strength similar to cell culture
• Sparging Rate, Agitation Rate, and Working Volumes
are key factors
200L Disposable Bioreactor with 20um Sparger
Sparger Selection
6
• Vendors offer multiple options for spargers:
2 μm, 20 μm, 0.5 mm, 1.0 mm
• Multiple disks of same porosity is available
• A dual sparger system: 1) micro and/or macro
sparger disks for oxygen; 2) wand (drilled pipe)
for air is available
• Each of these options will lead to different
mixing characteristics
Impact of Probes
7
• Depending on agitation rate, impeller
orientation, and working volume, probe
location may impact probe reading
• Disposable probes preferable; however,
accuracy is still under question
Case Study - I
• Tech Transfer project (200L)
• At scale data available from other bioreactor
systems
• Shear damage a concern; as a result relatively
low agitation is used
• Sparger disk with 2 μm porosity used
8
Viable Cell Density
9
• 4 GMP runs at 200L scale show minimal variability
• Data from KBI and Client match well (not shown)
Viability
10
• 4 GMP runs at 200L scale show minimal variability
• Data from KBI and Client match well (not shown)
Titer
11
• 4 GMP runs at 200L scale show minimal variability
• Data from KBI and Client match well (not shown)
Titer
12
• Titer data at KBI was similar to client’s data
2
2.1
2.2
2.3
2.4
2.5
2.6
2.7
2.8
2.9
3
FinalTiter
Client KBI
Source
Onew ay Analysis of Final Titer By Source
Dissolved CO2
13
• KBI dCO2 high due to use of a microsparger and low agitation rate
50
70
90
110
130
150
170
190
MaxdCO2
Client KBI
Source
Onew ay Analysis of Max dCO2 By Source
Product Quality
14
• KBI’s product quality data within range provided by client
60
65
70
75
80
85
90
95
100
G0F
Client KBI
Source
Onew ay Analysis of G0F By Source
Case Study - II
15
• Tech Transfer project (200L, 2000L)
• Intermediate scale data available
• Dissolved CO2 a concern
• Dual sparging system used –
i) Wand with drilled holes for air supply (for CO2 removal)
ii) Four 20 μm sparger disks used for O2 supply
Titer
16
• VCC, viability within ranges of
client data (not shown)
• Titer within range of client
data
0.5
1
1.5
2
2.5
3
3.5
4
4.5
5
Client KBI
Source
Onew ay Analysis of Final Titer By Source
Case Study - III
17
• Process Development project
• Data generated in 3L and 10L glass
bioreactors, and 200L and 2000L bioreactors
• Oxygen uptake rate (per cell) was high; cells
were sensitive to high dissolved CO2
• Antifoam addition was not an option
Upstream Process Development
18
Shake Flask vs. 3L Bioreactor
19
Titer
Different Feed & Supplement Combinations
3L Glass Bioreactor Characterization
20
kLa
kLa
• Characterization of small scale bioreactors is a necessity
• Per cell oxygen uptake rate was determined at this scale
Comparability Across Scale –
3L, 15L, 200L, and 2000L
Viable Cell Density
• VCD data matches across scale
Viability
22
• Viability data matches across scale
Comparability Across Scale –
3L, 15L, 200L, and 2000L
23
• Titer data matches across scale
Titer
Comparability Across Scale –
3L, 15L, 200L, and 2000L
Product Quality
24
• KBI’s product quality data within range provided by client
25
30
35
40
45
50
55
60
G0F
Client KBI
Source
Onew ay Analysis of G0F By Source
Harvest Clarification
• Current platform:
depth filtration
• Alternate platforms
being evaluated:
Disposable Centrifuges
25
Resistance vs. Throughput Chart
26
0.00
0.05
0.10
0.15
0.20
0.25
0 50 100 150 200 250 300
Throughput (L/m2)
Resistance(psi/LMH)
Depth Filtration Evaluation
• Resistance across different depth filters studied
Depth Filter Evaluation
27
Minimum Area Comparison
0.0
0.5
1.0
1.5
2.0
2.5
3.0
A1->B1->C A1->B2->C A2->C
MinimumArea(m2)
Sterile Filter
Secondary Filter
Primary Filter
• Comparison was made of the total minimum area used for the depth and
sterile filters
Conclusions
• End-to-end disposable facility shortens change
over duration and eliminates cross
contamination risk
• A rigorous scientific approach in tech transfer
from non-disposable to disposable leads to
consistent success in the disposable platform.
28
Questions ?
Contact Information:
Sigma S. Mostafa, Ph.D.
Director, Process Development
KBI Biopharma Inc.
1101 Hamlin Road
Durham, NC 27704
smostafa@kbibiopharma.com
29
Depth Filtration Evaluation
30
Turbidity vs. Throughput
0 50 100 150 200 250 300
Throughput (Volume/Surface Area)
Turbidity
• Turbidity post depth filter was studied
0.22 μm Polishing Filter Study:
Vmax Throughput vs. Time
31
0 5 10 15 20 25 30
Time (min)
Throughput(l/m2
).
post filter 1
post filter 2
post filter 3
Polishing Filter Evaluation
• Throughput across polishing filters varied based on load material
www.kbibiopharma.com
32

Scale-up & Tech Transfer from Non-disposable to Fully Disposable Systems

  • 1.
    A Case Studyof Scale-up and Tech Transfer from Non-Disposable to Fully Disposable Systems Sigma S. Mostafa, Ph.D., Director, Upstream Development Abhinav Shukla, Ph.D., Vice President , Process Development
  • 2.
    2Confidential End-to-End Disposable Facilityfor Cell Culture manufacturing
  • 3.
    Disposable Seed, Production,& Harvest Shake Flasks (20 mL – 2000 mL) Wave Bags (2L – 25L) Bioreactors (40L – 2000L)Depth Filters (Sized based on need)
  • 4.
    Strategy for TechTransfer to Disposable Bioreactors • Detailed characterization of disposable bioreactors • Development of in-house scalability data • Determination of a robust scaling factor (e.g. Power per volume) • Delivery of a comparable process through choosing appropriate aeration and agitation strategy 4
  • 5.
    Characterization of Bioreactors •Response surface DOE for Mass Transfer Coefficient (kLa) • Salt solution with ionic strength similar to cell culture • Sparging Rate, Agitation Rate, and Working Volumes are key factors 200L Disposable Bioreactor with 20um Sparger
  • 6.
    Sparger Selection 6 • Vendorsoffer multiple options for spargers: 2 μm, 20 μm, 0.5 mm, 1.0 mm • Multiple disks of same porosity is available • A dual sparger system: 1) micro and/or macro sparger disks for oxygen; 2) wand (drilled pipe) for air is available • Each of these options will lead to different mixing characteristics
  • 7.
    Impact of Probes 7 •Depending on agitation rate, impeller orientation, and working volume, probe location may impact probe reading • Disposable probes preferable; however, accuracy is still under question
  • 8.
    Case Study -I • Tech Transfer project (200L) • At scale data available from other bioreactor systems • Shear damage a concern; as a result relatively low agitation is used • Sparger disk with 2 μm porosity used 8
  • 9.
    Viable Cell Density 9 •4 GMP runs at 200L scale show minimal variability • Data from KBI and Client match well (not shown)
  • 10.
    Viability 10 • 4 GMPruns at 200L scale show minimal variability • Data from KBI and Client match well (not shown)
  • 11.
    Titer 11 • 4 GMPruns at 200L scale show minimal variability • Data from KBI and Client match well (not shown)
  • 12.
    Titer 12 • Titer dataat KBI was similar to client’s data 2 2.1 2.2 2.3 2.4 2.5 2.6 2.7 2.8 2.9 3 FinalTiter Client KBI Source Onew ay Analysis of Final Titer By Source
  • 13.
    Dissolved CO2 13 • KBIdCO2 high due to use of a microsparger and low agitation rate 50 70 90 110 130 150 170 190 MaxdCO2 Client KBI Source Onew ay Analysis of Max dCO2 By Source
  • 14.
    Product Quality 14 • KBI’sproduct quality data within range provided by client 60 65 70 75 80 85 90 95 100 G0F Client KBI Source Onew ay Analysis of G0F By Source
  • 15.
    Case Study -II 15 • Tech Transfer project (200L, 2000L) • Intermediate scale data available • Dissolved CO2 a concern • Dual sparging system used – i) Wand with drilled holes for air supply (for CO2 removal) ii) Four 20 μm sparger disks used for O2 supply
  • 16.
    Titer 16 • VCC, viabilitywithin ranges of client data (not shown) • Titer within range of client data 0.5 1 1.5 2 2.5 3 3.5 4 4.5 5 Client KBI Source Onew ay Analysis of Final Titer By Source
  • 17.
    Case Study -III 17 • Process Development project • Data generated in 3L and 10L glass bioreactors, and 200L and 2000L bioreactors • Oxygen uptake rate (per cell) was high; cells were sensitive to high dissolved CO2 • Antifoam addition was not an option
  • 18.
  • 19.
    Shake Flask vs.3L Bioreactor 19 Titer Different Feed & Supplement Combinations
  • 20.
    3L Glass BioreactorCharacterization 20 kLa kLa • Characterization of small scale bioreactors is a necessity • Per cell oxygen uptake rate was determined at this scale
  • 21.
    Comparability Across Scale– 3L, 15L, 200L, and 2000L Viable Cell Density • VCD data matches across scale
  • 22.
    Viability 22 • Viability datamatches across scale Comparability Across Scale – 3L, 15L, 200L, and 2000L
  • 23.
    23 • Titer datamatches across scale Titer Comparability Across Scale – 3L, 15L, 200L, and 2000L
  • 24.
    Product Quality 24 • KBI’sproduct quality data within range provided by client 25 30 35 40 45 50 55 60 G0F Client KBI Source Onew ay Analysis of G0F By Source
  • 25.
    Harvest Clarification • Currentplatform: depth filtration • Alternate platforms being evaluated: Disposable Centrifuges 25
  • 26.
    Resistance vs. ThroughputChart 26 0.00 0.05 0.10 0.15 0.20 0.25 0 50 100 150 200 250 300 Throughput (L/m2) Resistance(psi/LMH) Depth Filtration Evaluation • Resistance across different depth filters studied
  • 27.
    Depth Filter Evaluation 27 MinimumArea Comparison 0.0 0.5 1.0 1.5 2.0 2.5 3.0 A1->B1->C A1->B2->C A2->C MinimumArea(m2) Sterile Filter Secondary Filter Primary Filter • Comparison was made of the total minimum area used for the depth and sterile filters
  • 28.
    Conclusions • End-to-end disposablefacility shortens change over duration and eliminates cross contamination risk • A rigorous scientific approach in tech transfer from non-disposable to disposable leads to consistent success in the disposable platform. 28
  • 29.
    Questions ? Contact Information: SigmaS. Mostafa, Ph.D. Director, Process Development KBI Biopharma Inc. 1101 Hamlin Road Durham, NC 27704 smostafa@kbibiopharma.com 29
  • 30.
    Depth Filtration Evaluation 30 Turbidityvs. Throughput 0 50 100 150 200 250 300 Throughput (Volume/Surface Area) Turbidity • Turbidity post depth filter was studied
  • 31.
    0.22 μm PolishingFilter Study: Vmax Throughput vs. Time 31 0 5 10 15 20 25 30 Time (min) Throughput(l/m2 ). post filter 1 post filter 2 post filter 3 Polishing Filter Evaluation • Throughput across polishing filters varied based on load material
  • 32.