Downloaded 1,190 times


This document discusses scalar and vector quantities. It defines a scalar quantity as having only magnitude, while a vector quantity has both magnitude and direction. Examples are given of quantities that are scalar like distance and those that are vector like force. The document also discusses the concept of a resultant vector, which results from adding two or more vectors together. Three techniques for finding the magnitude and angle of the resultant vector are described: the graphical method, Pythagorean theorem, and analytical/component method. The component method involves breaking vectors into their x and y components and then adding the components.
Overview of scalar and vector quantities, detailing definitions and key differences.
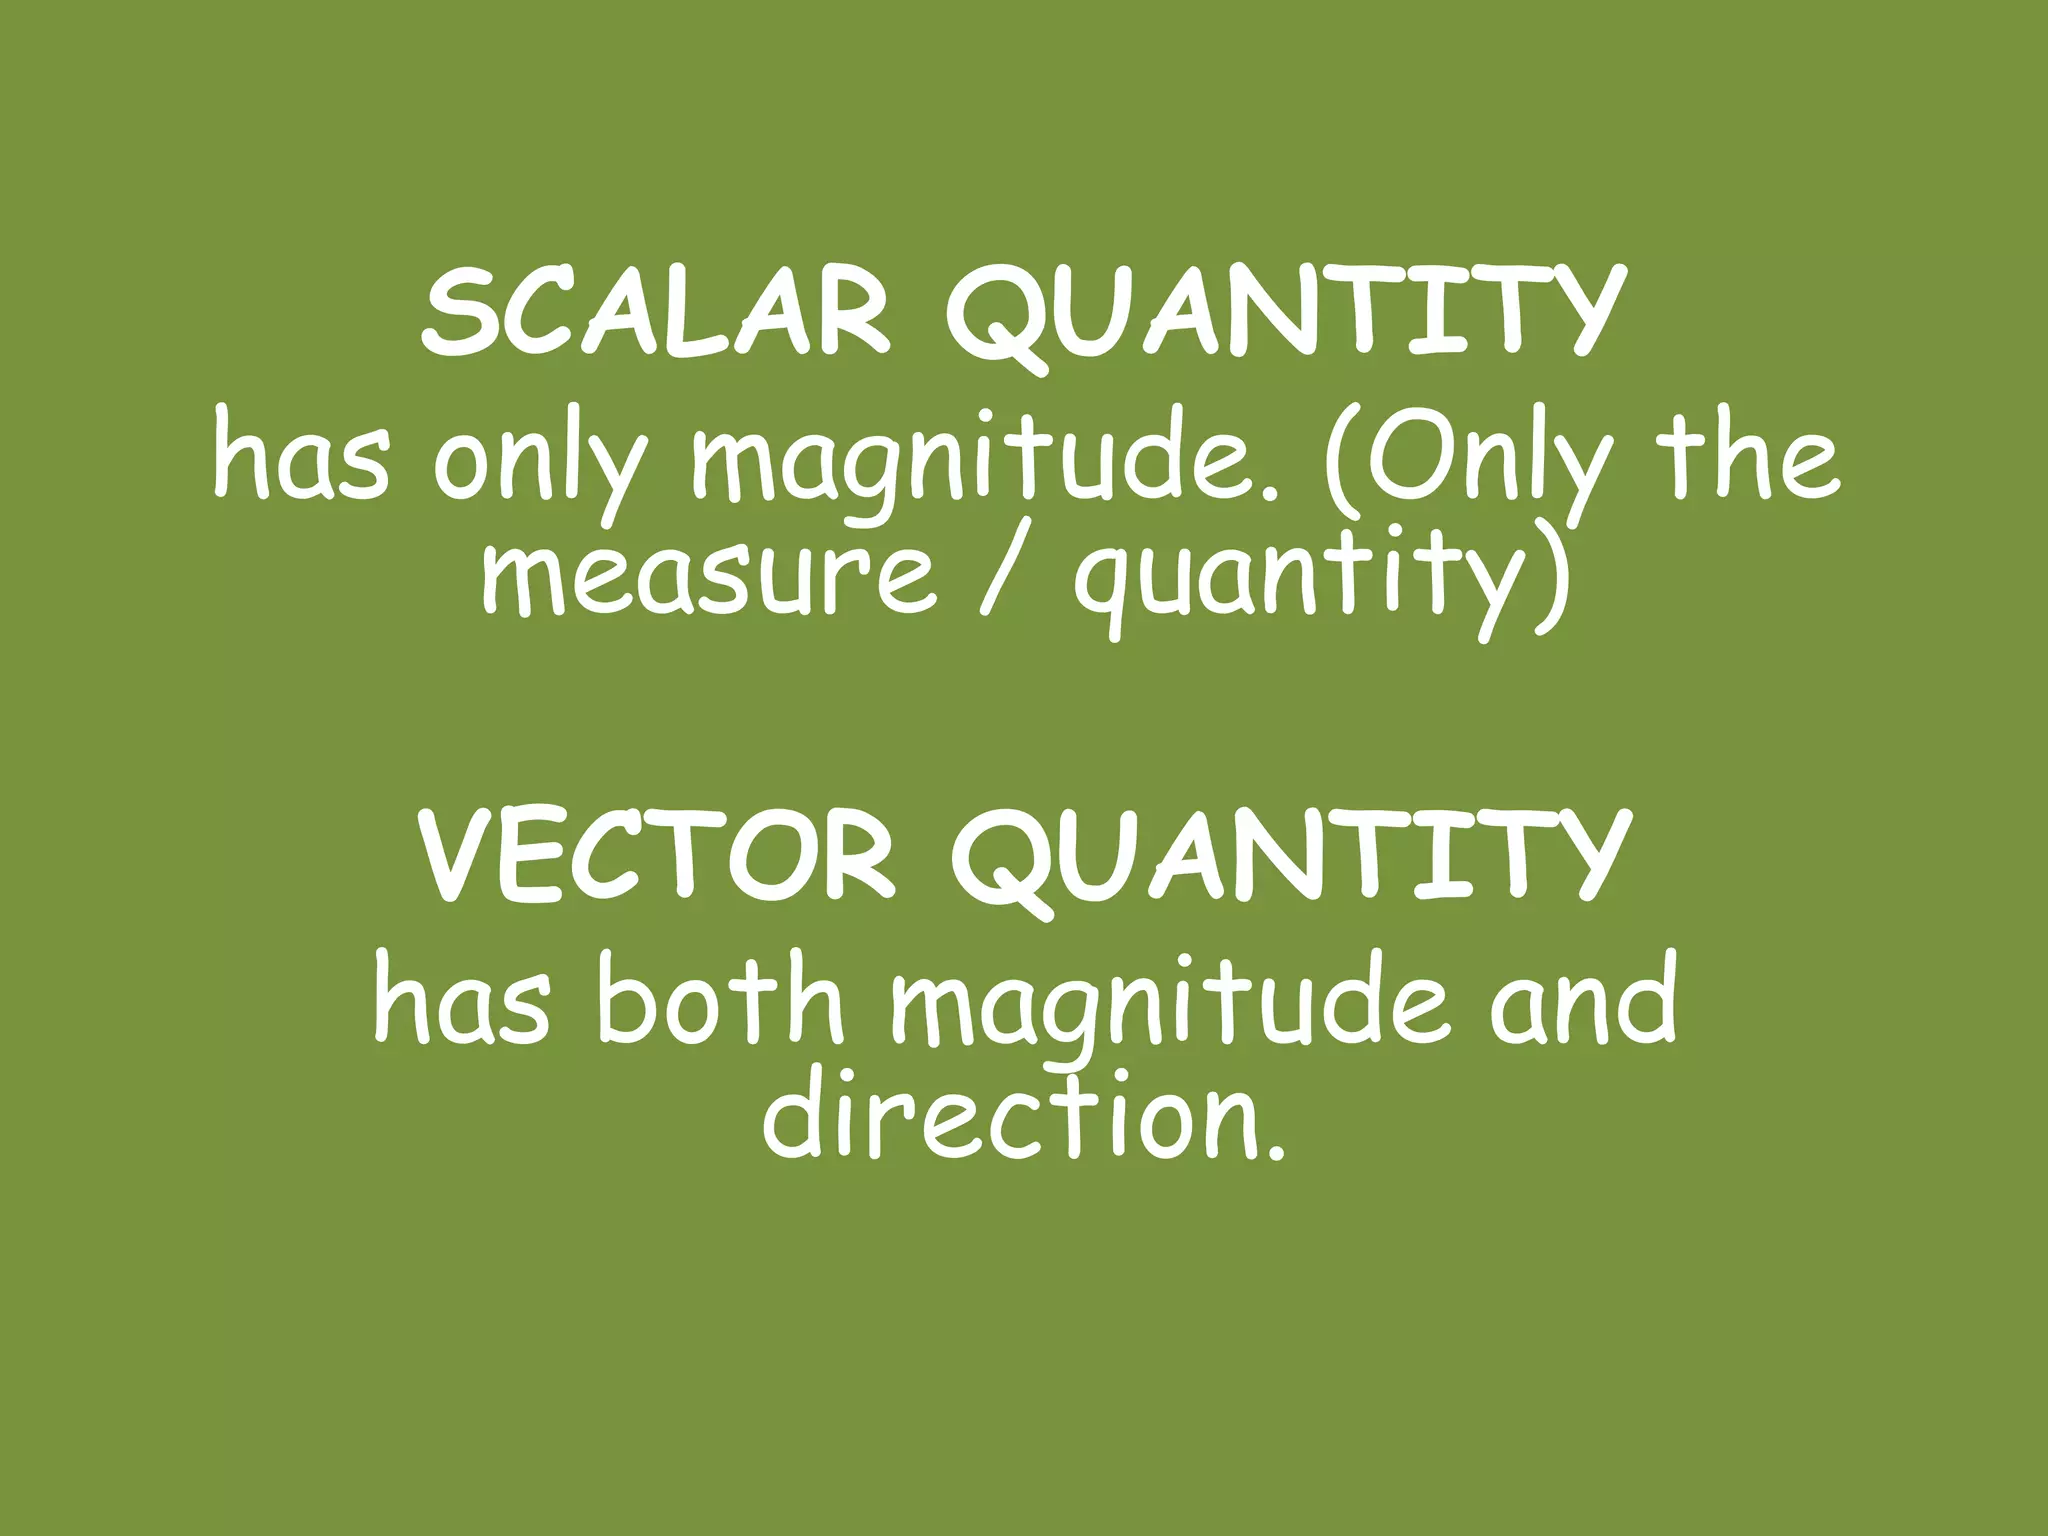
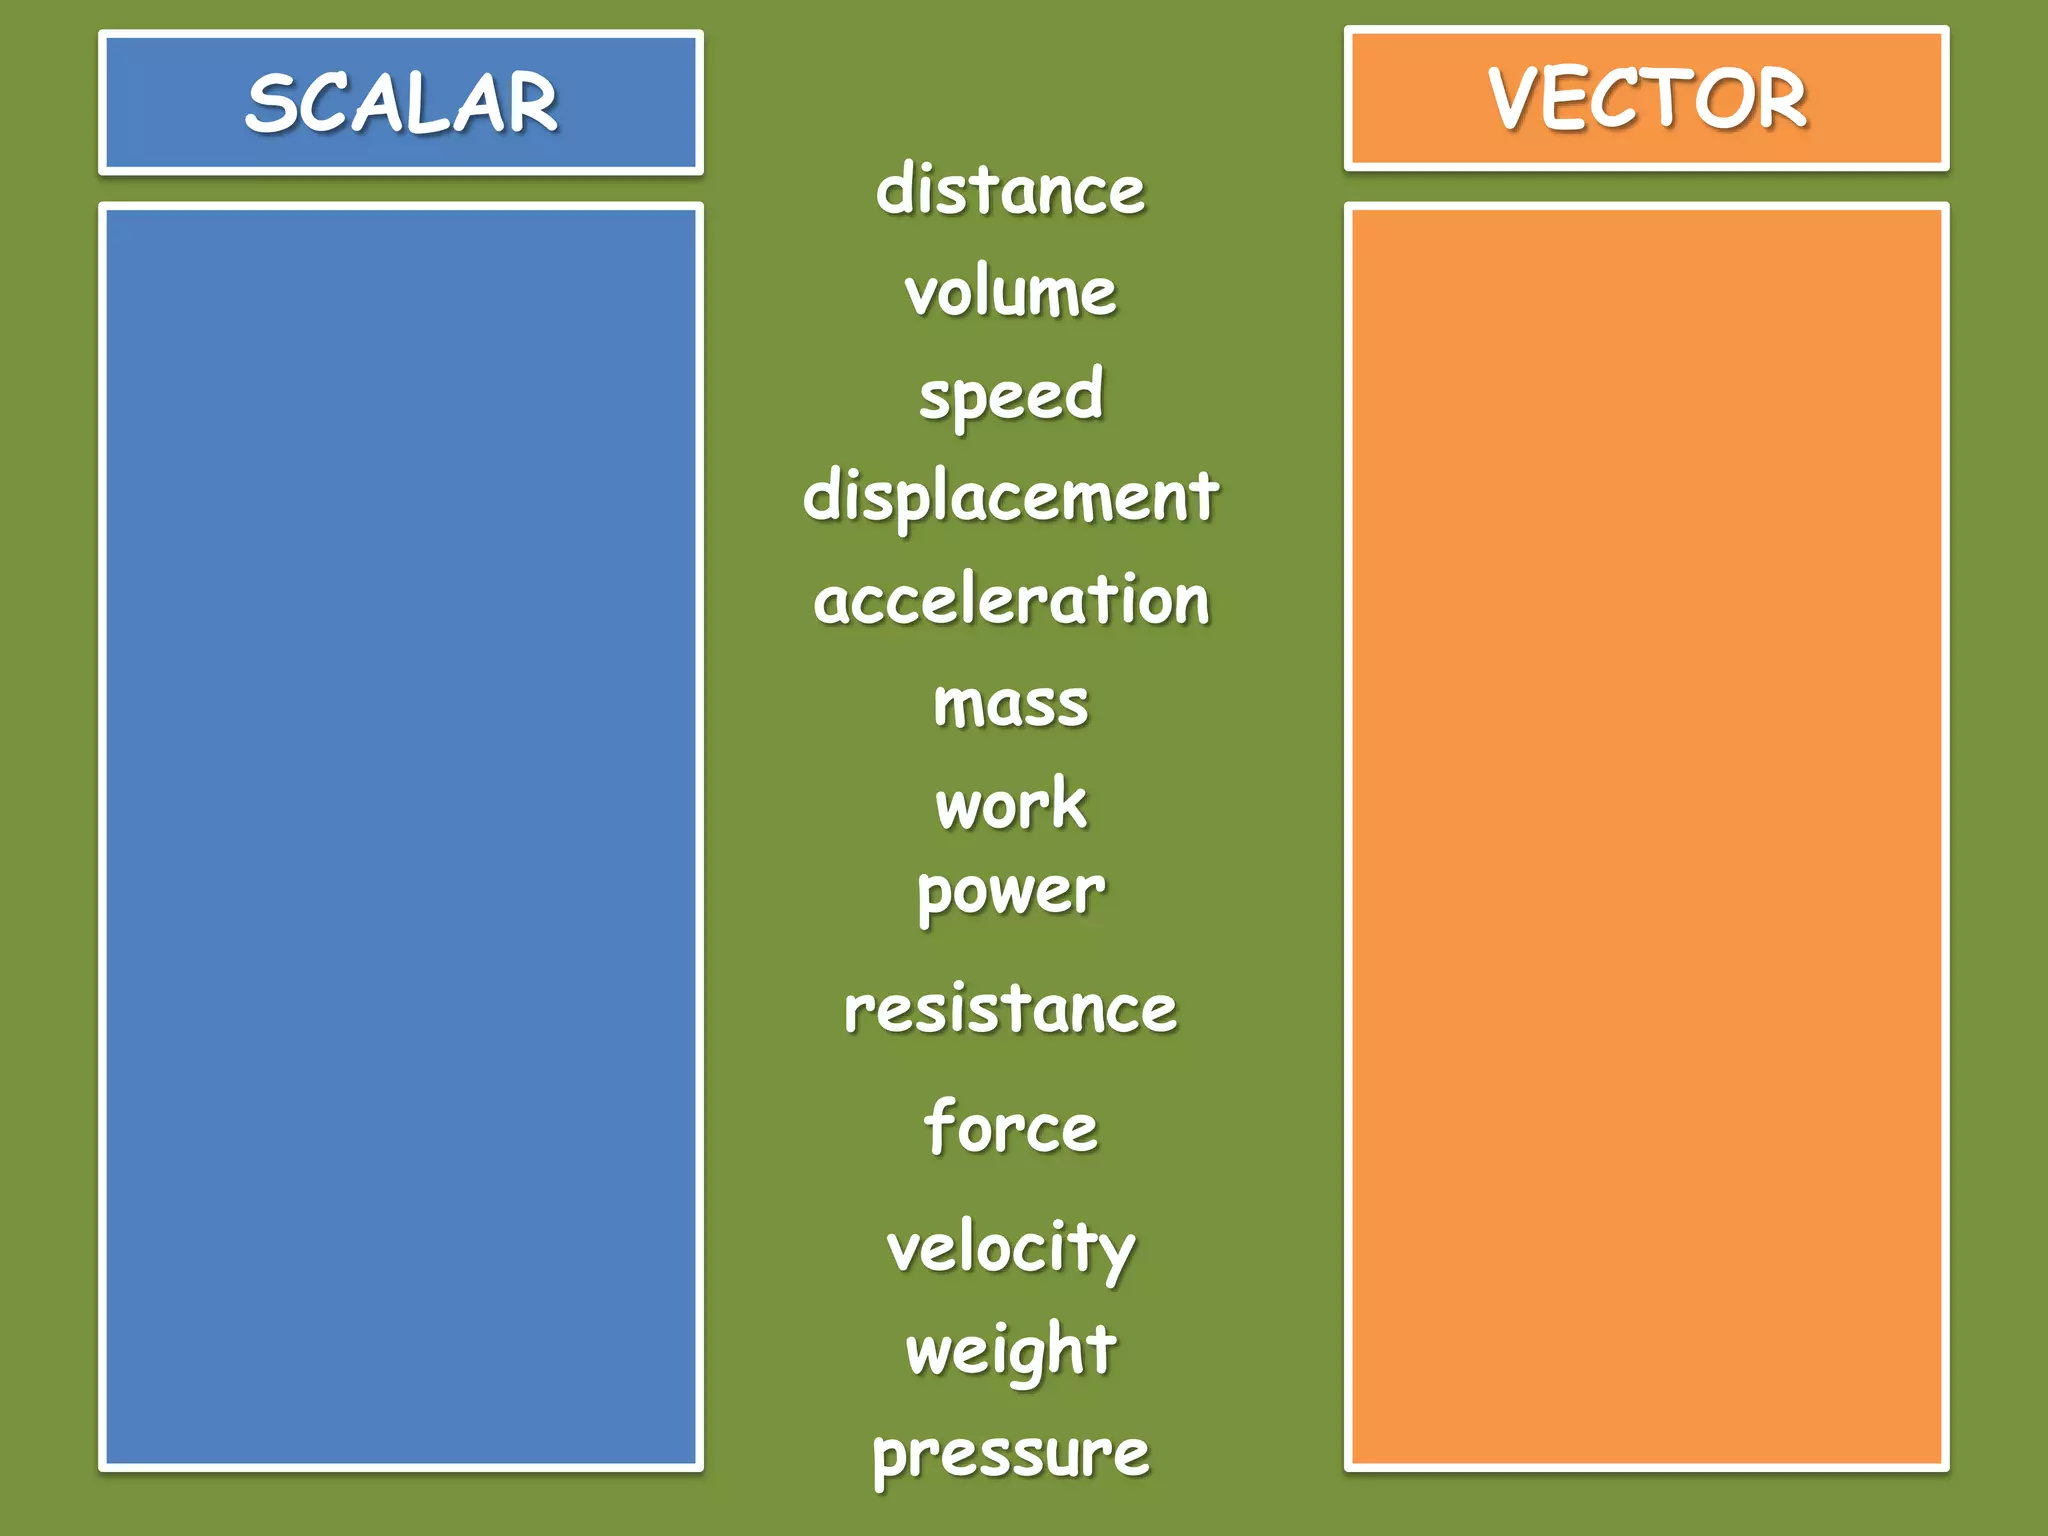
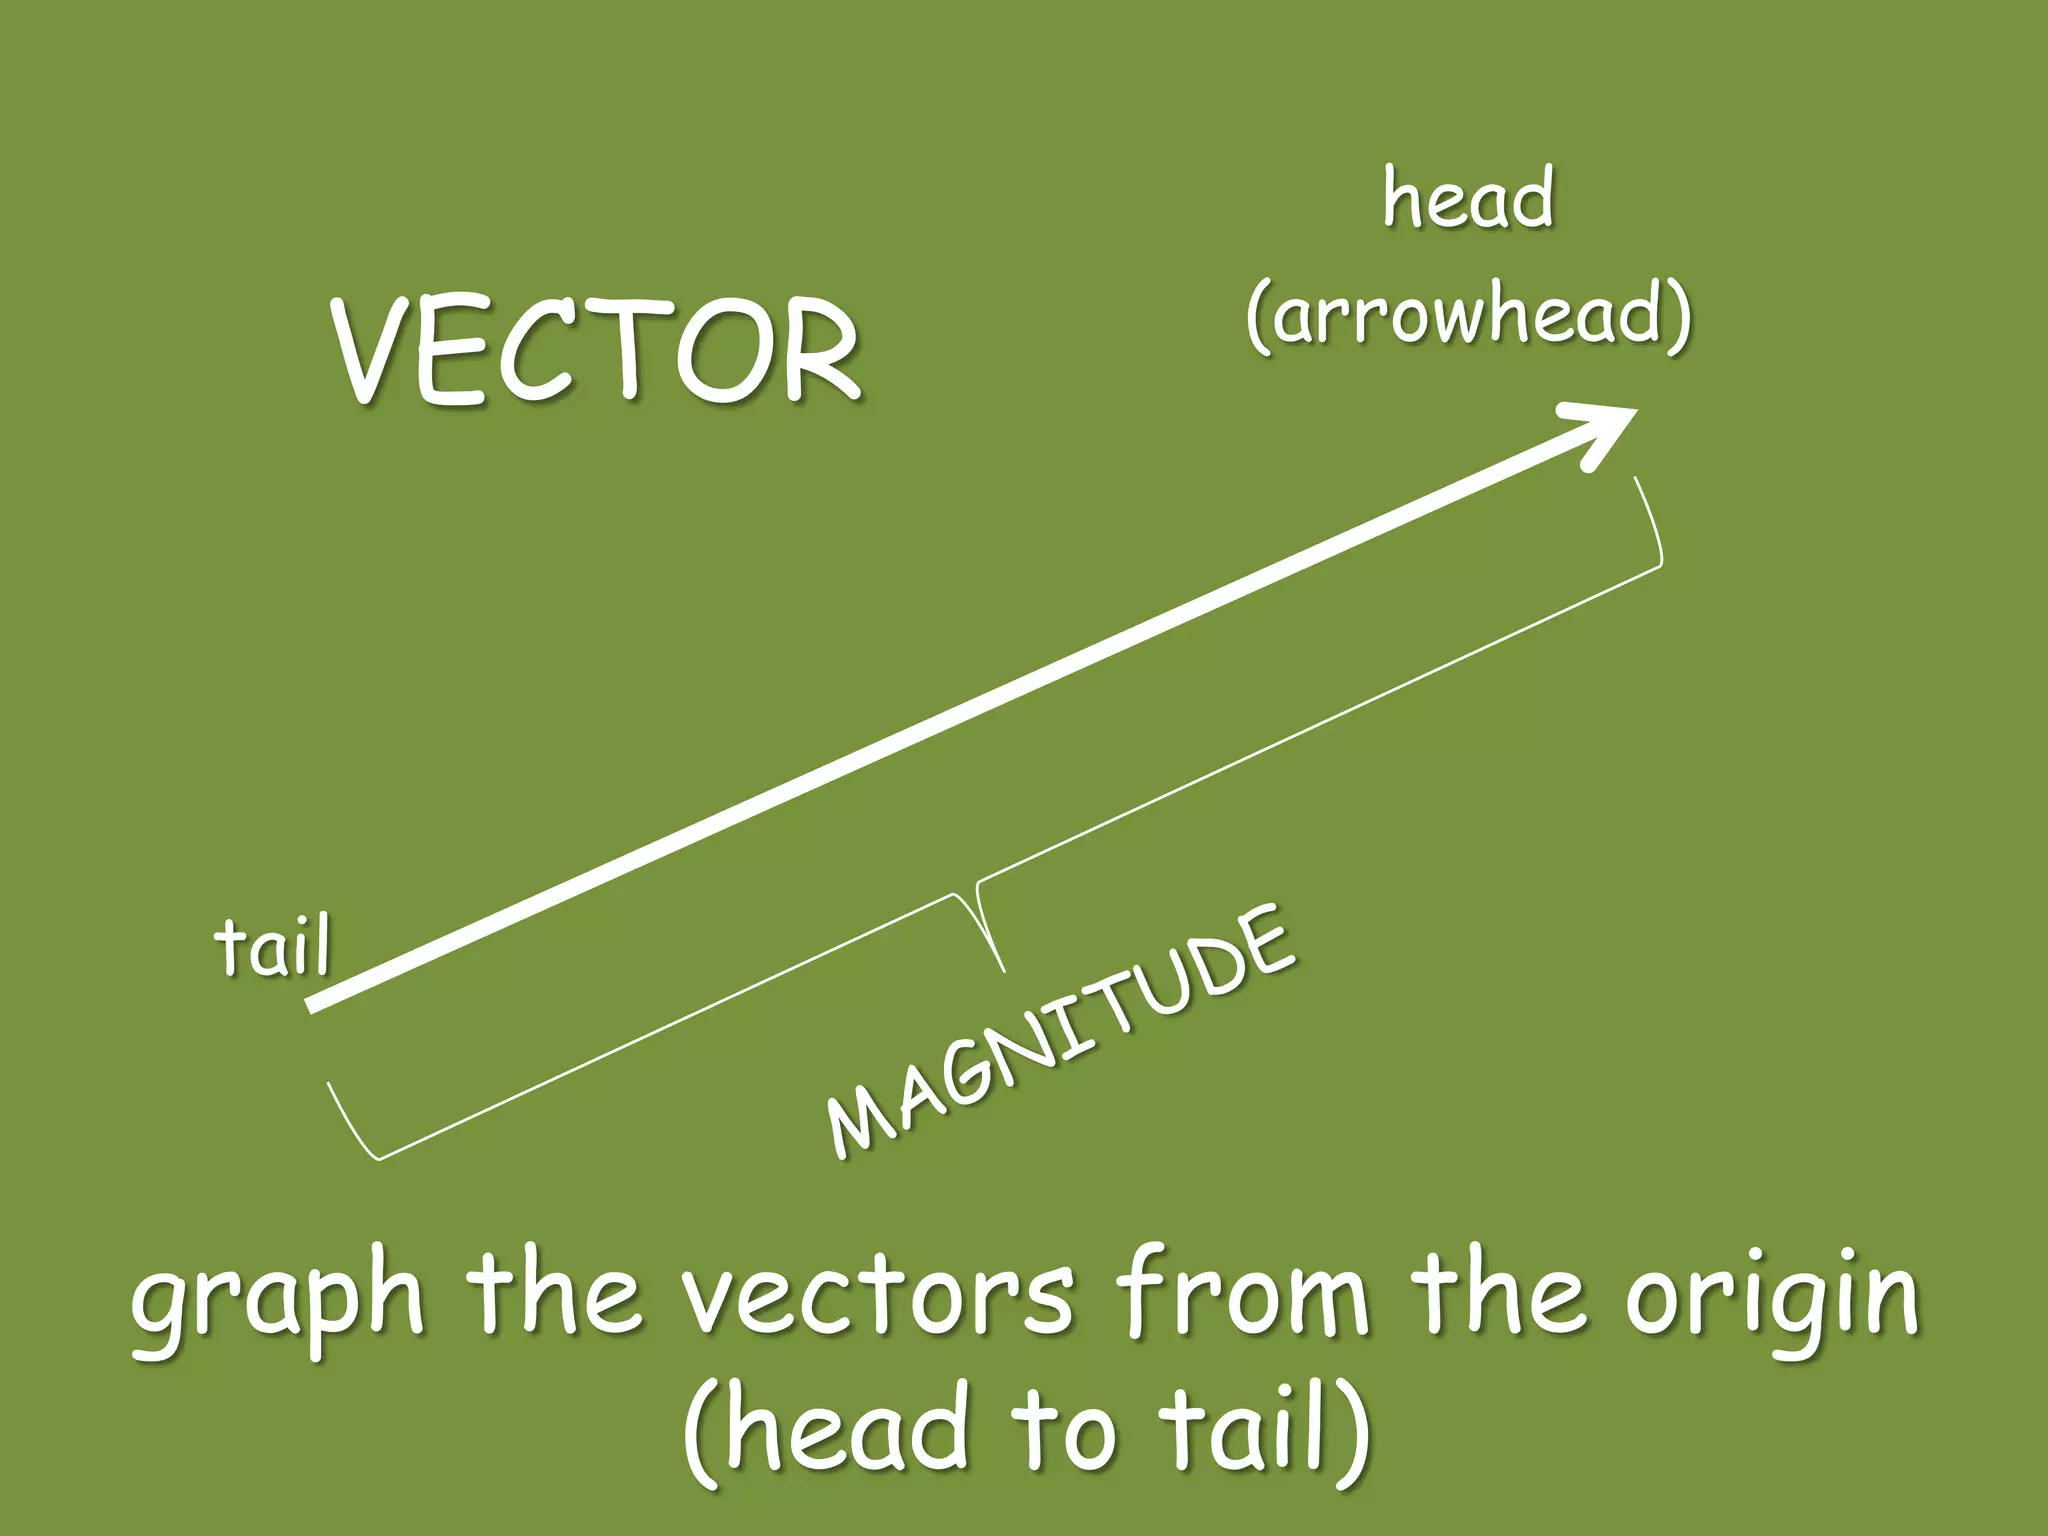
Scalars have magnitude; vectors have both magnitude and direction; includes examples of each.
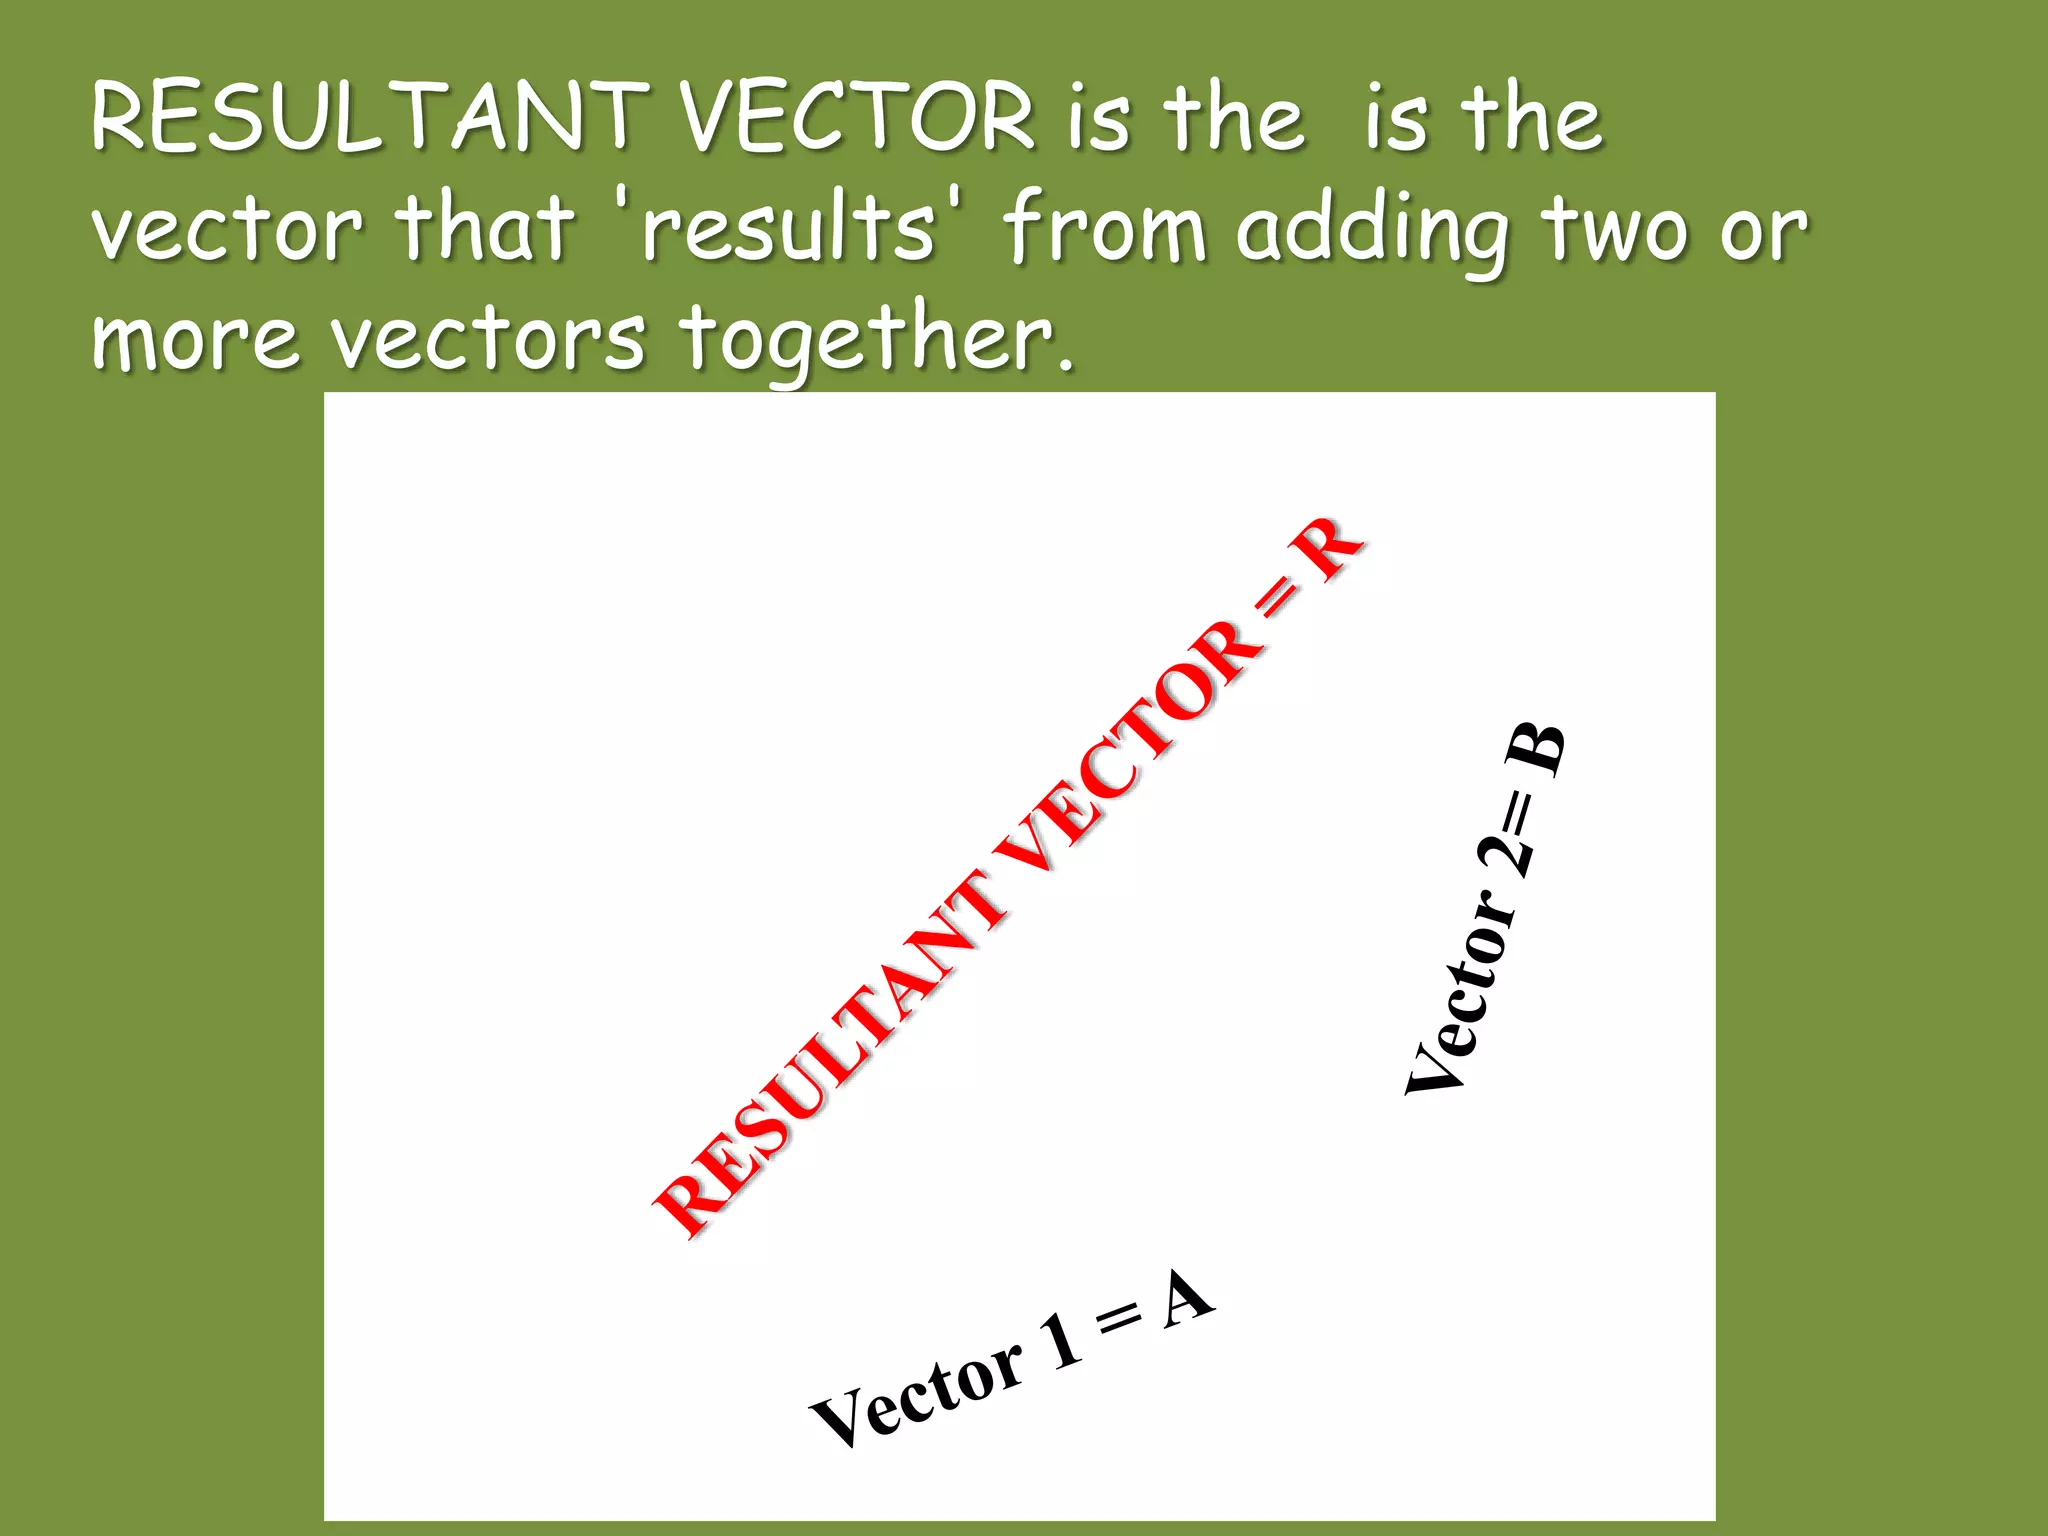
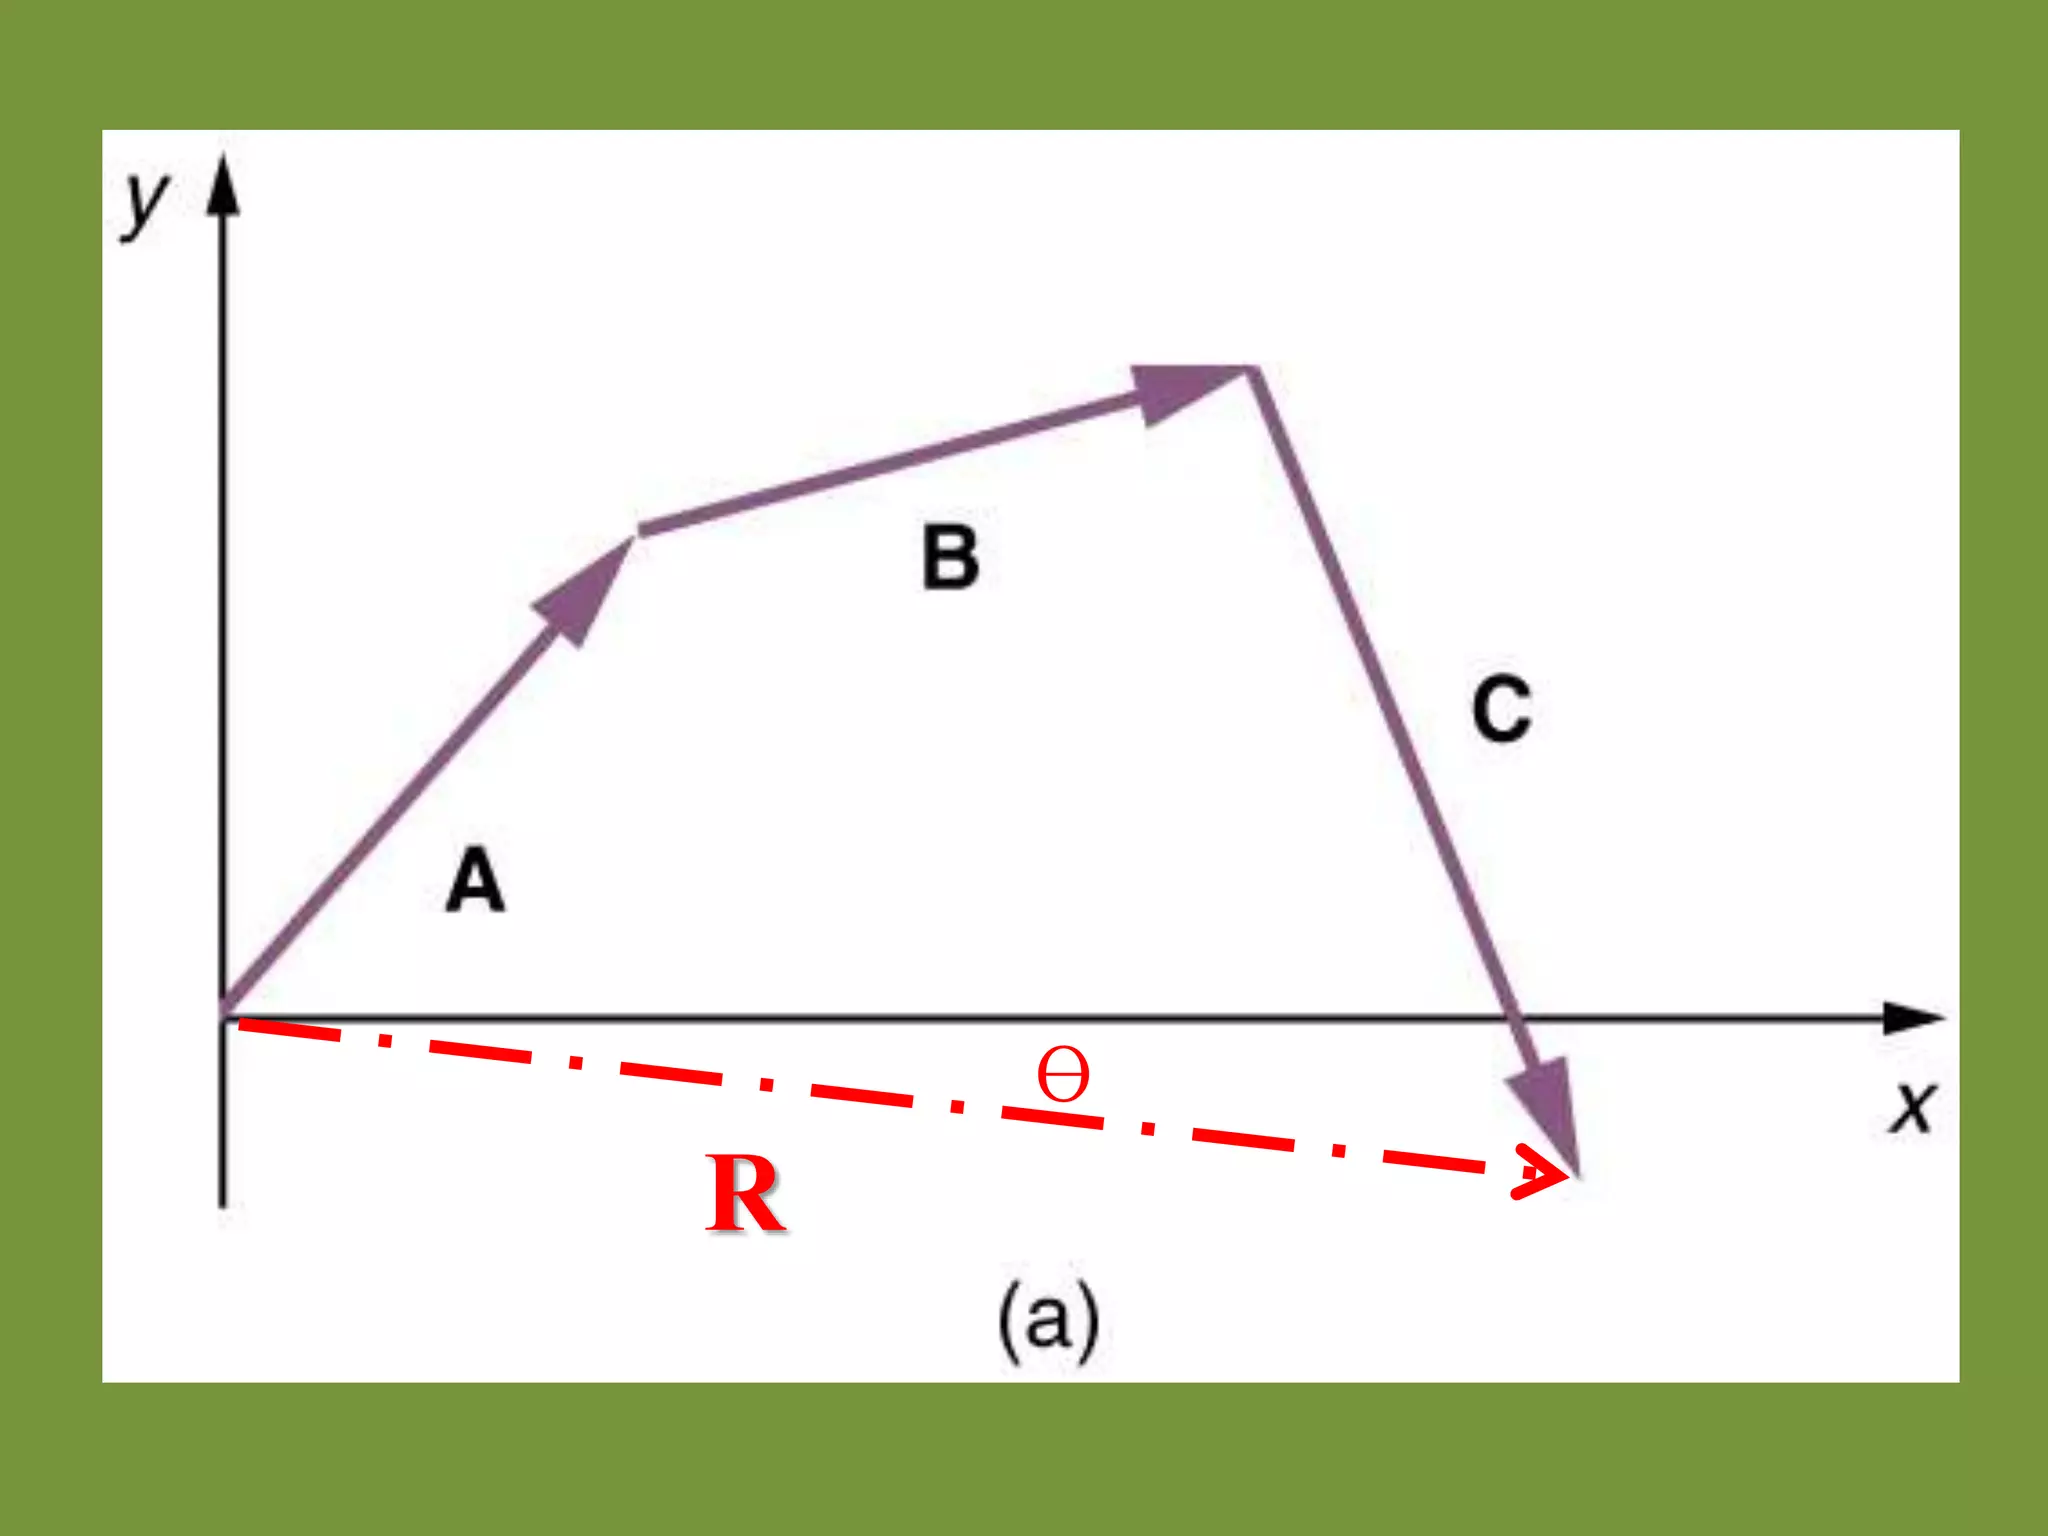
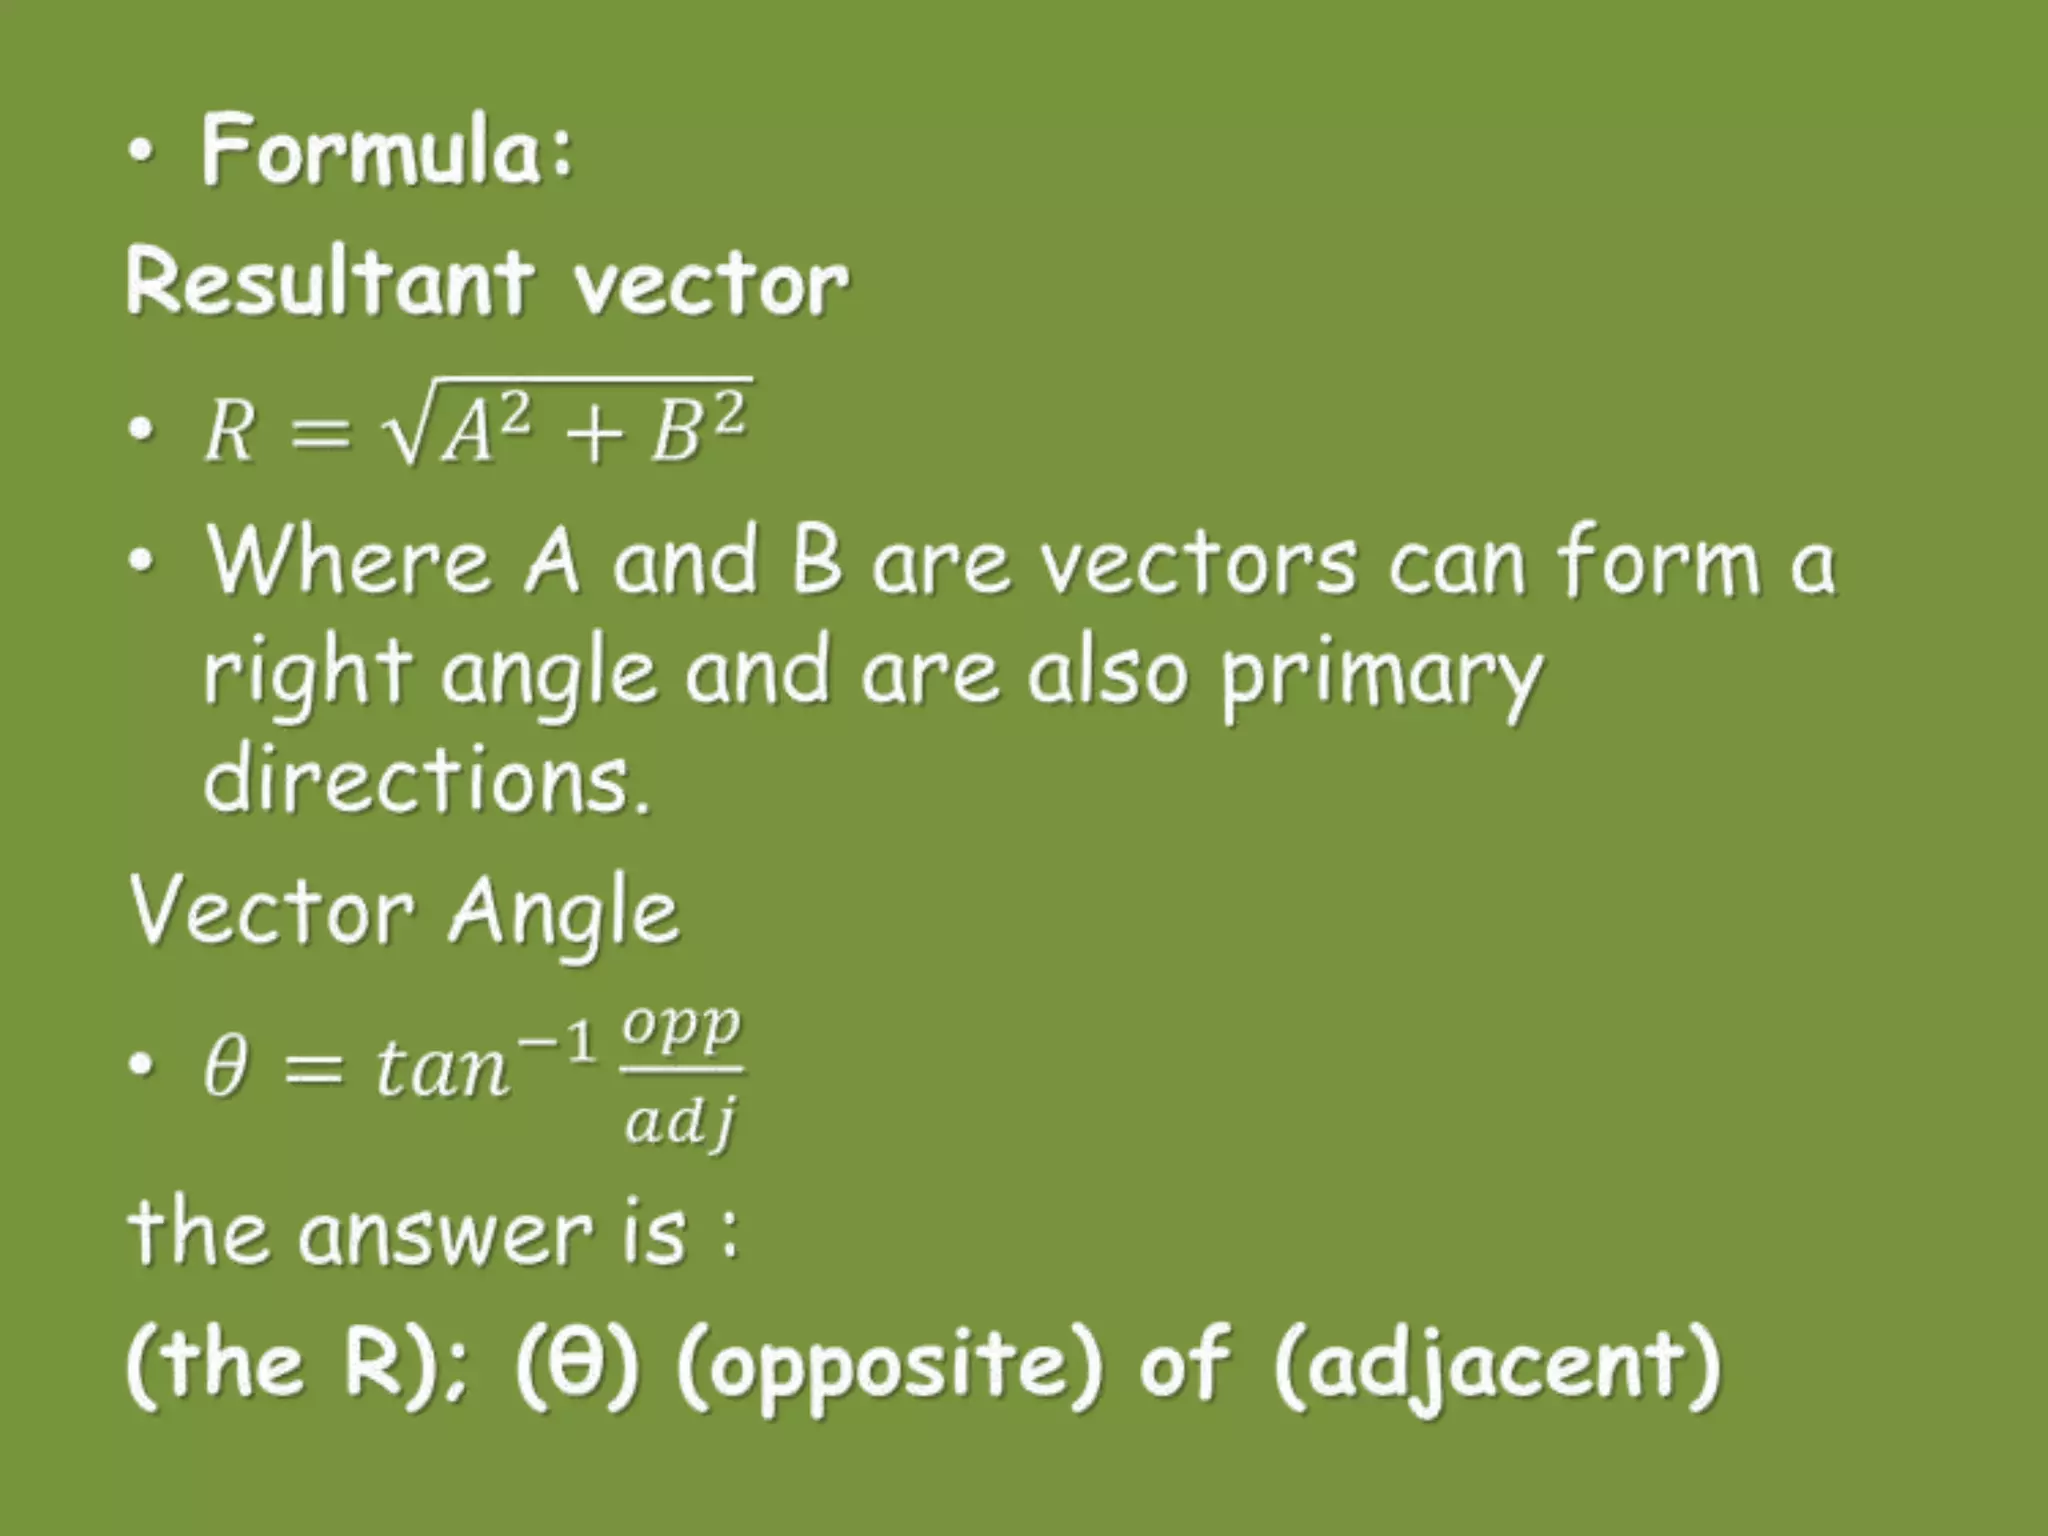
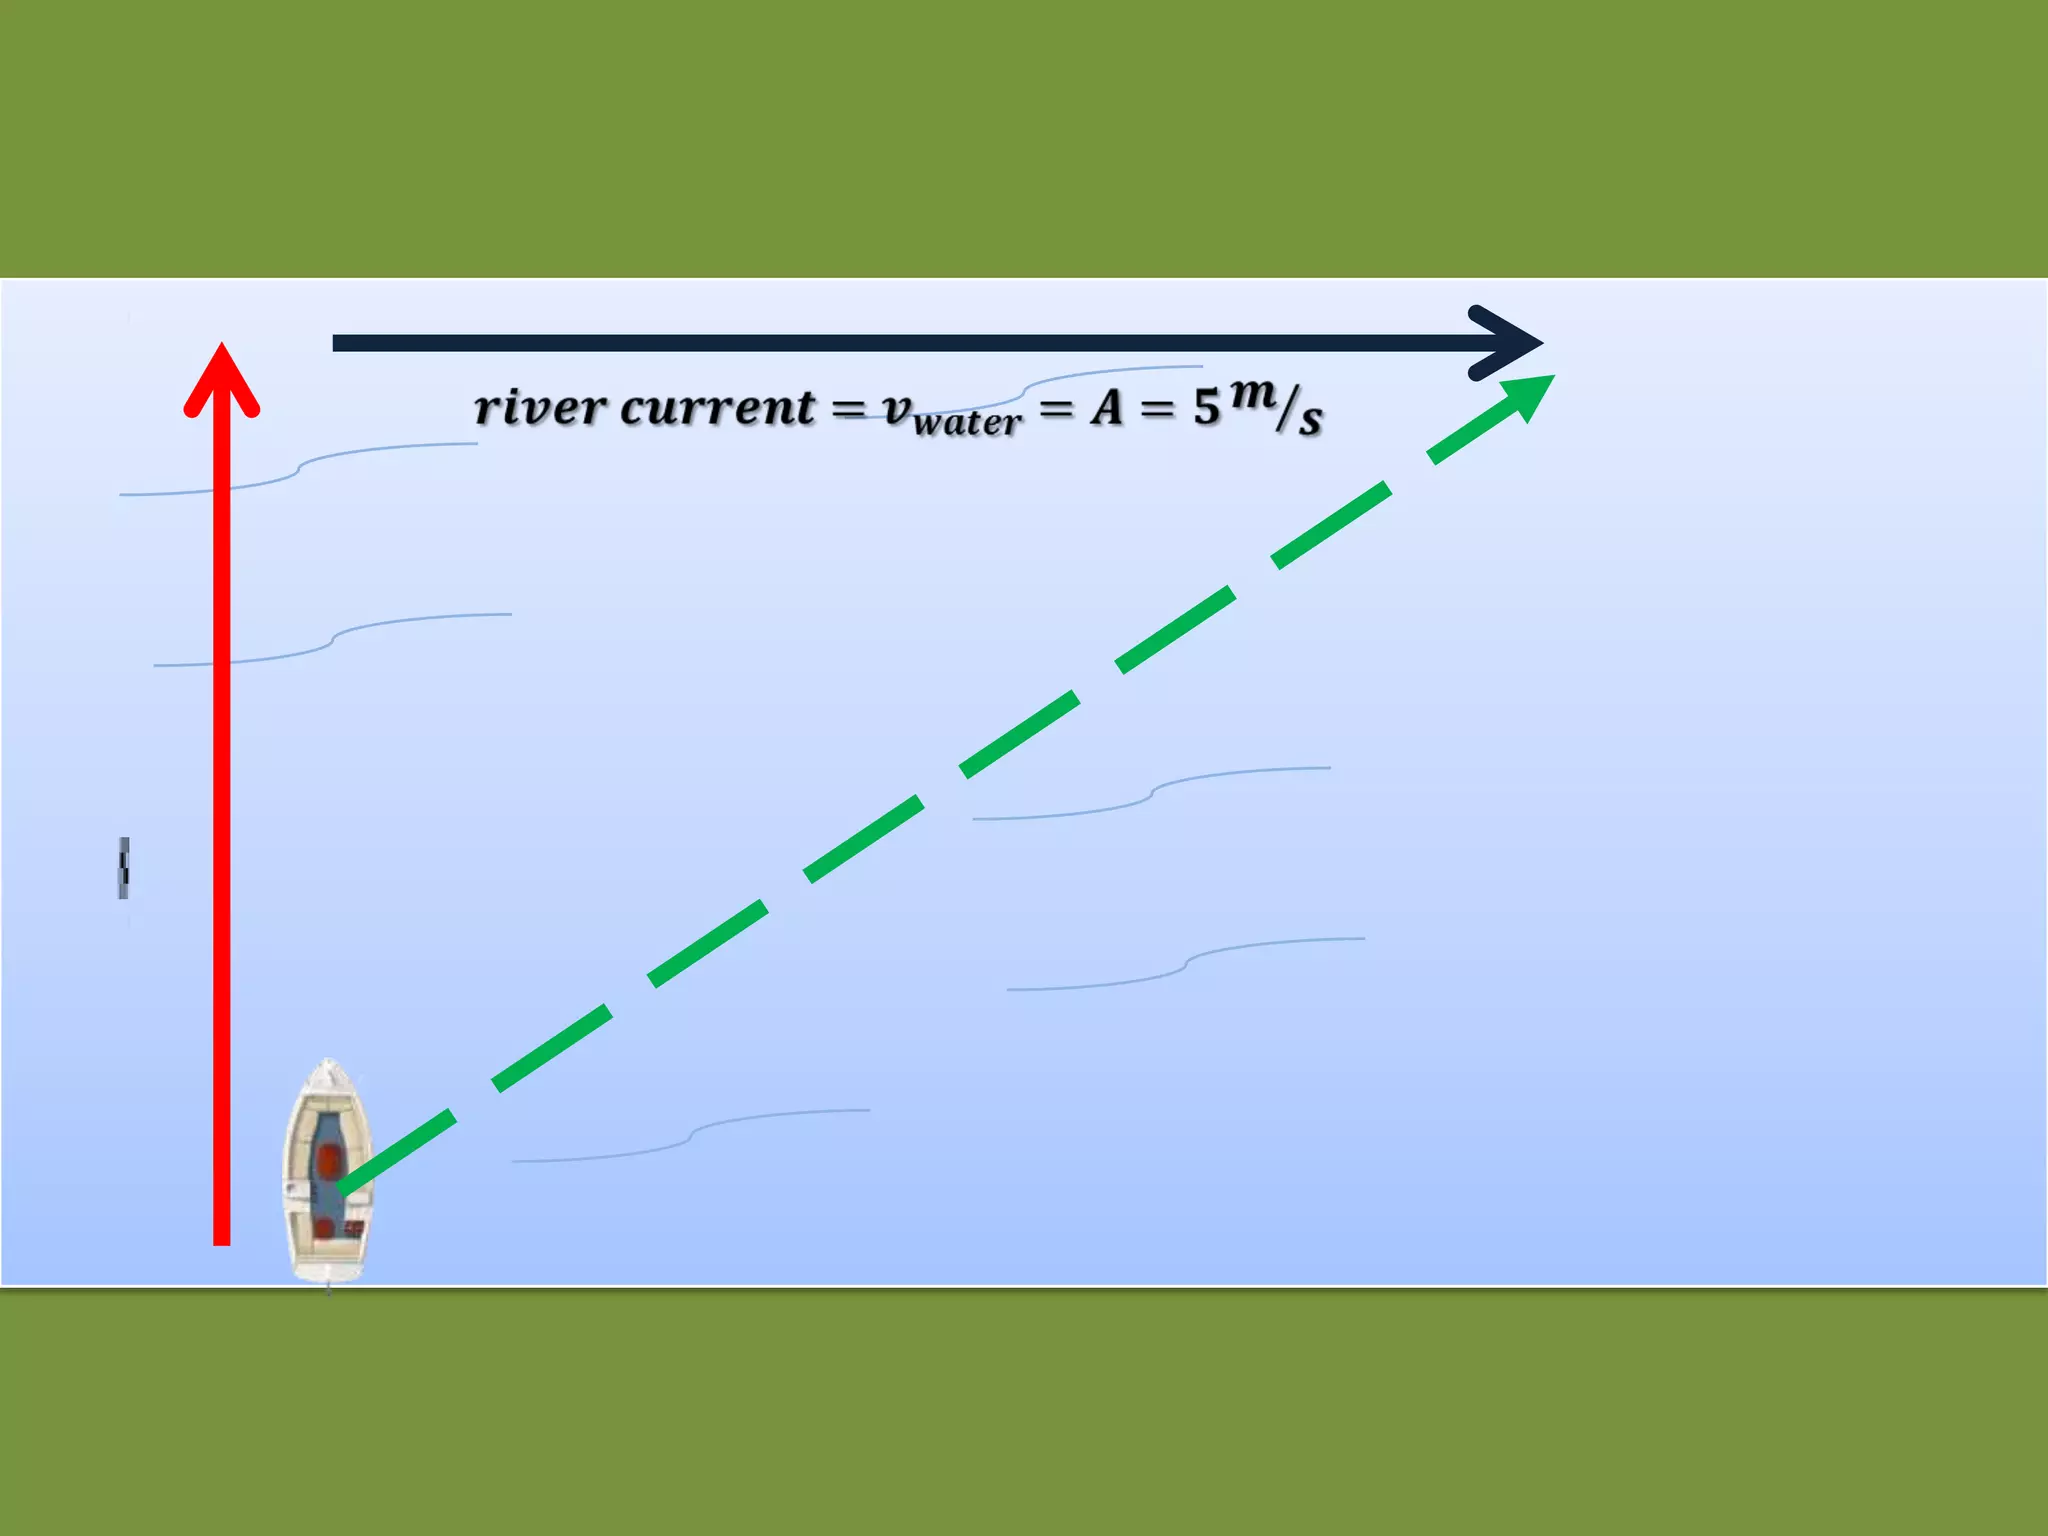
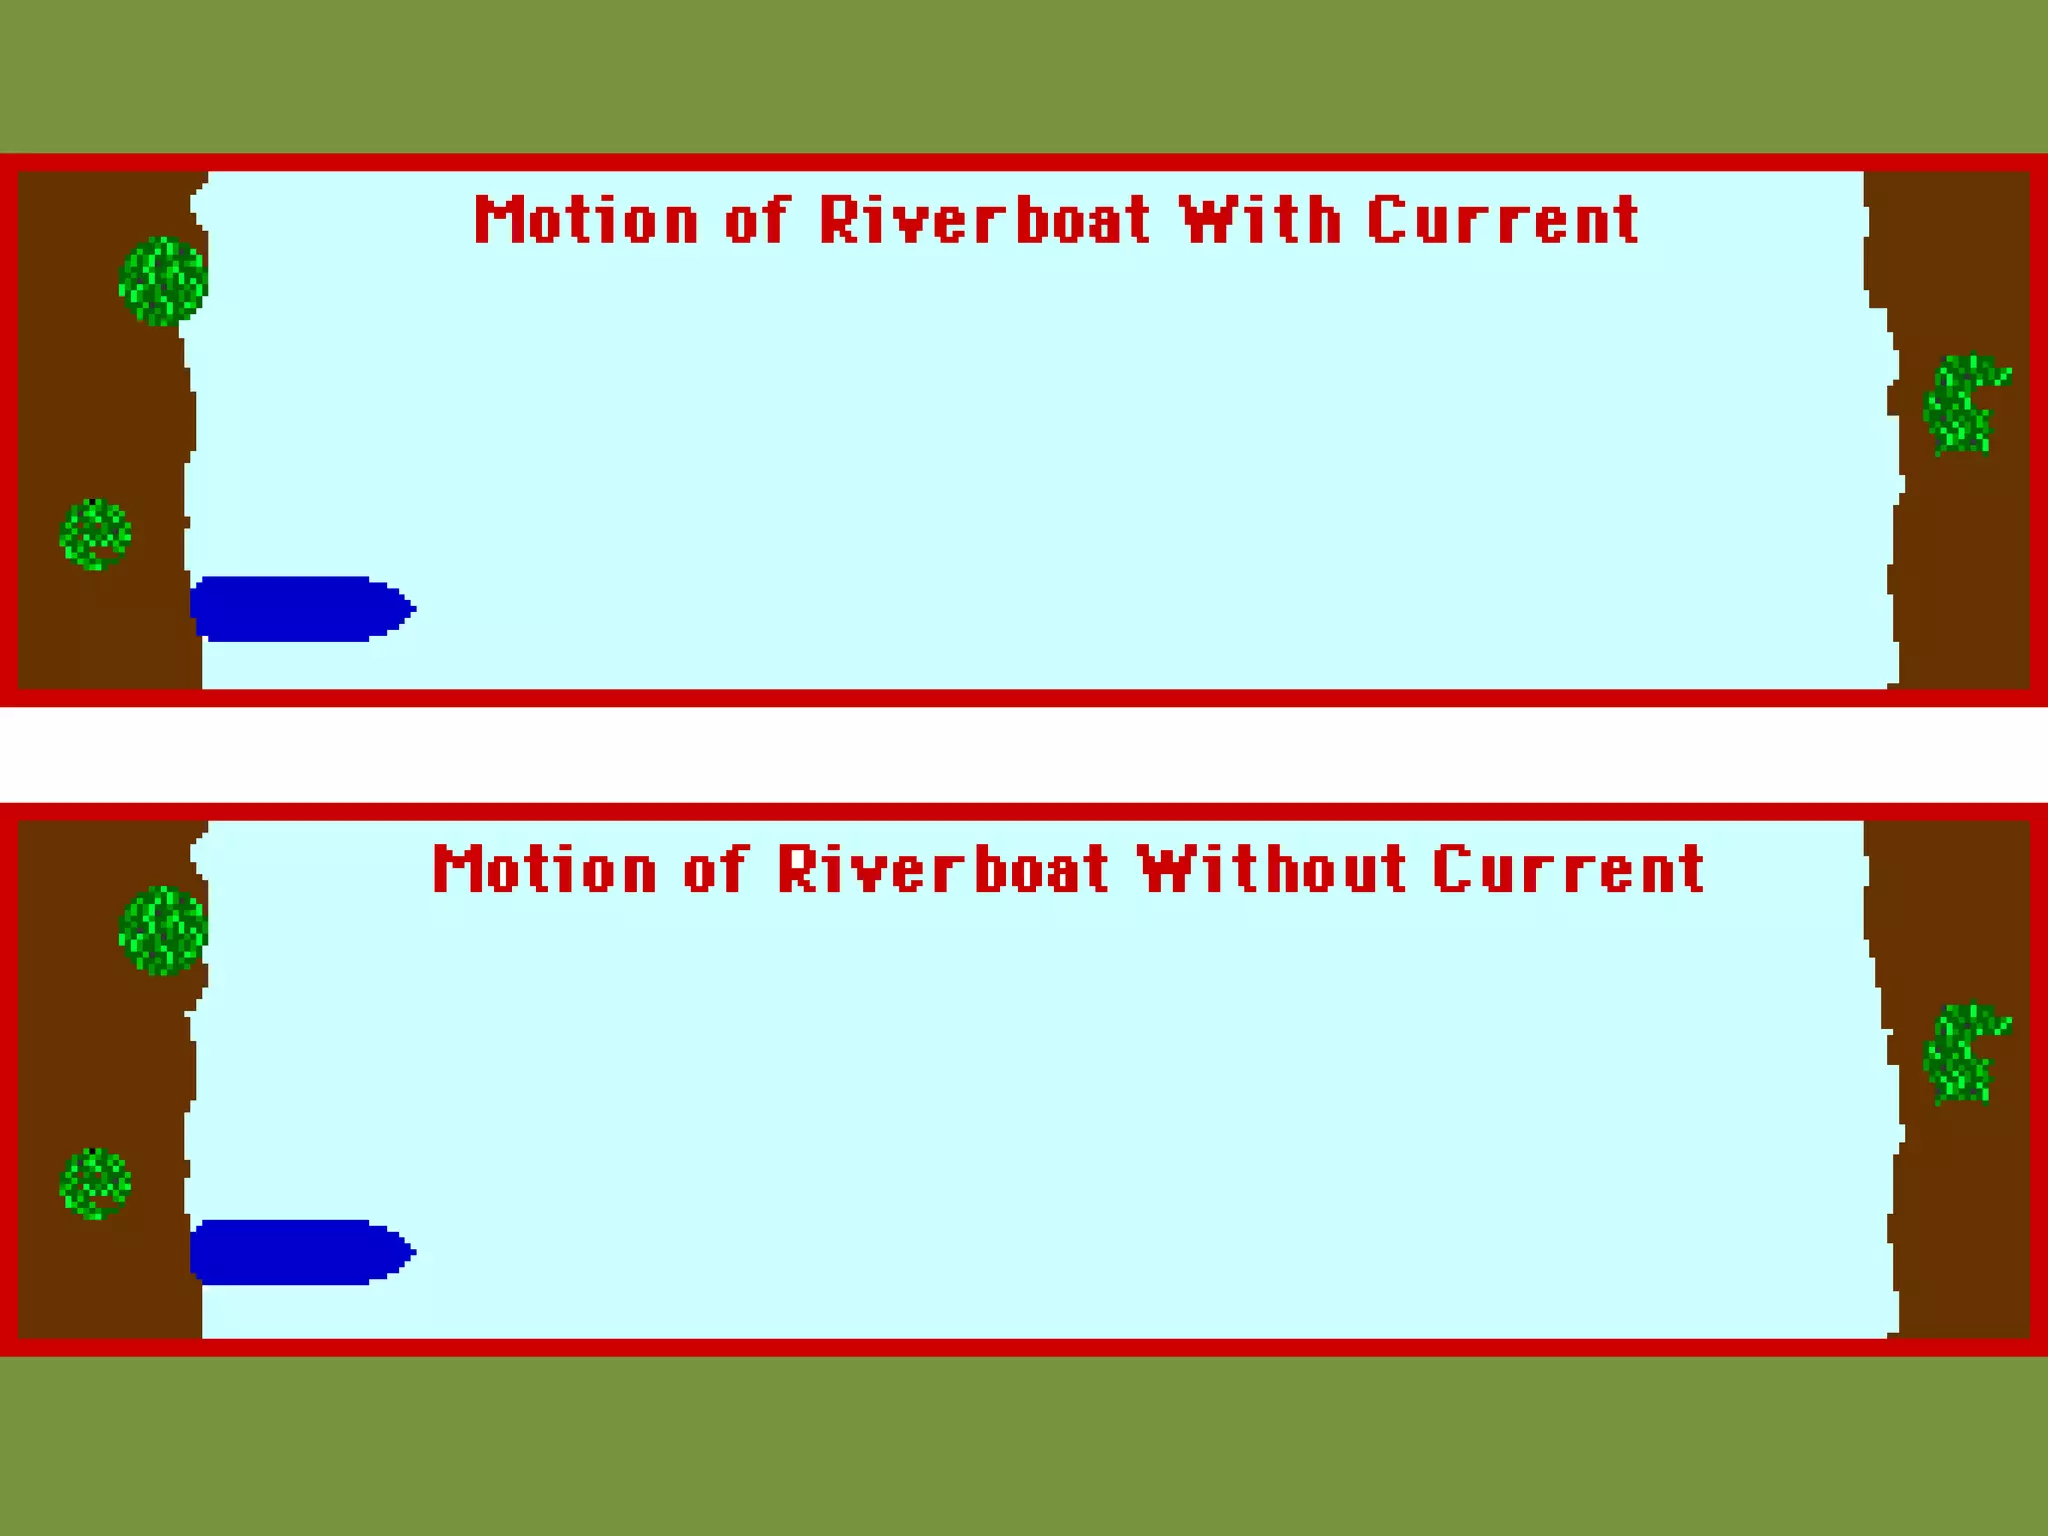
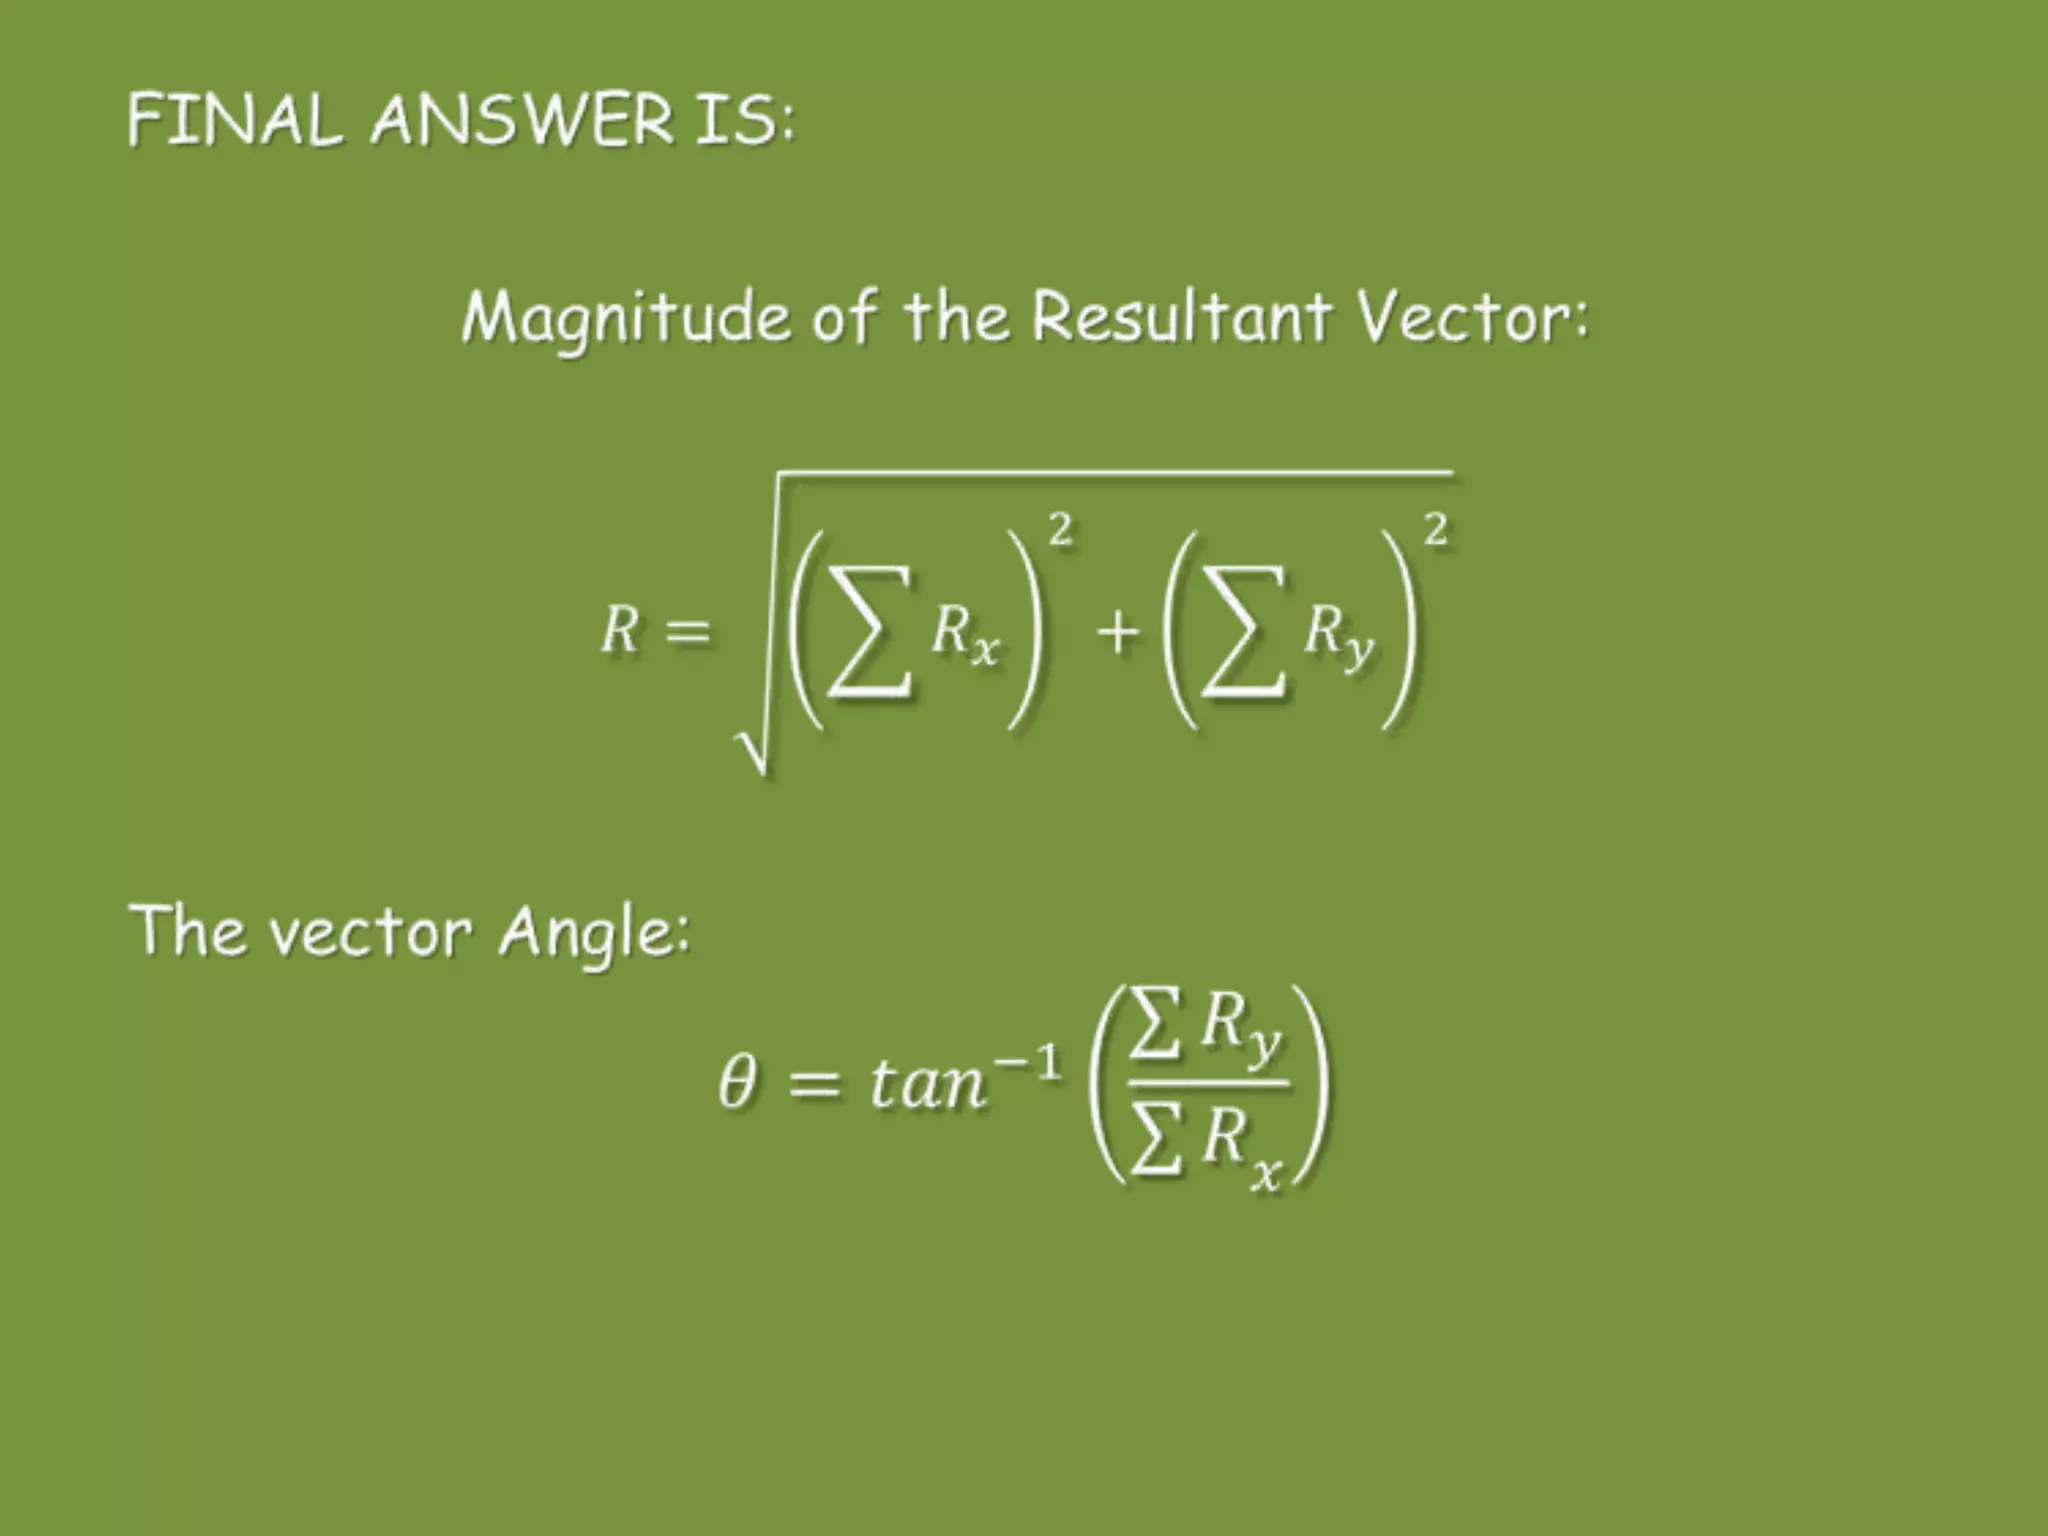
Definition of resultant vector, methods to calculate its magnitude and angle.
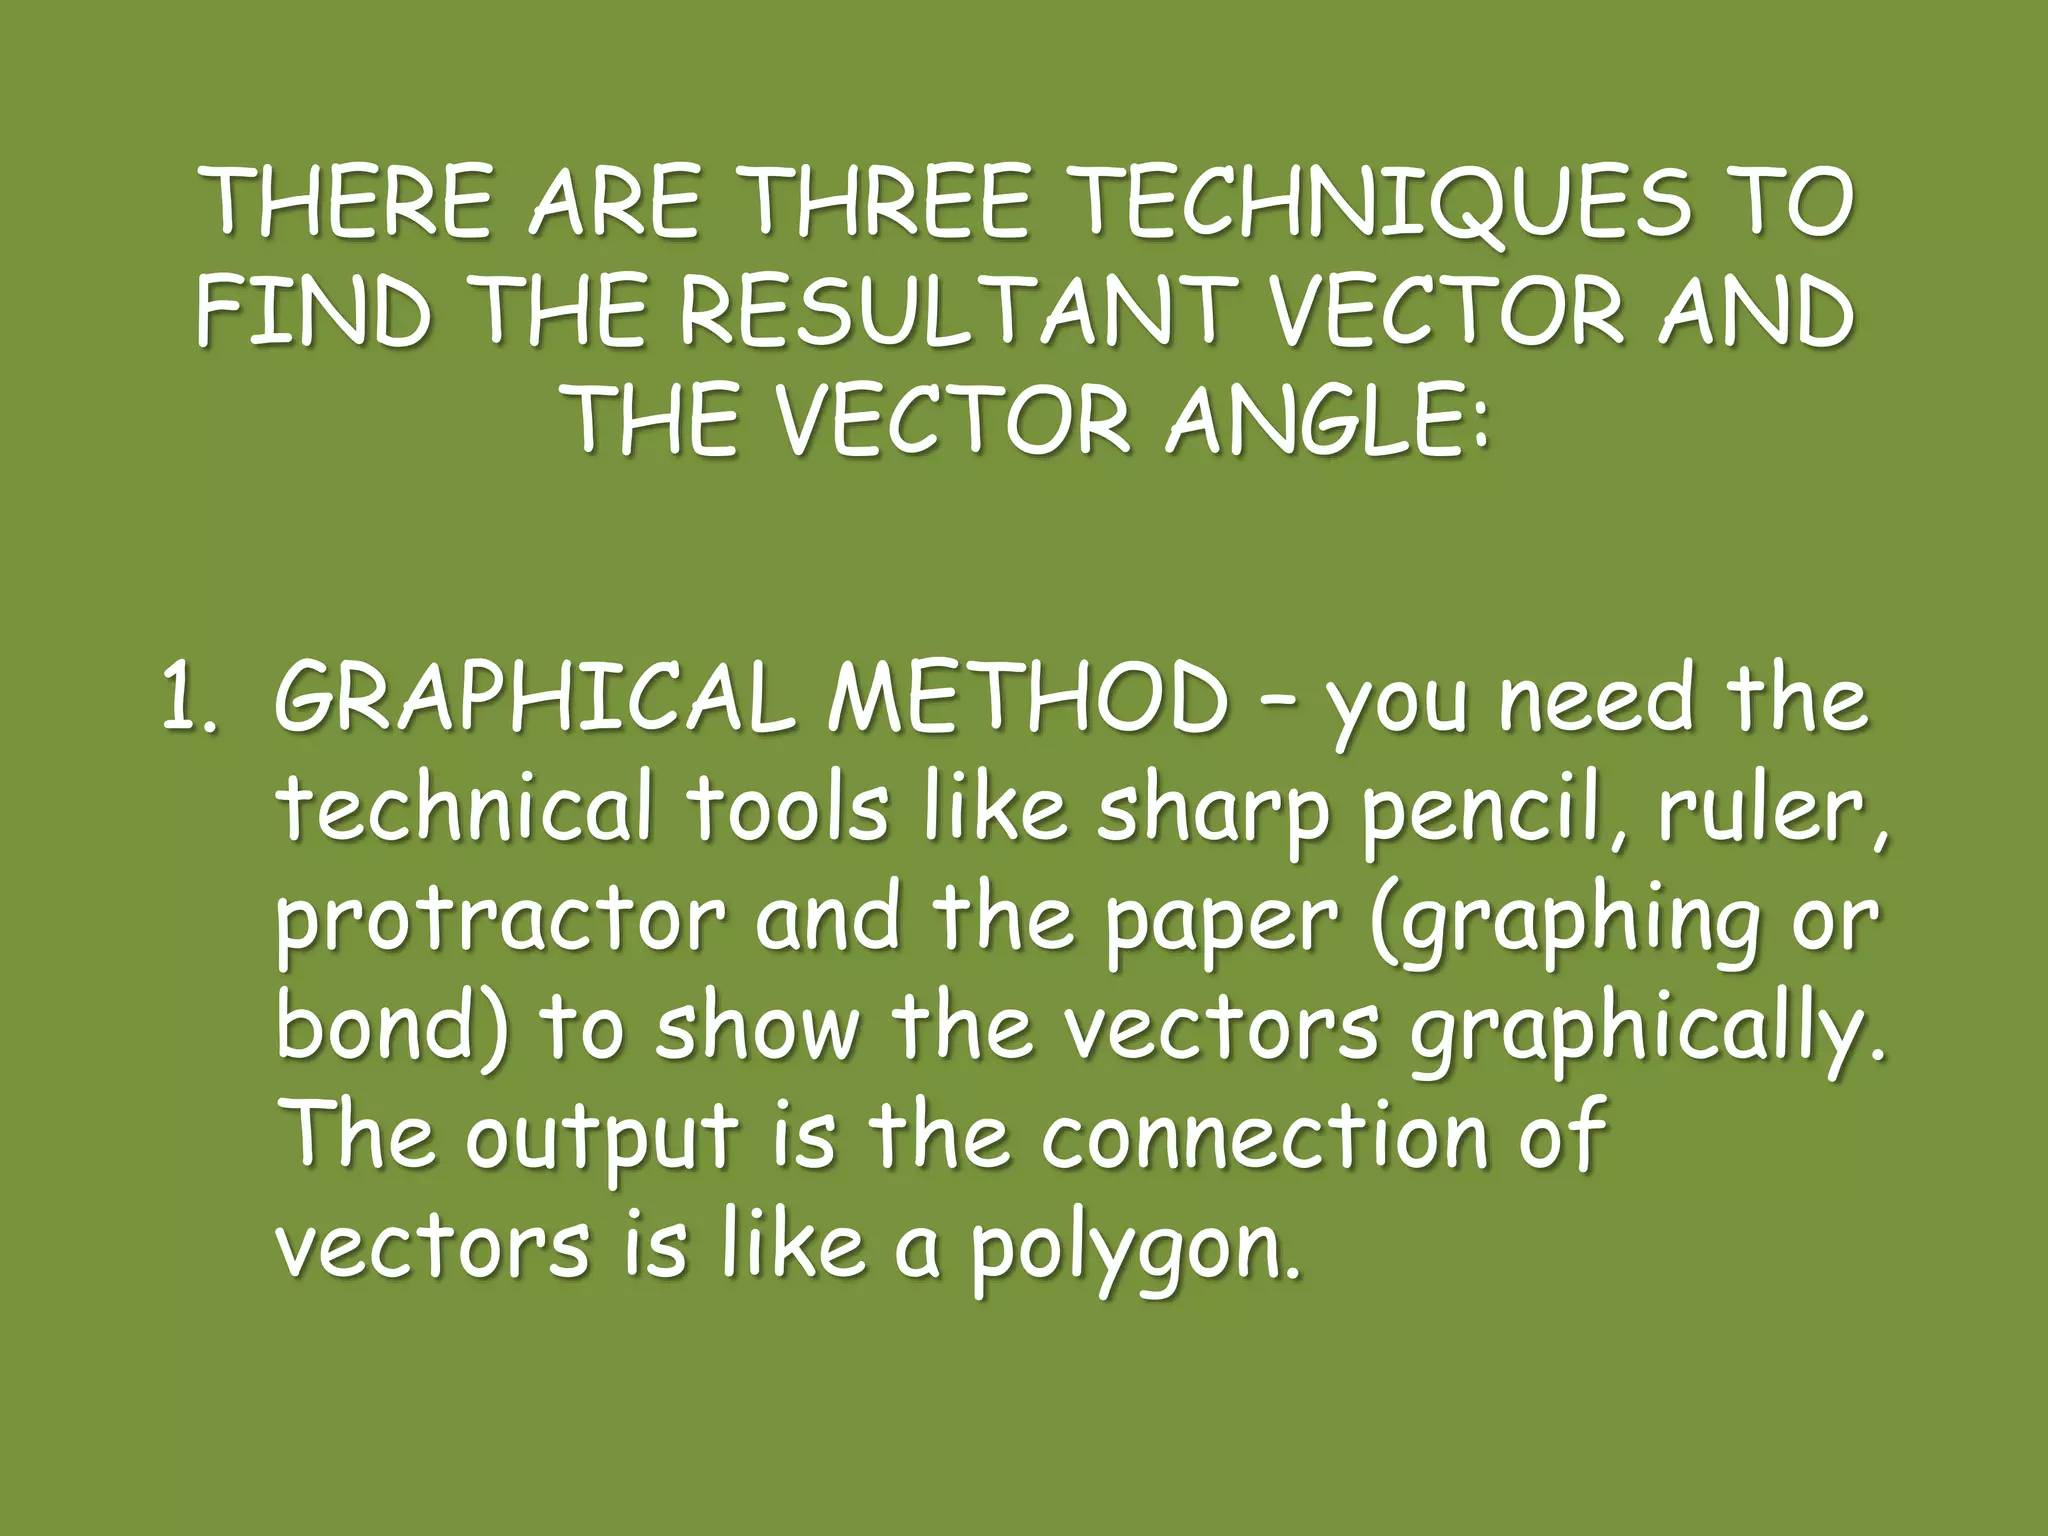
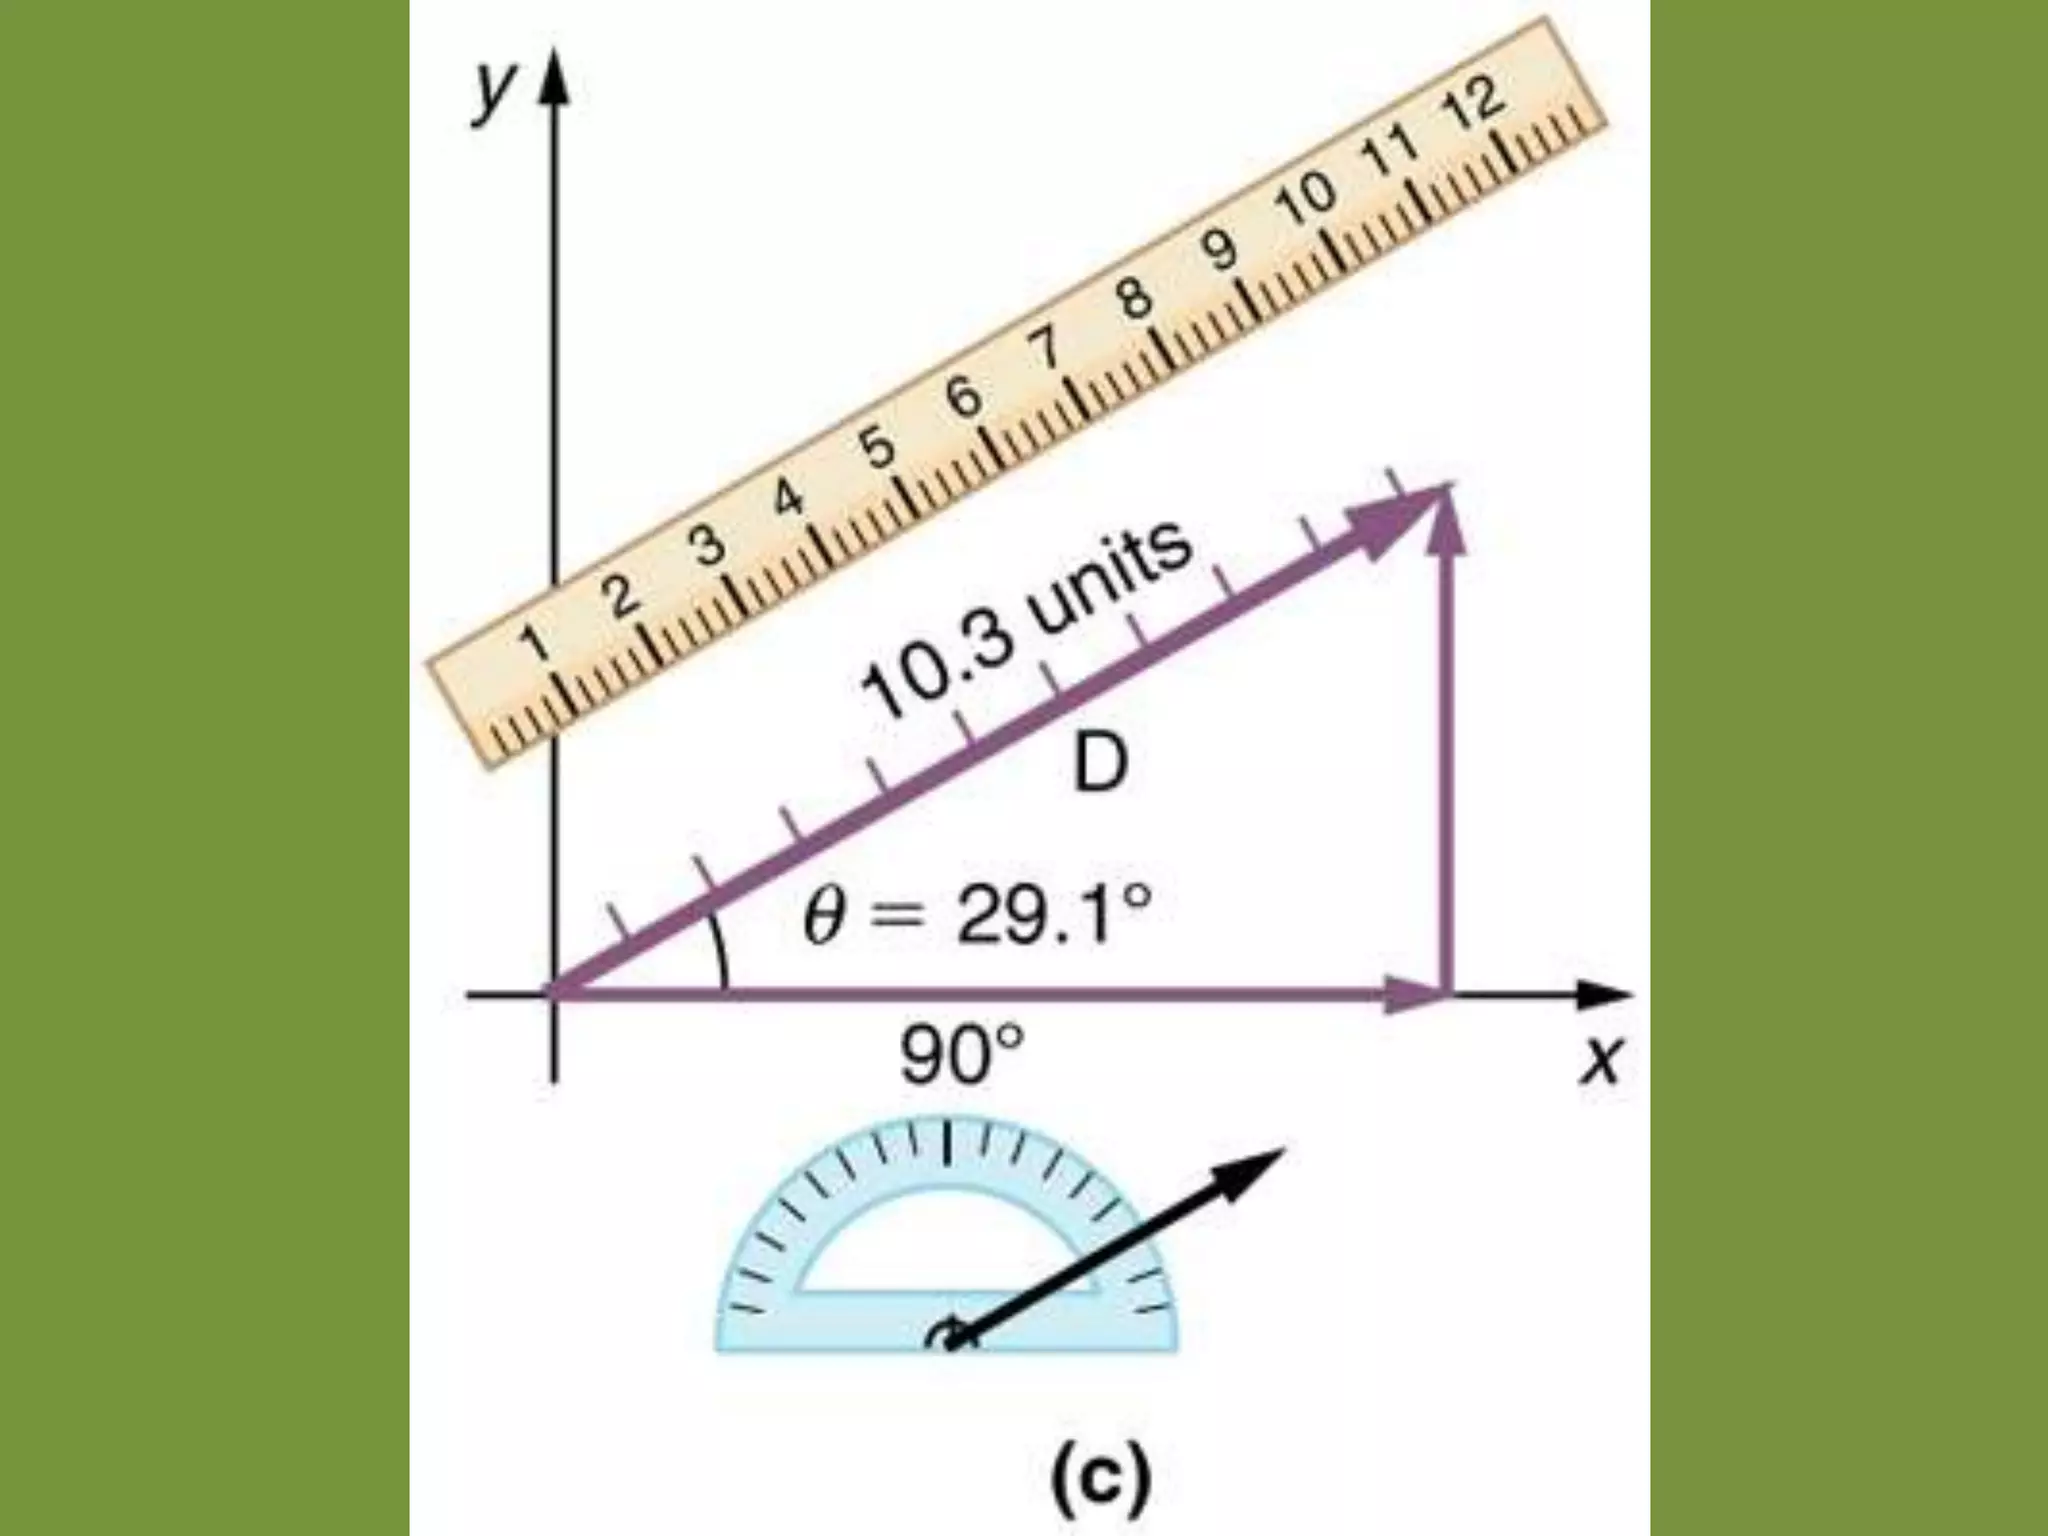
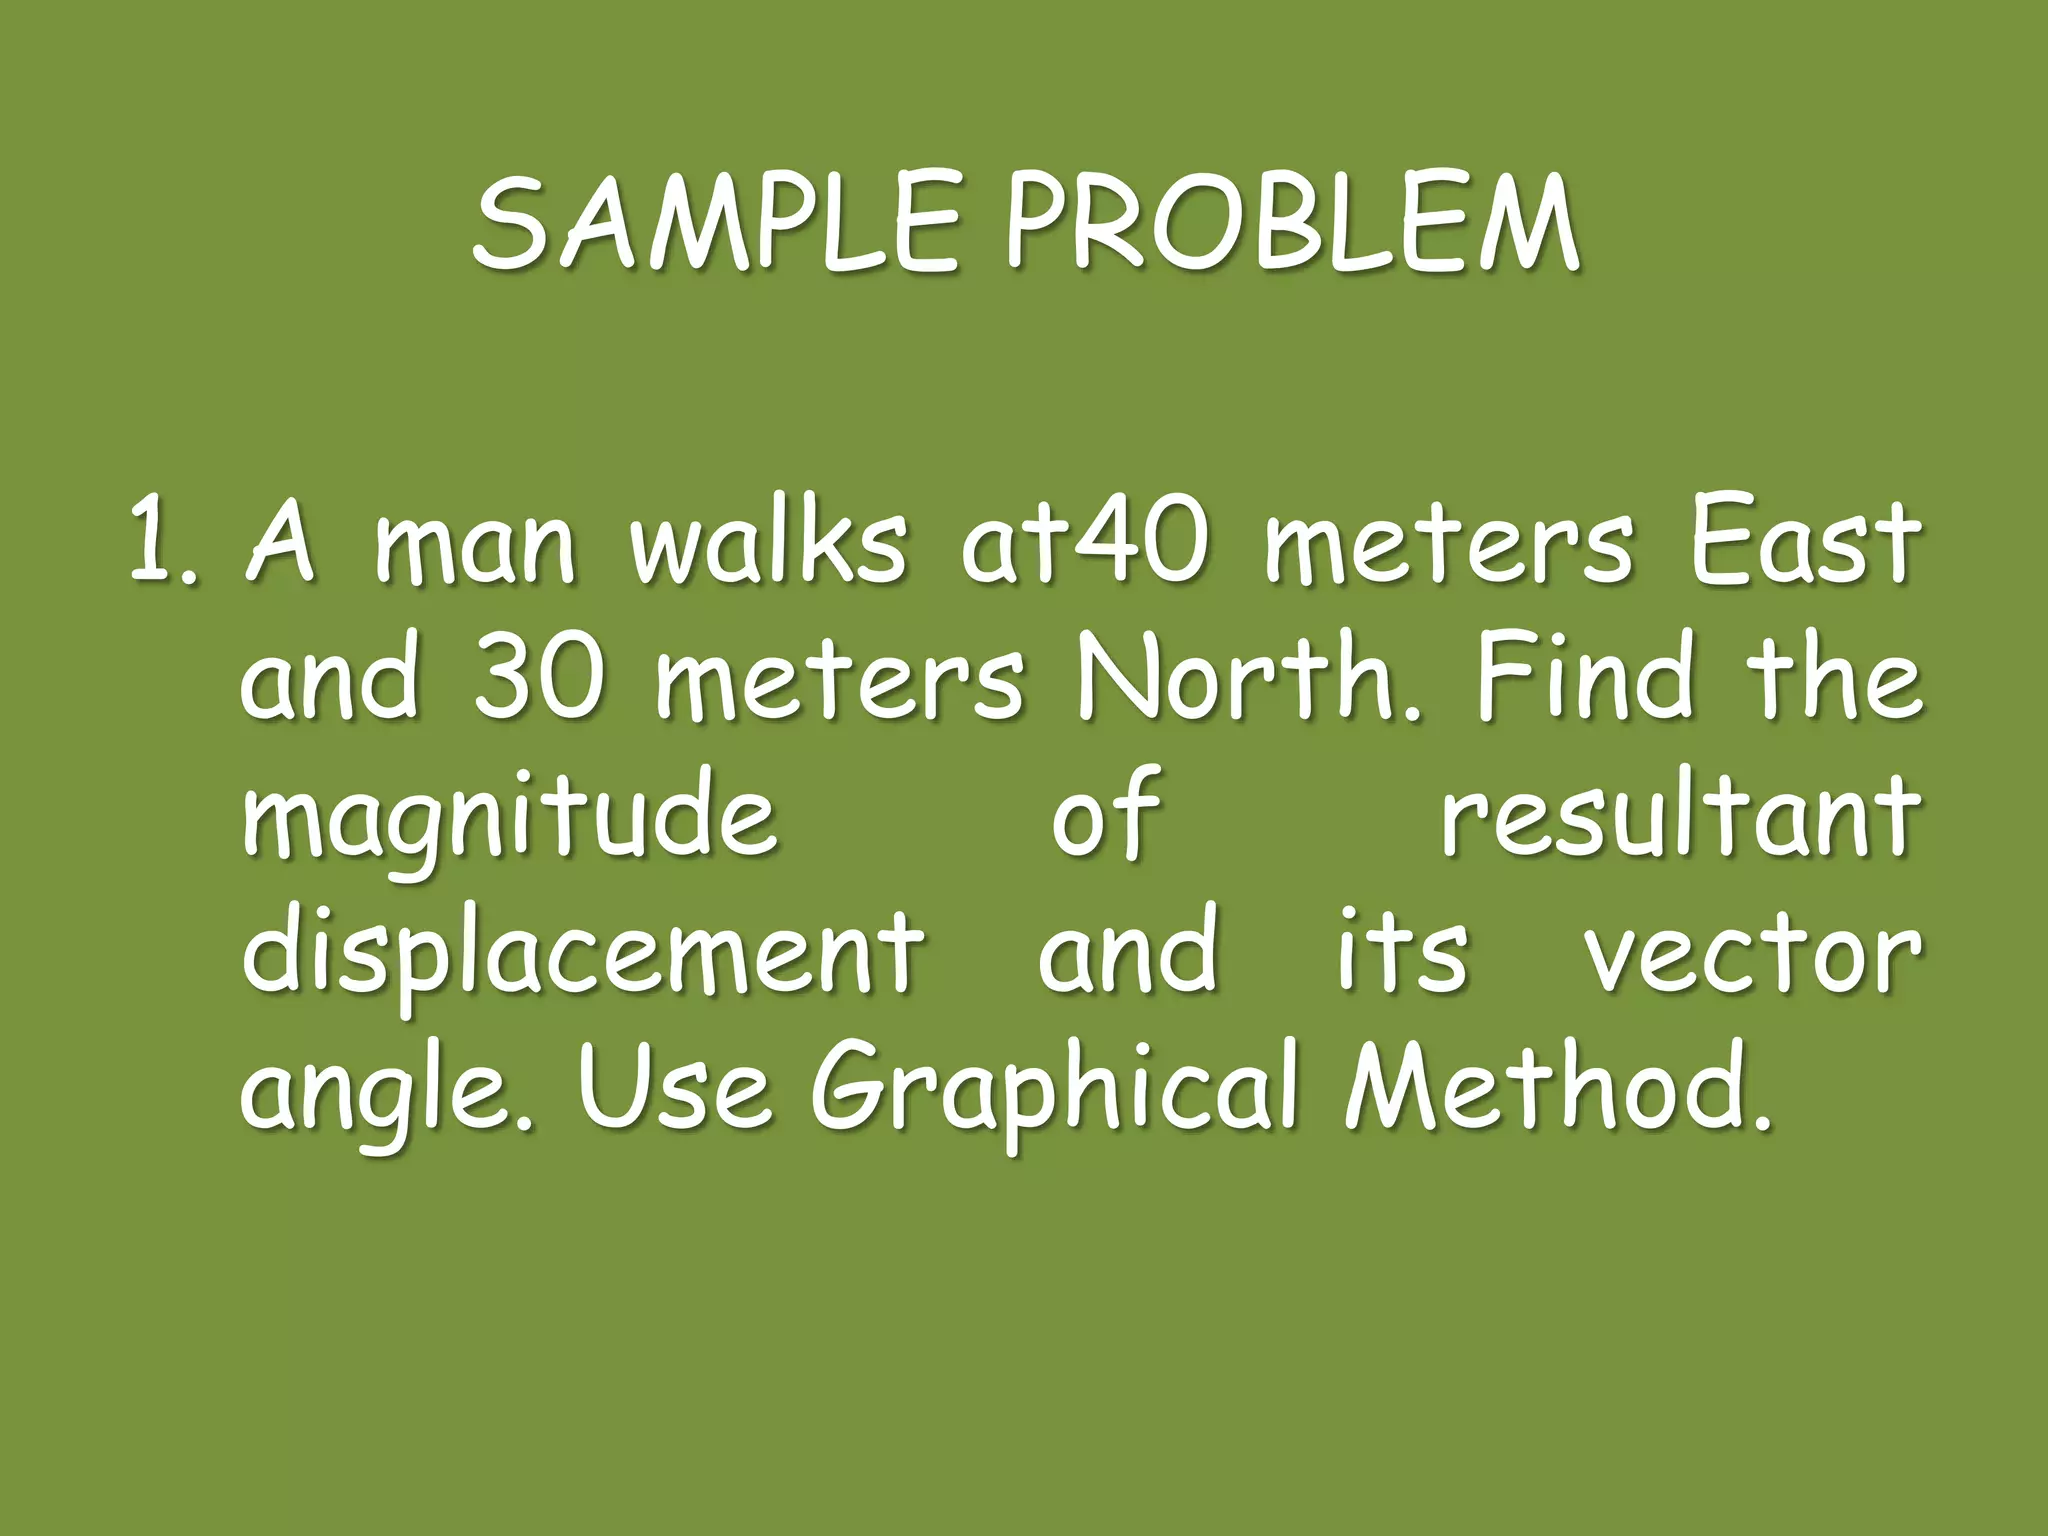
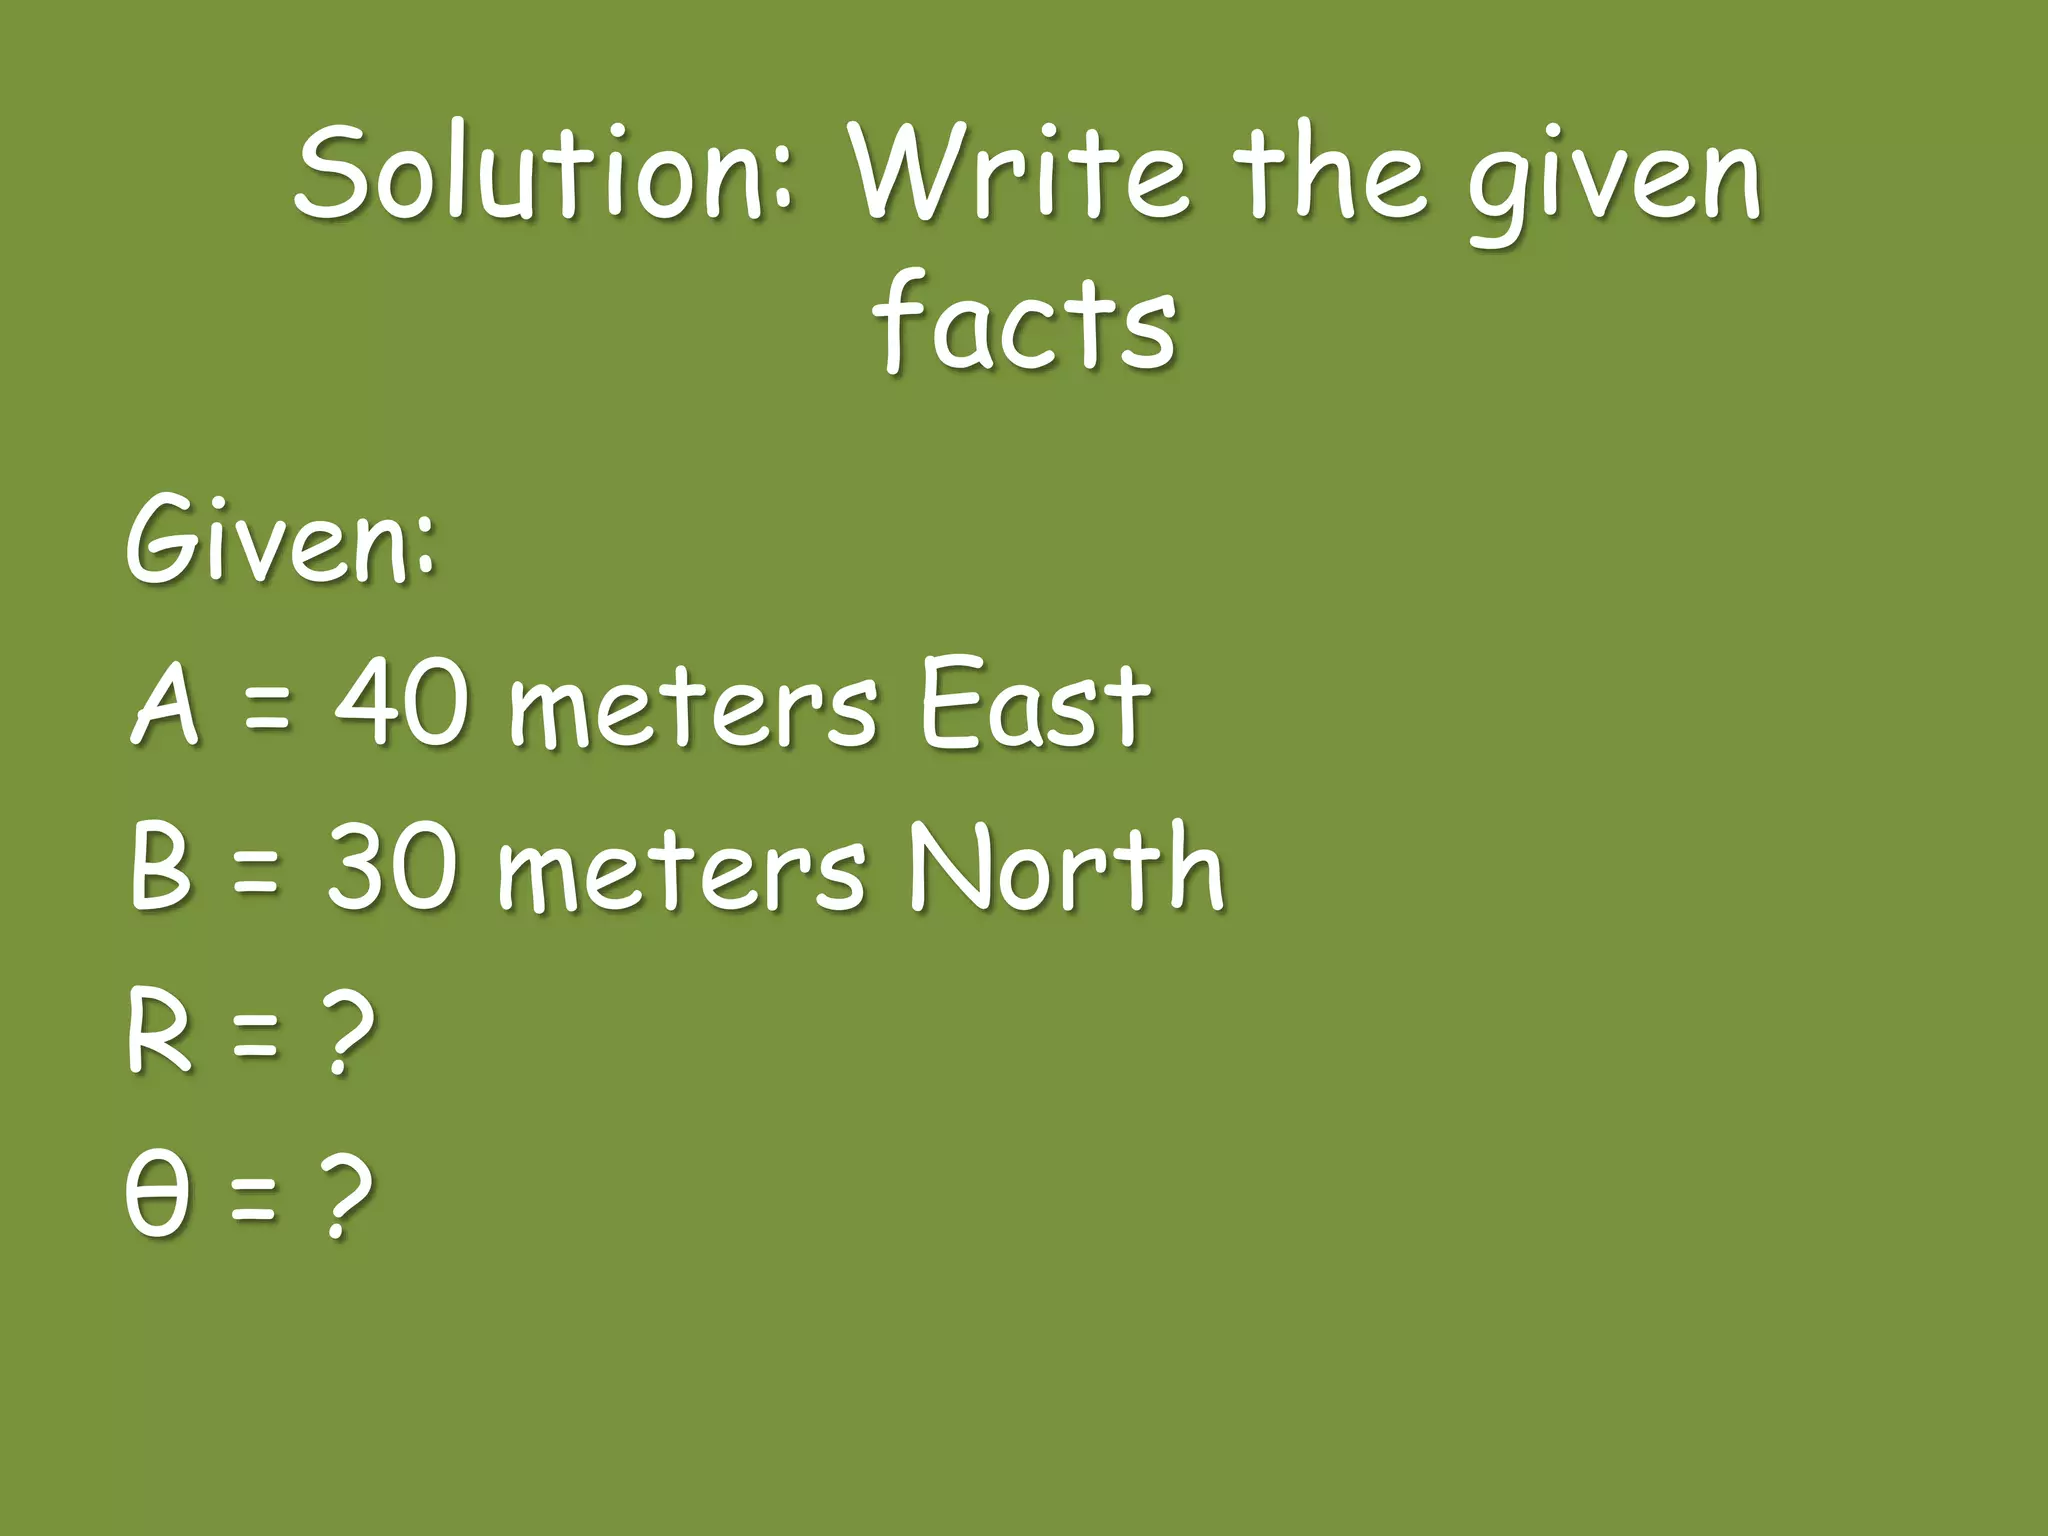
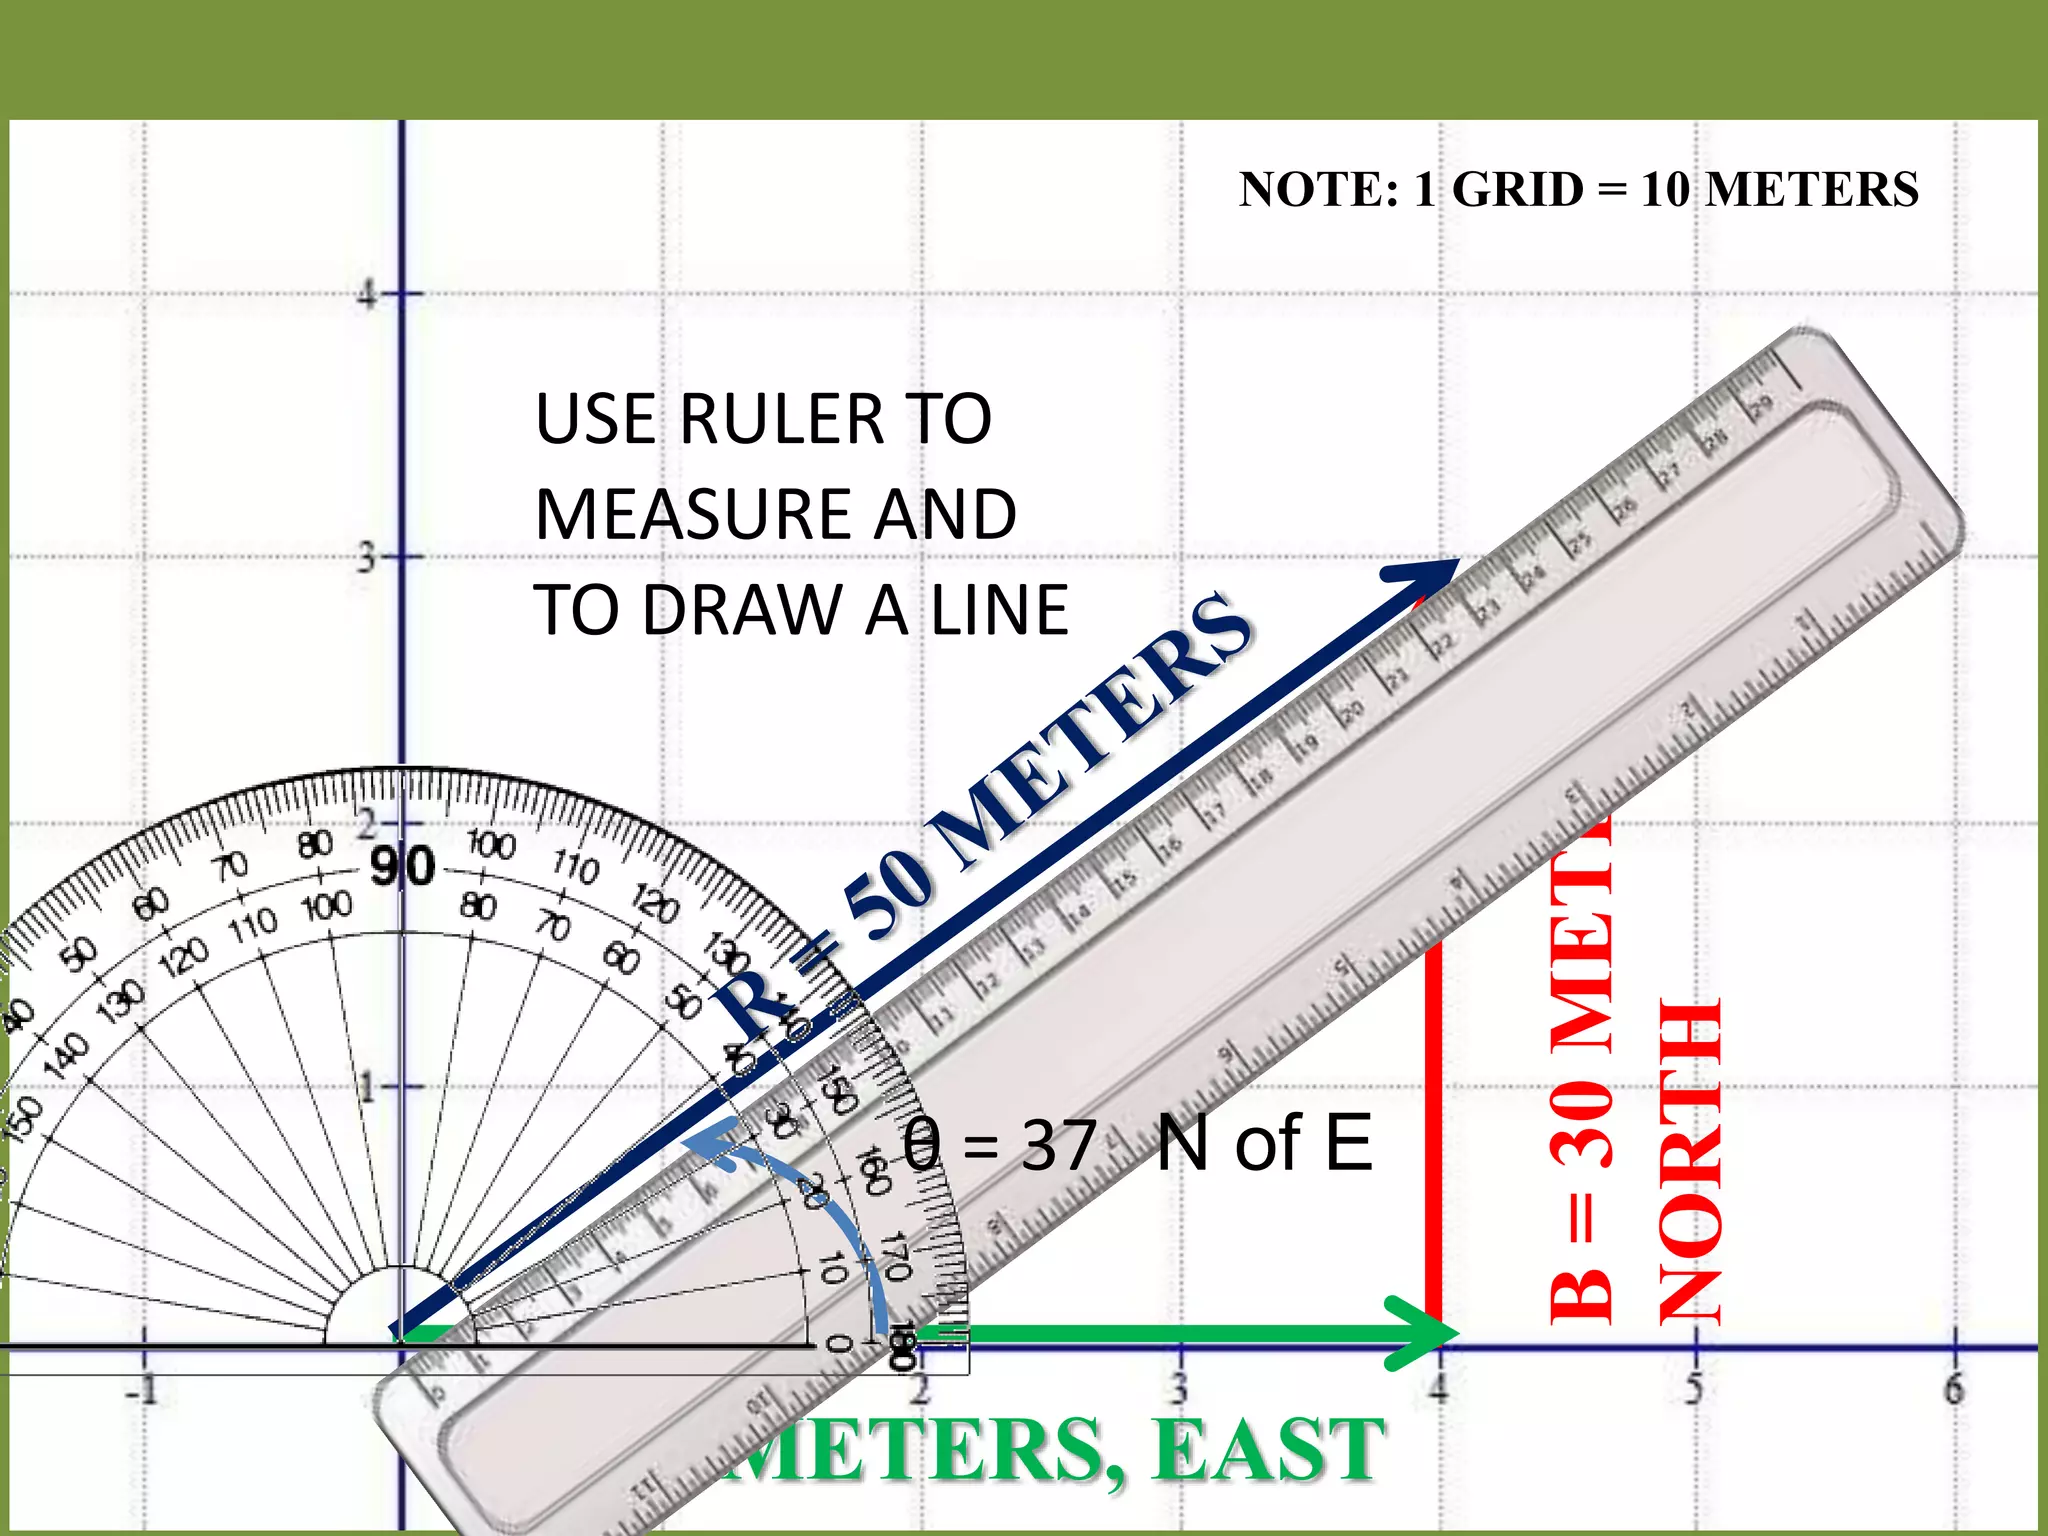
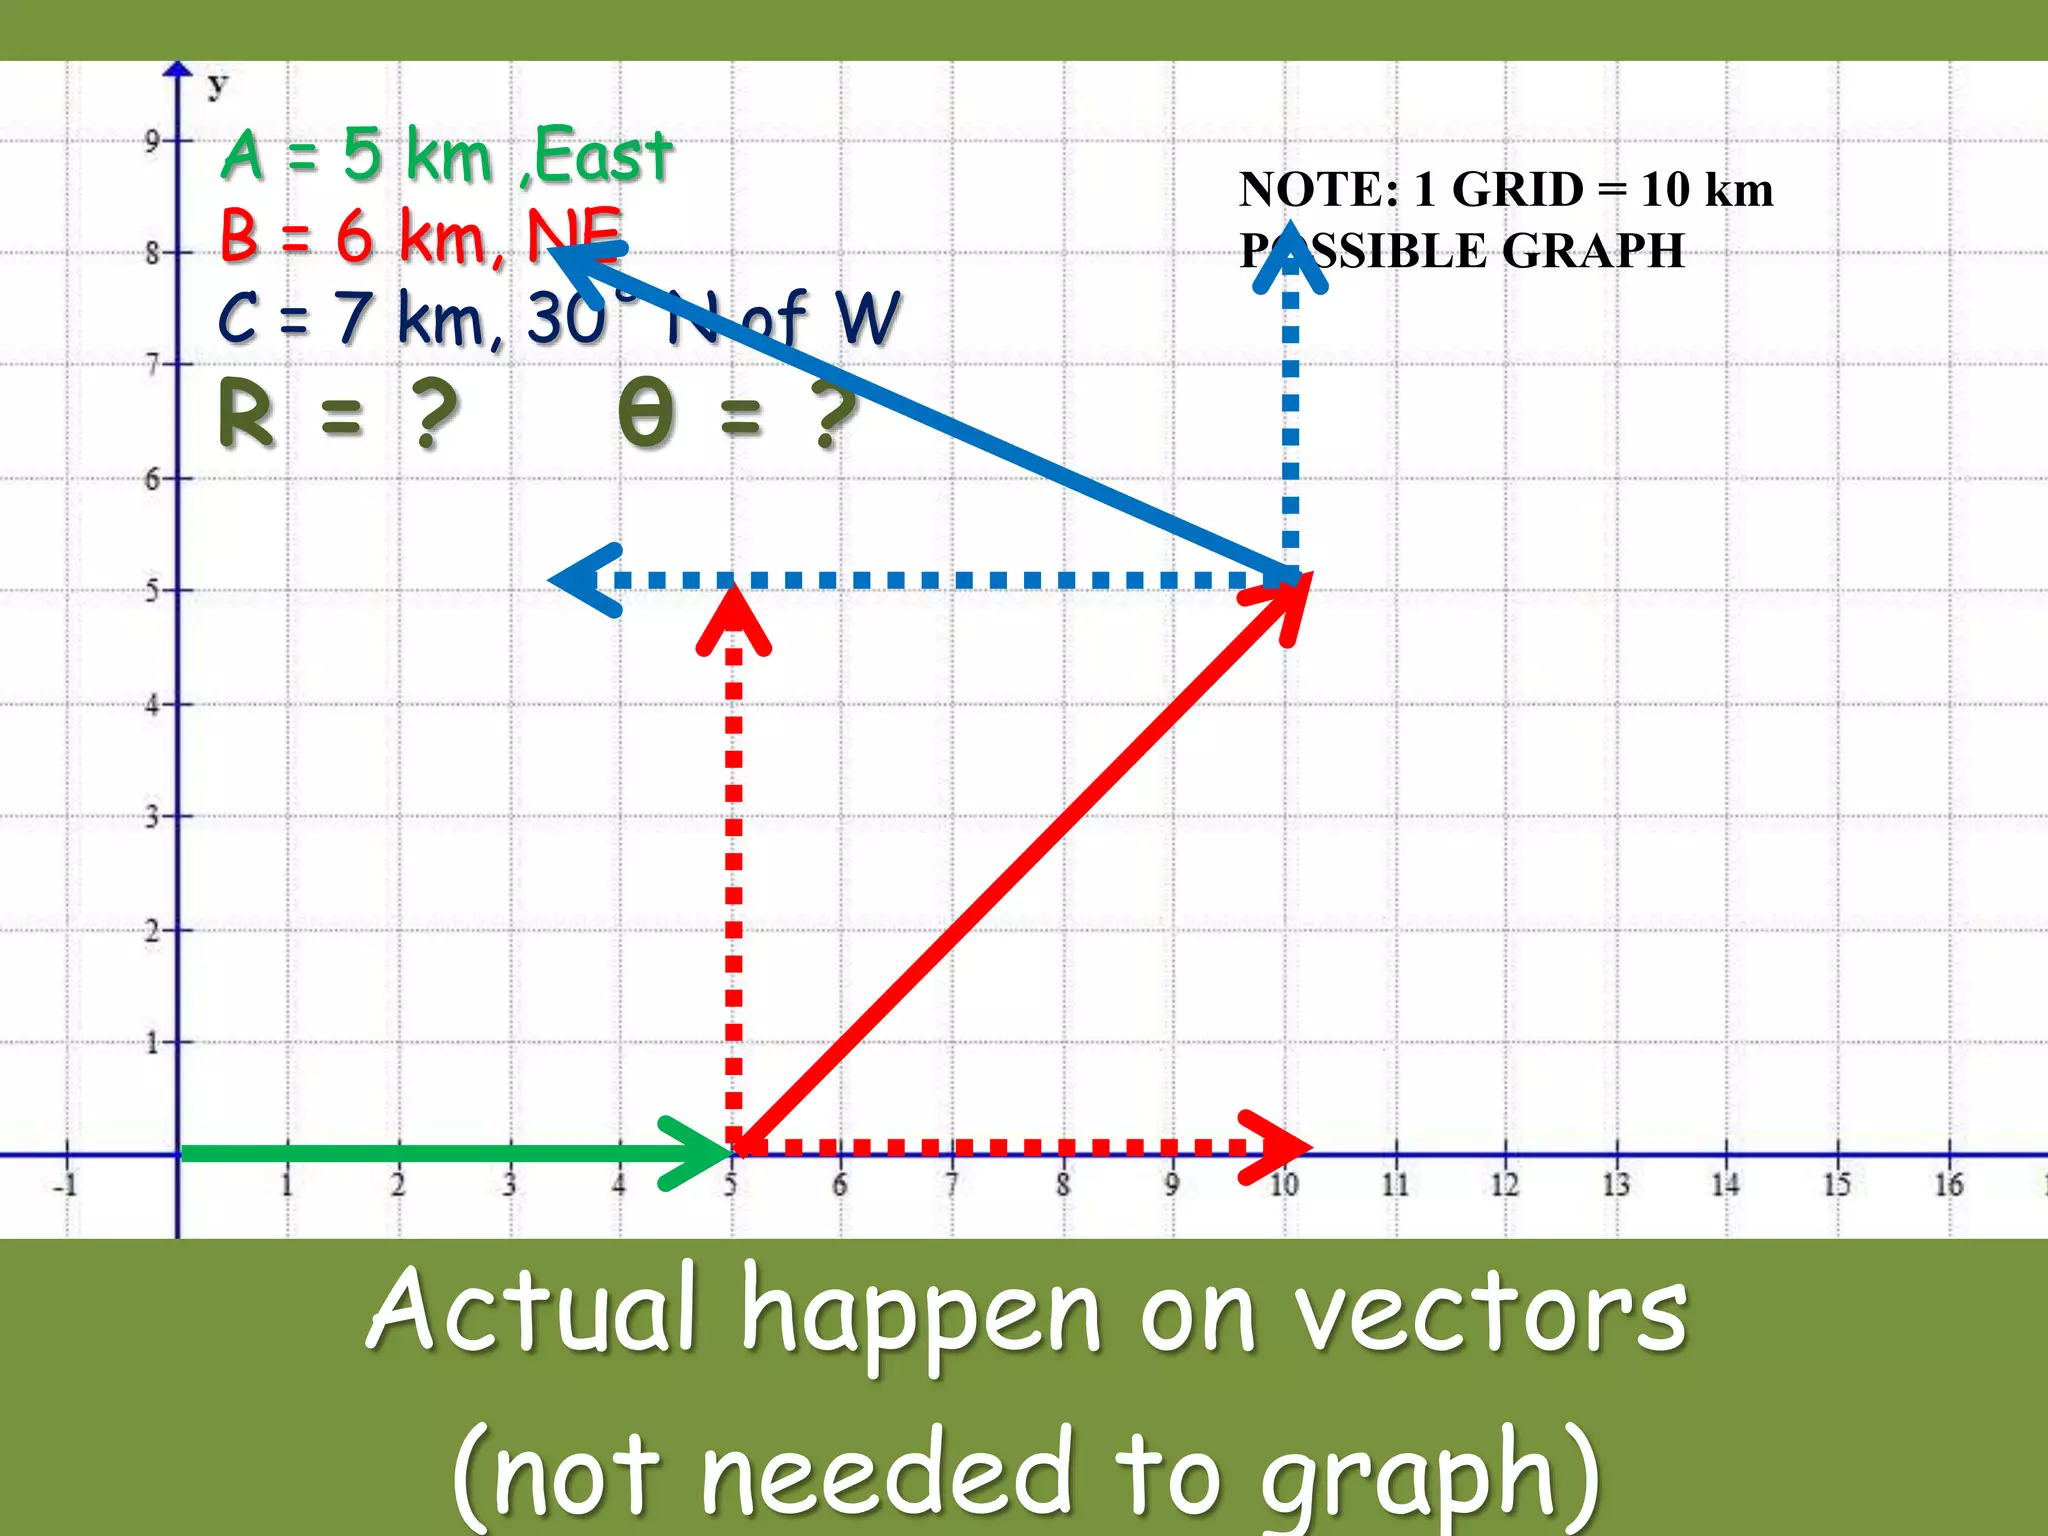
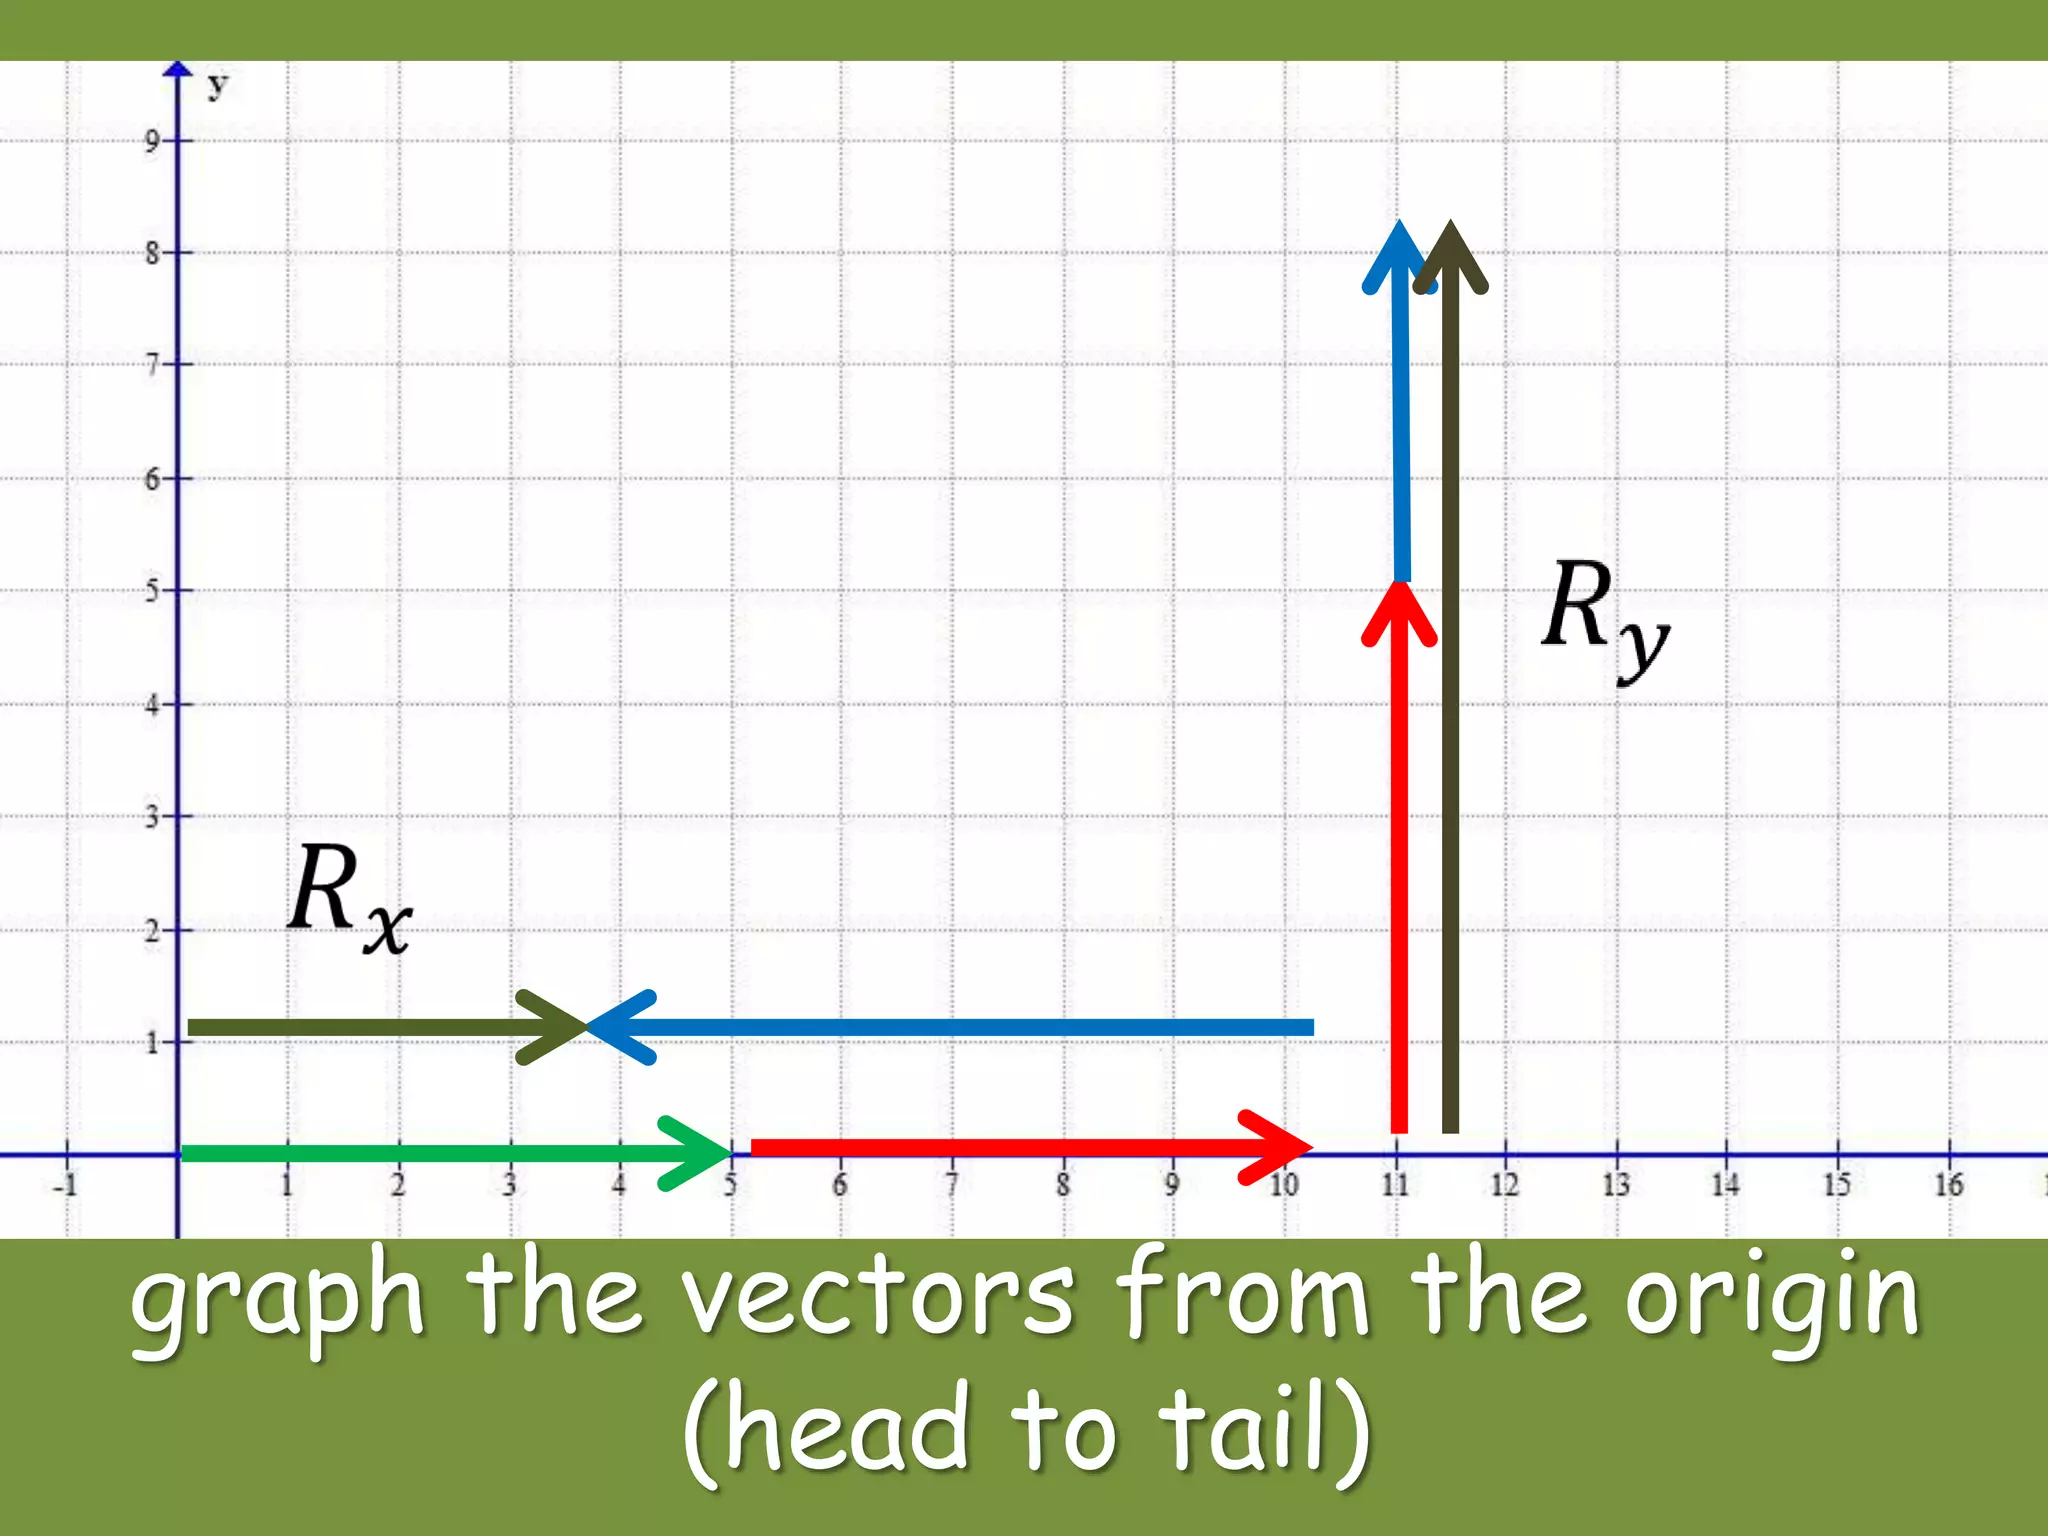
Steps using graphical method to determine the resultant vector and angle; includes example problem.
Steps using graphical method to determine the resultant vector and angle; includes example problem.
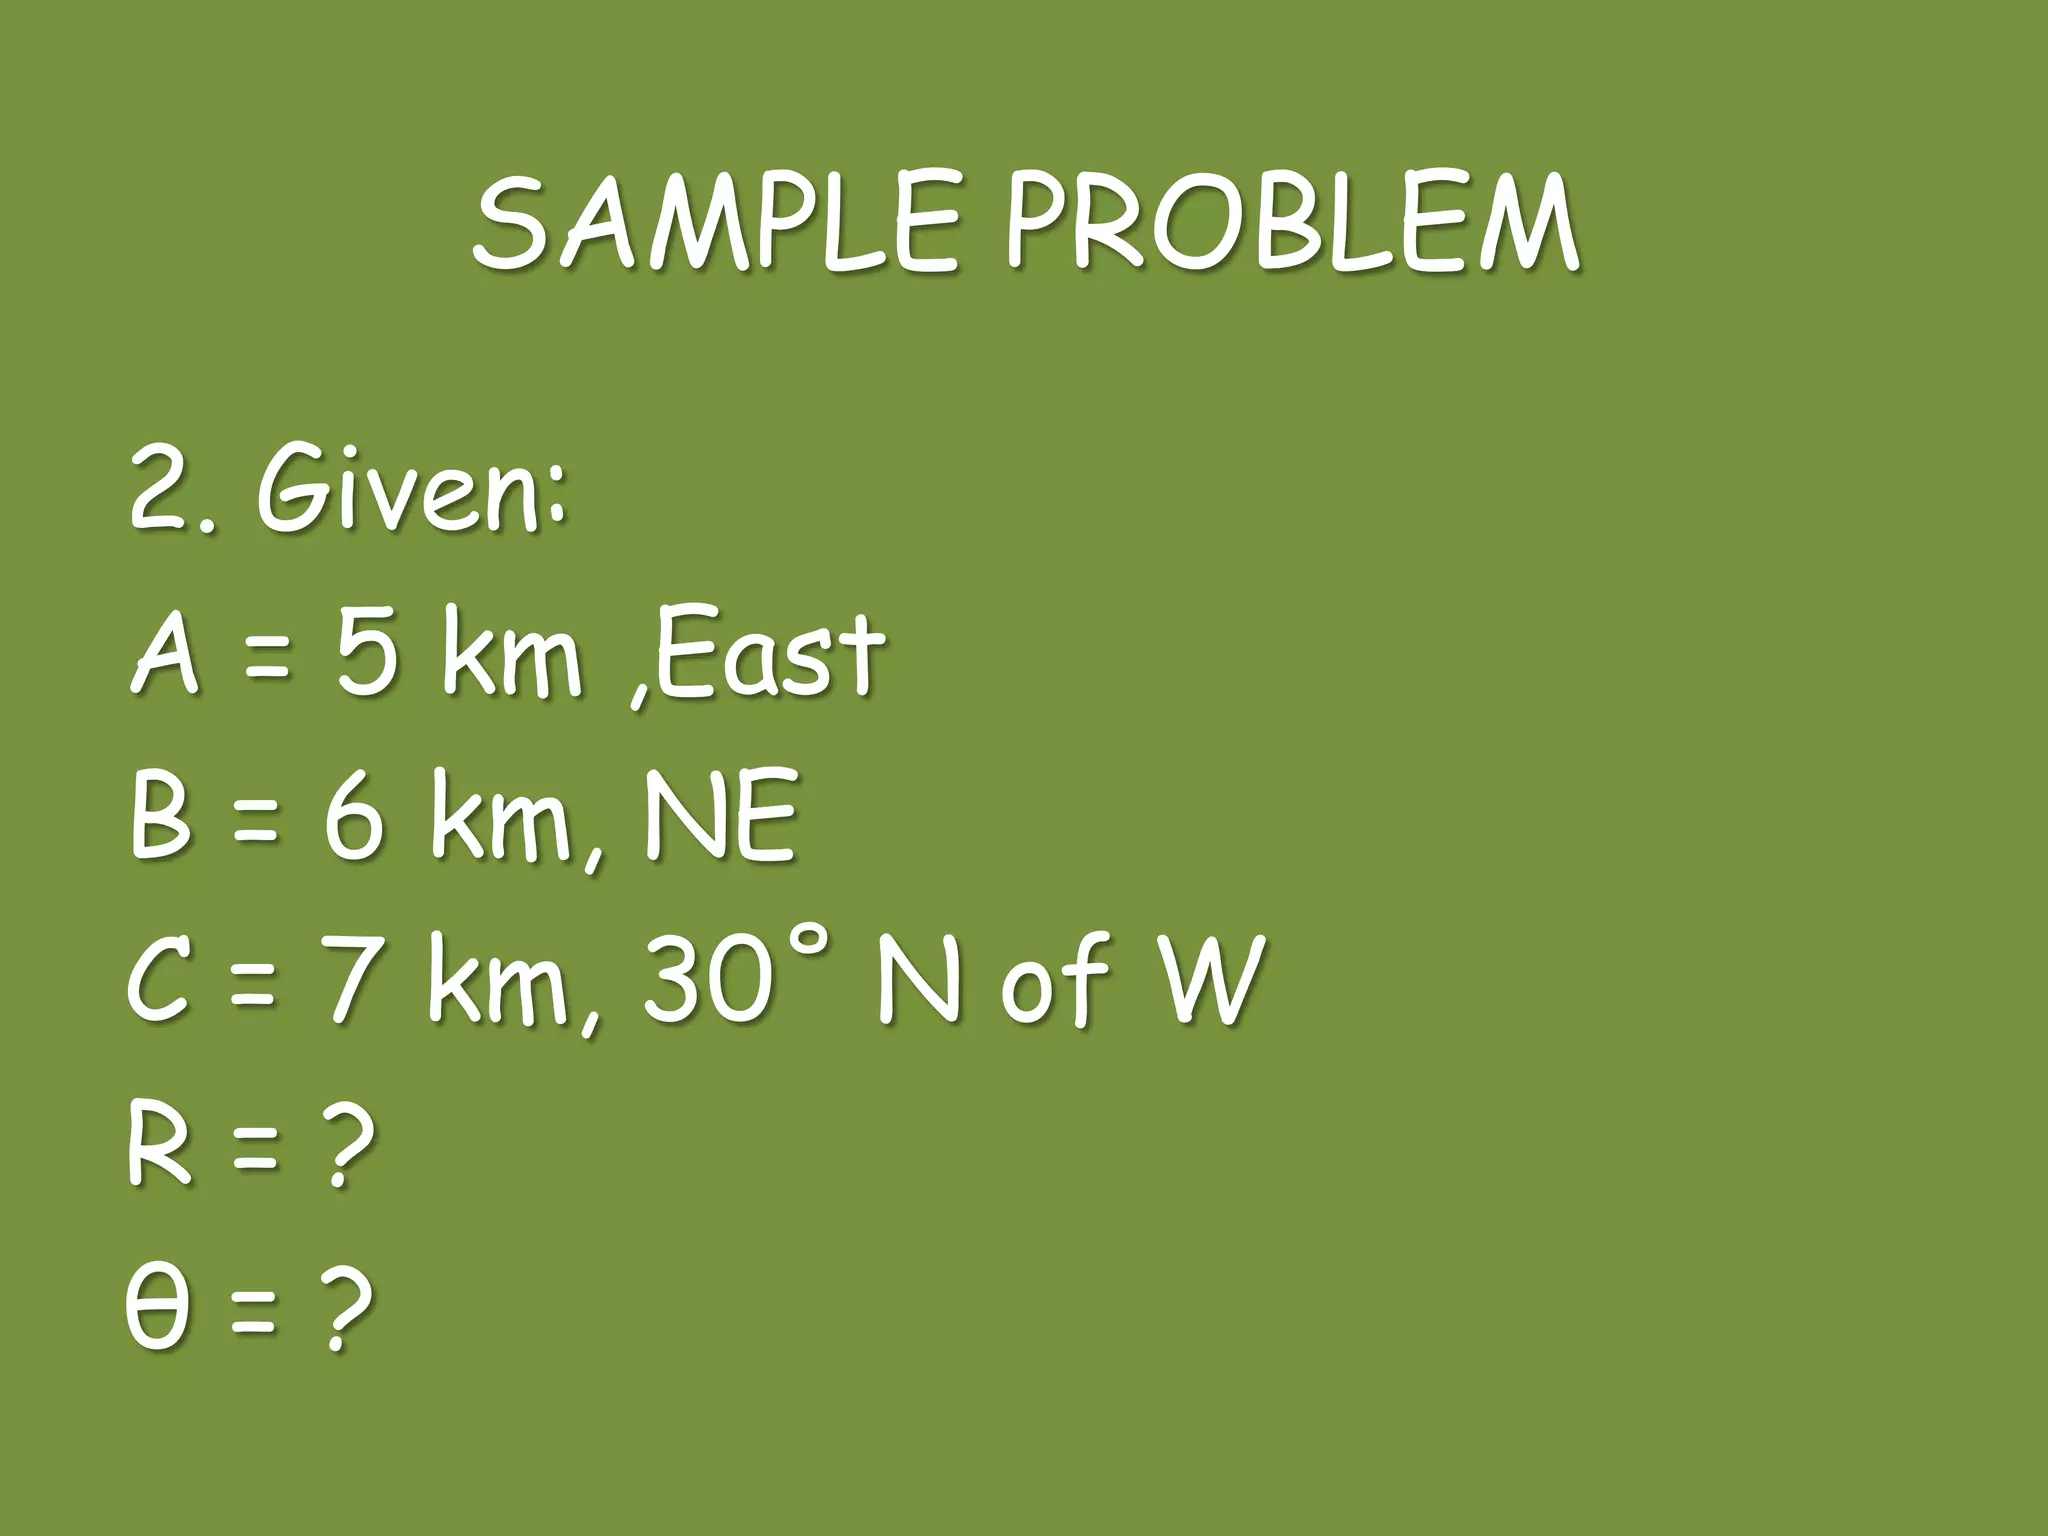
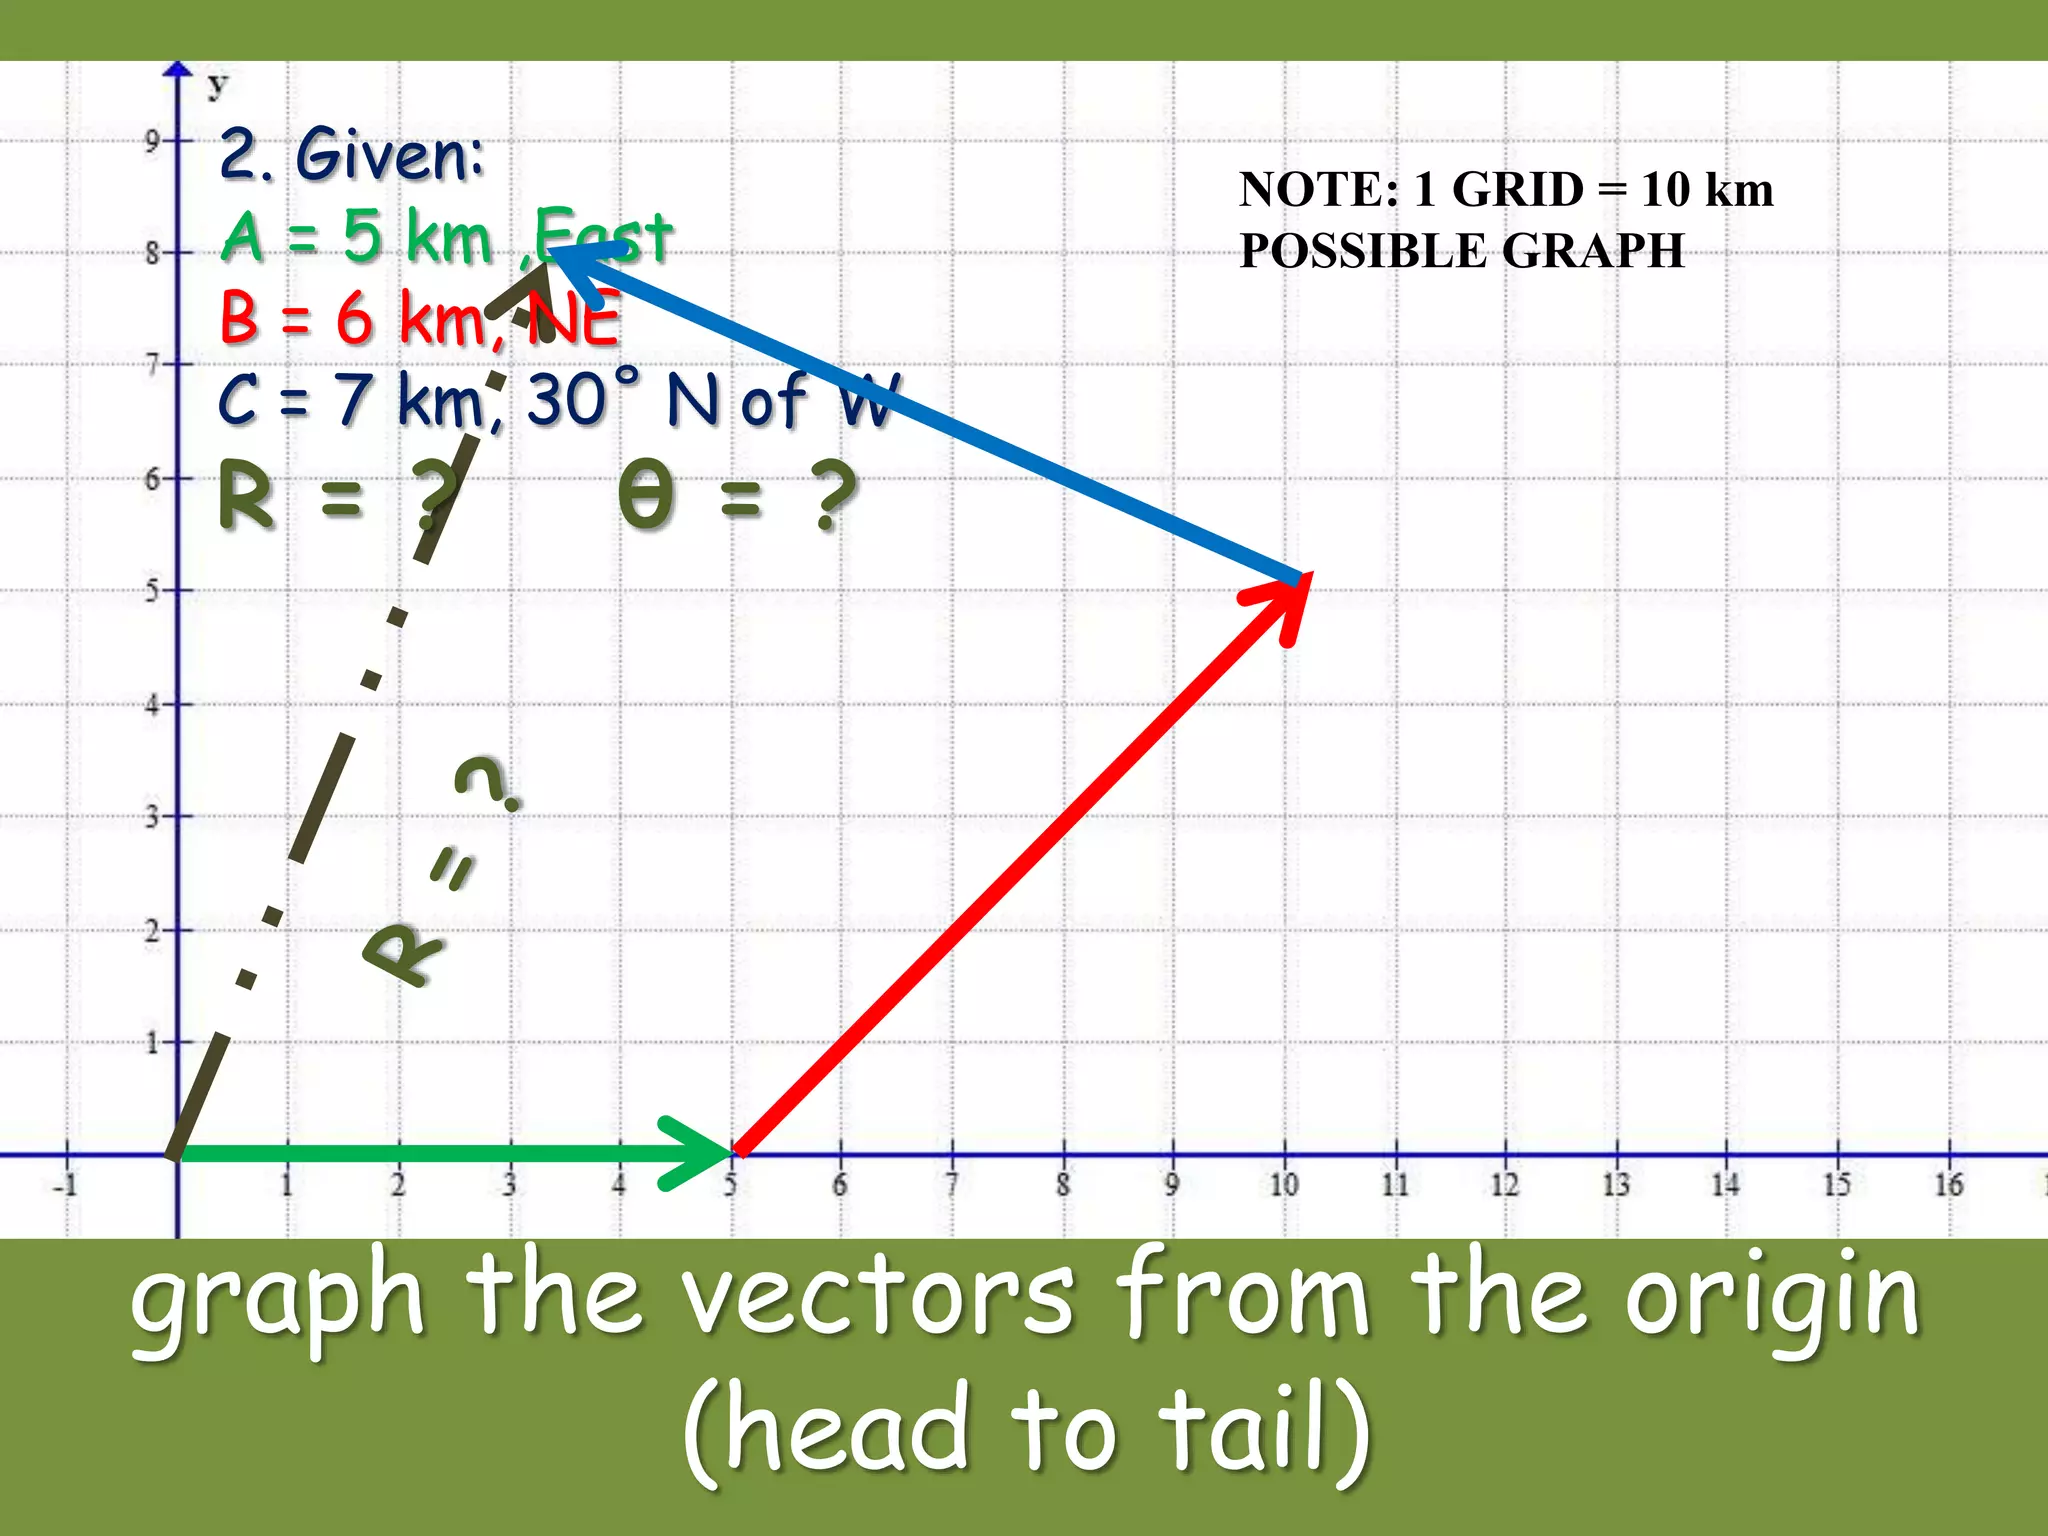
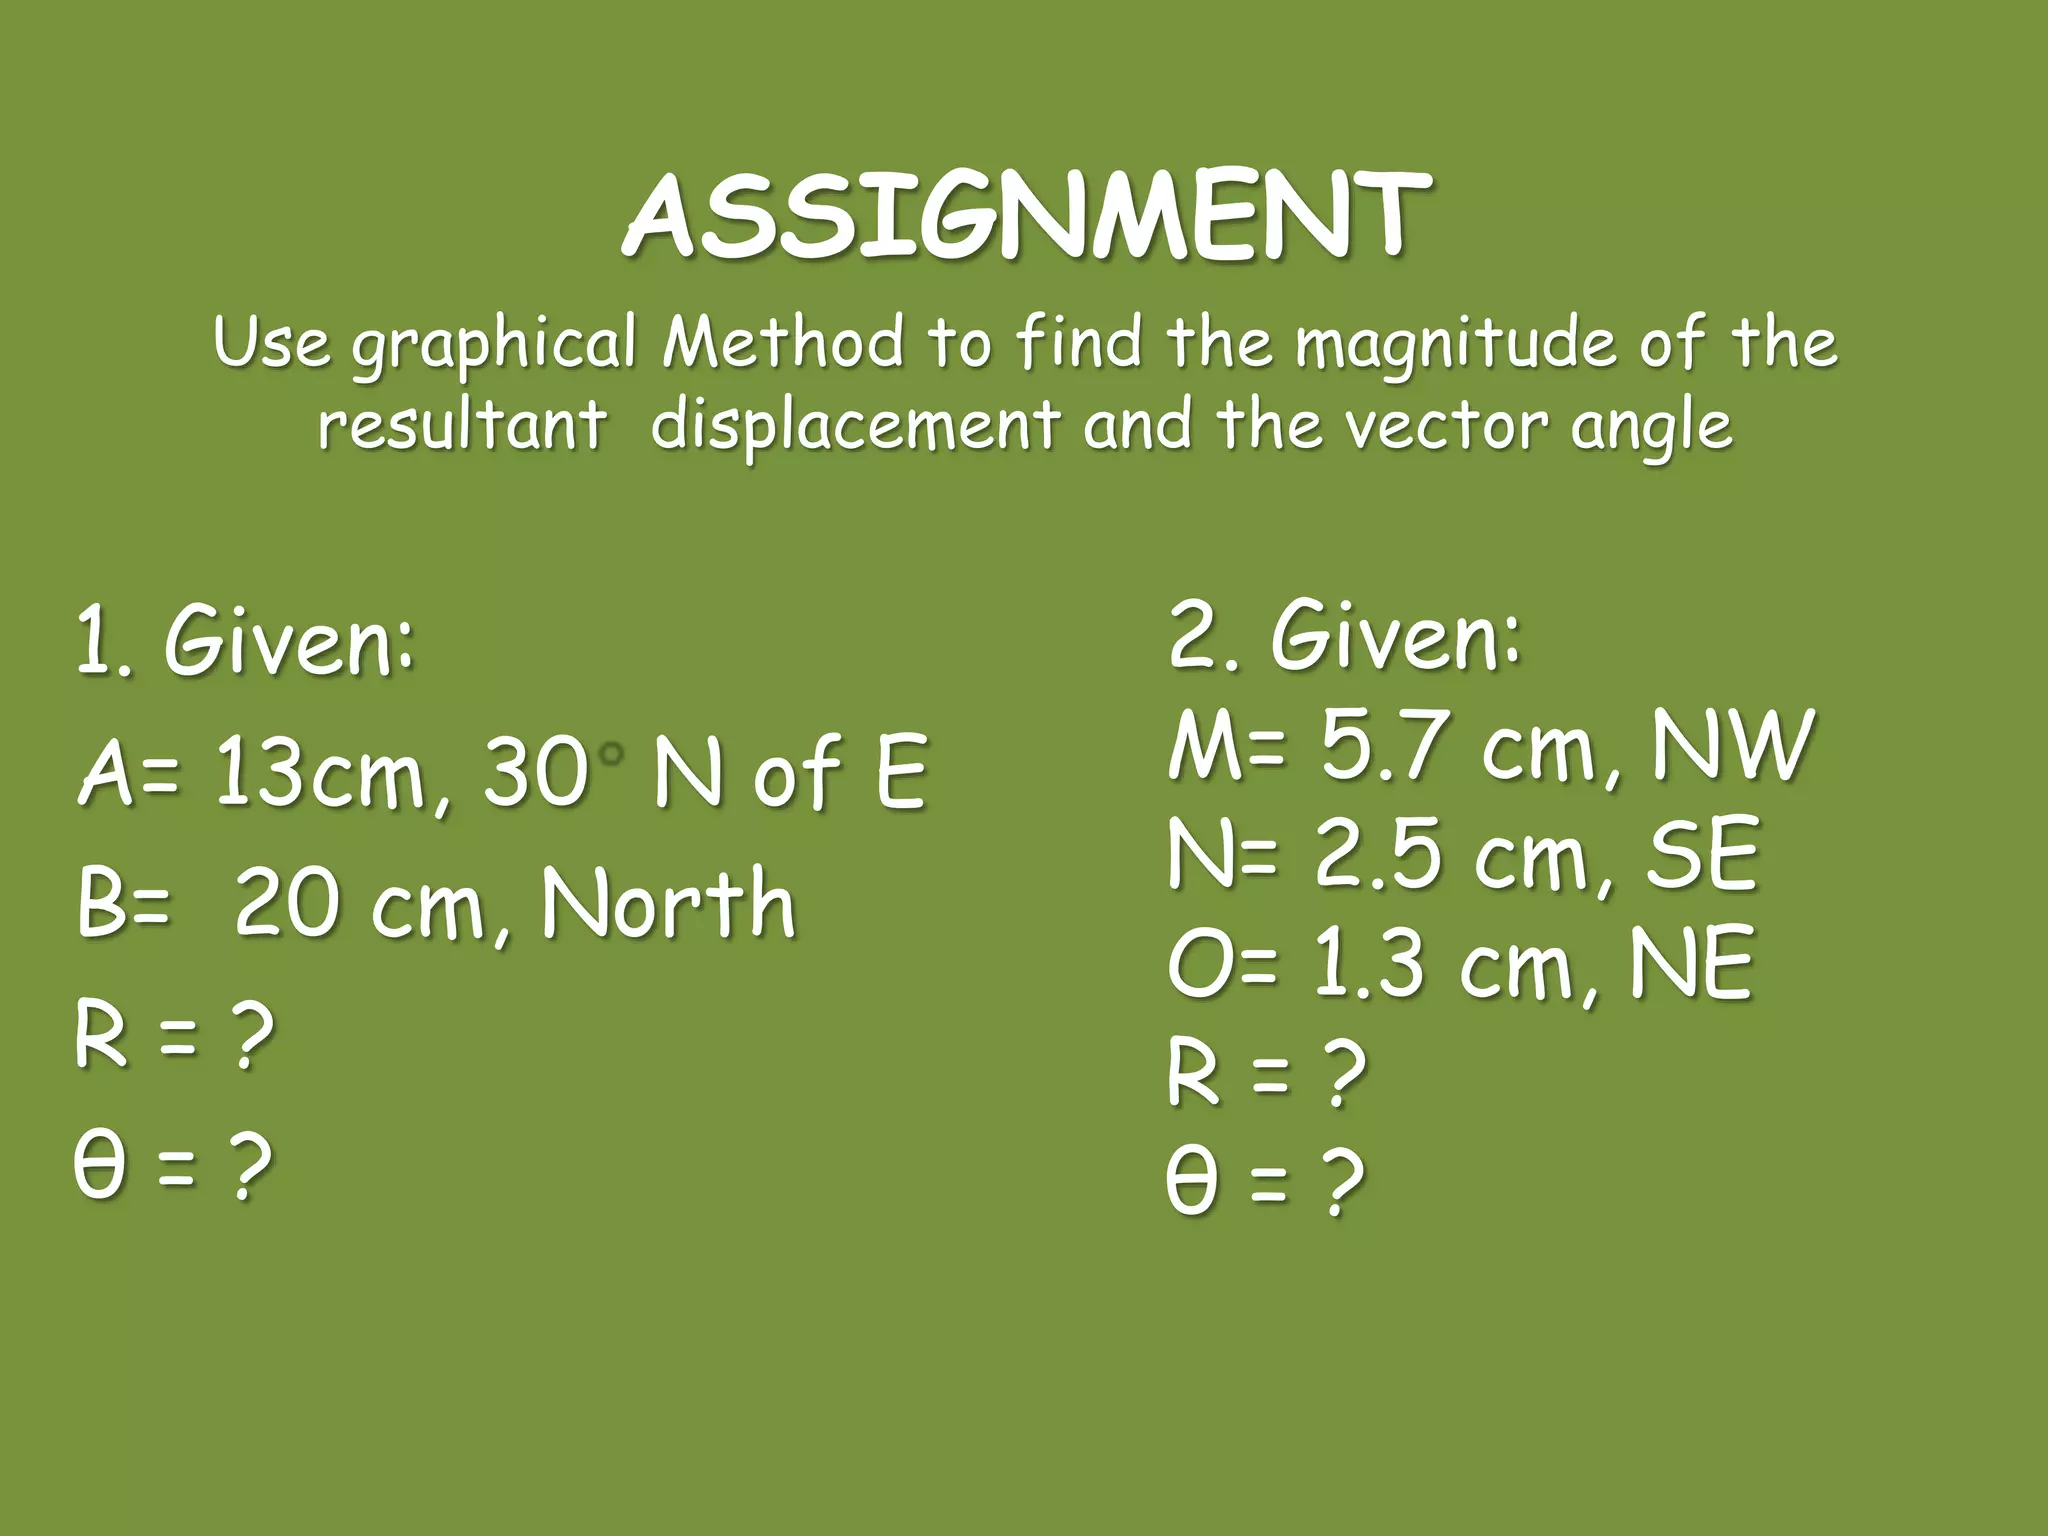
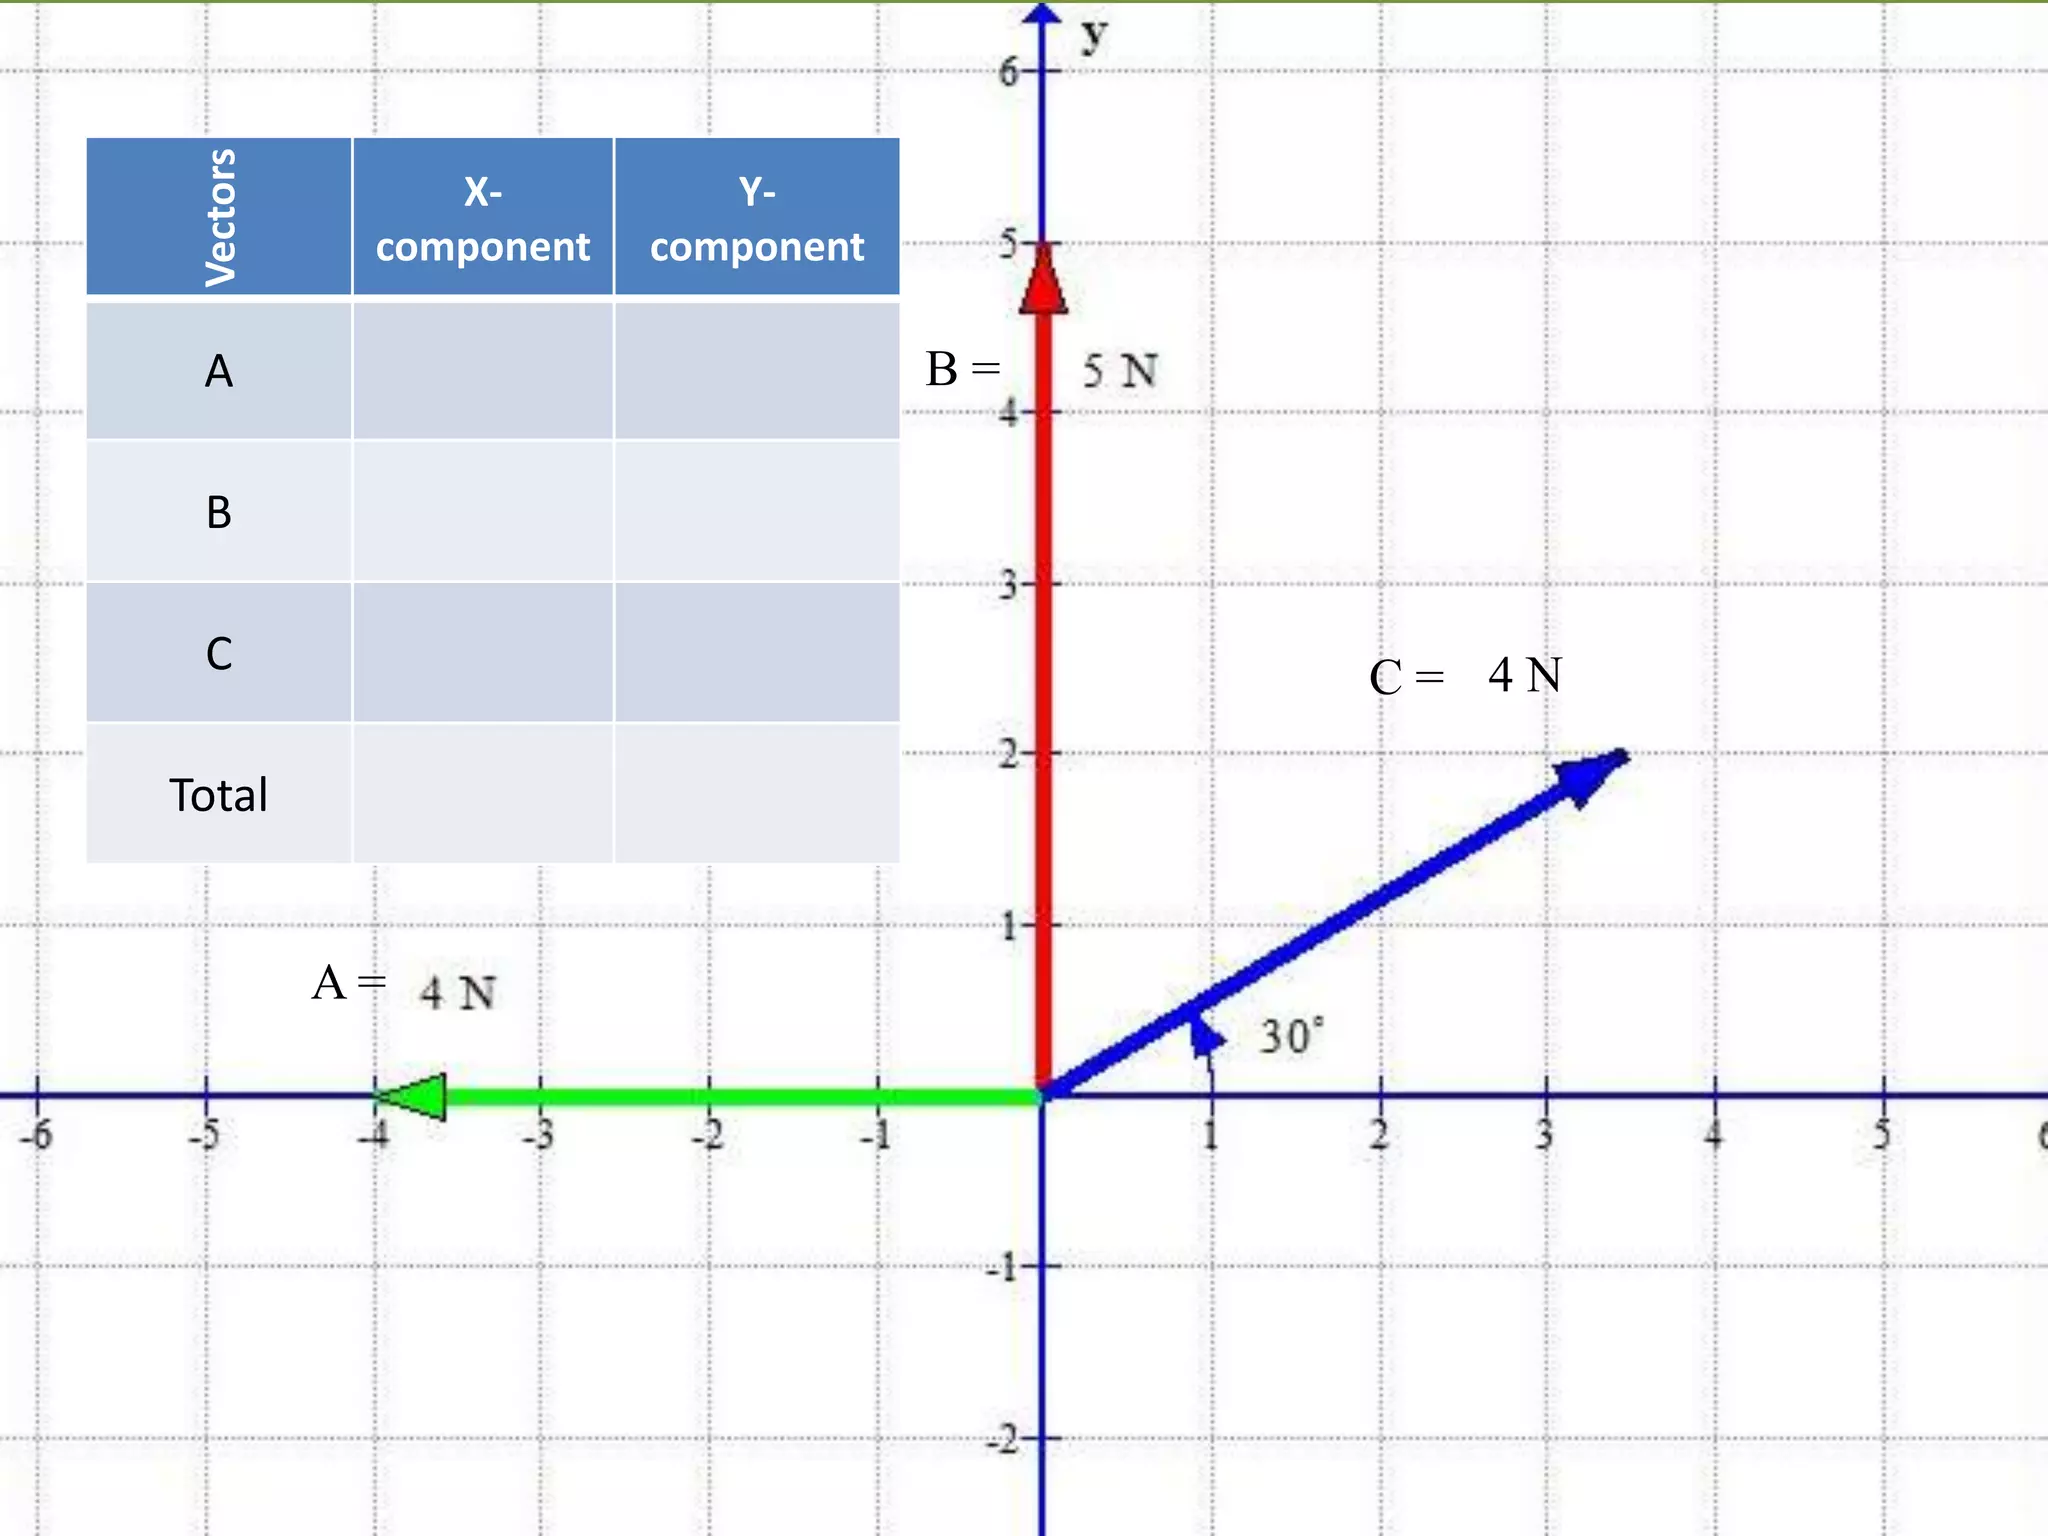
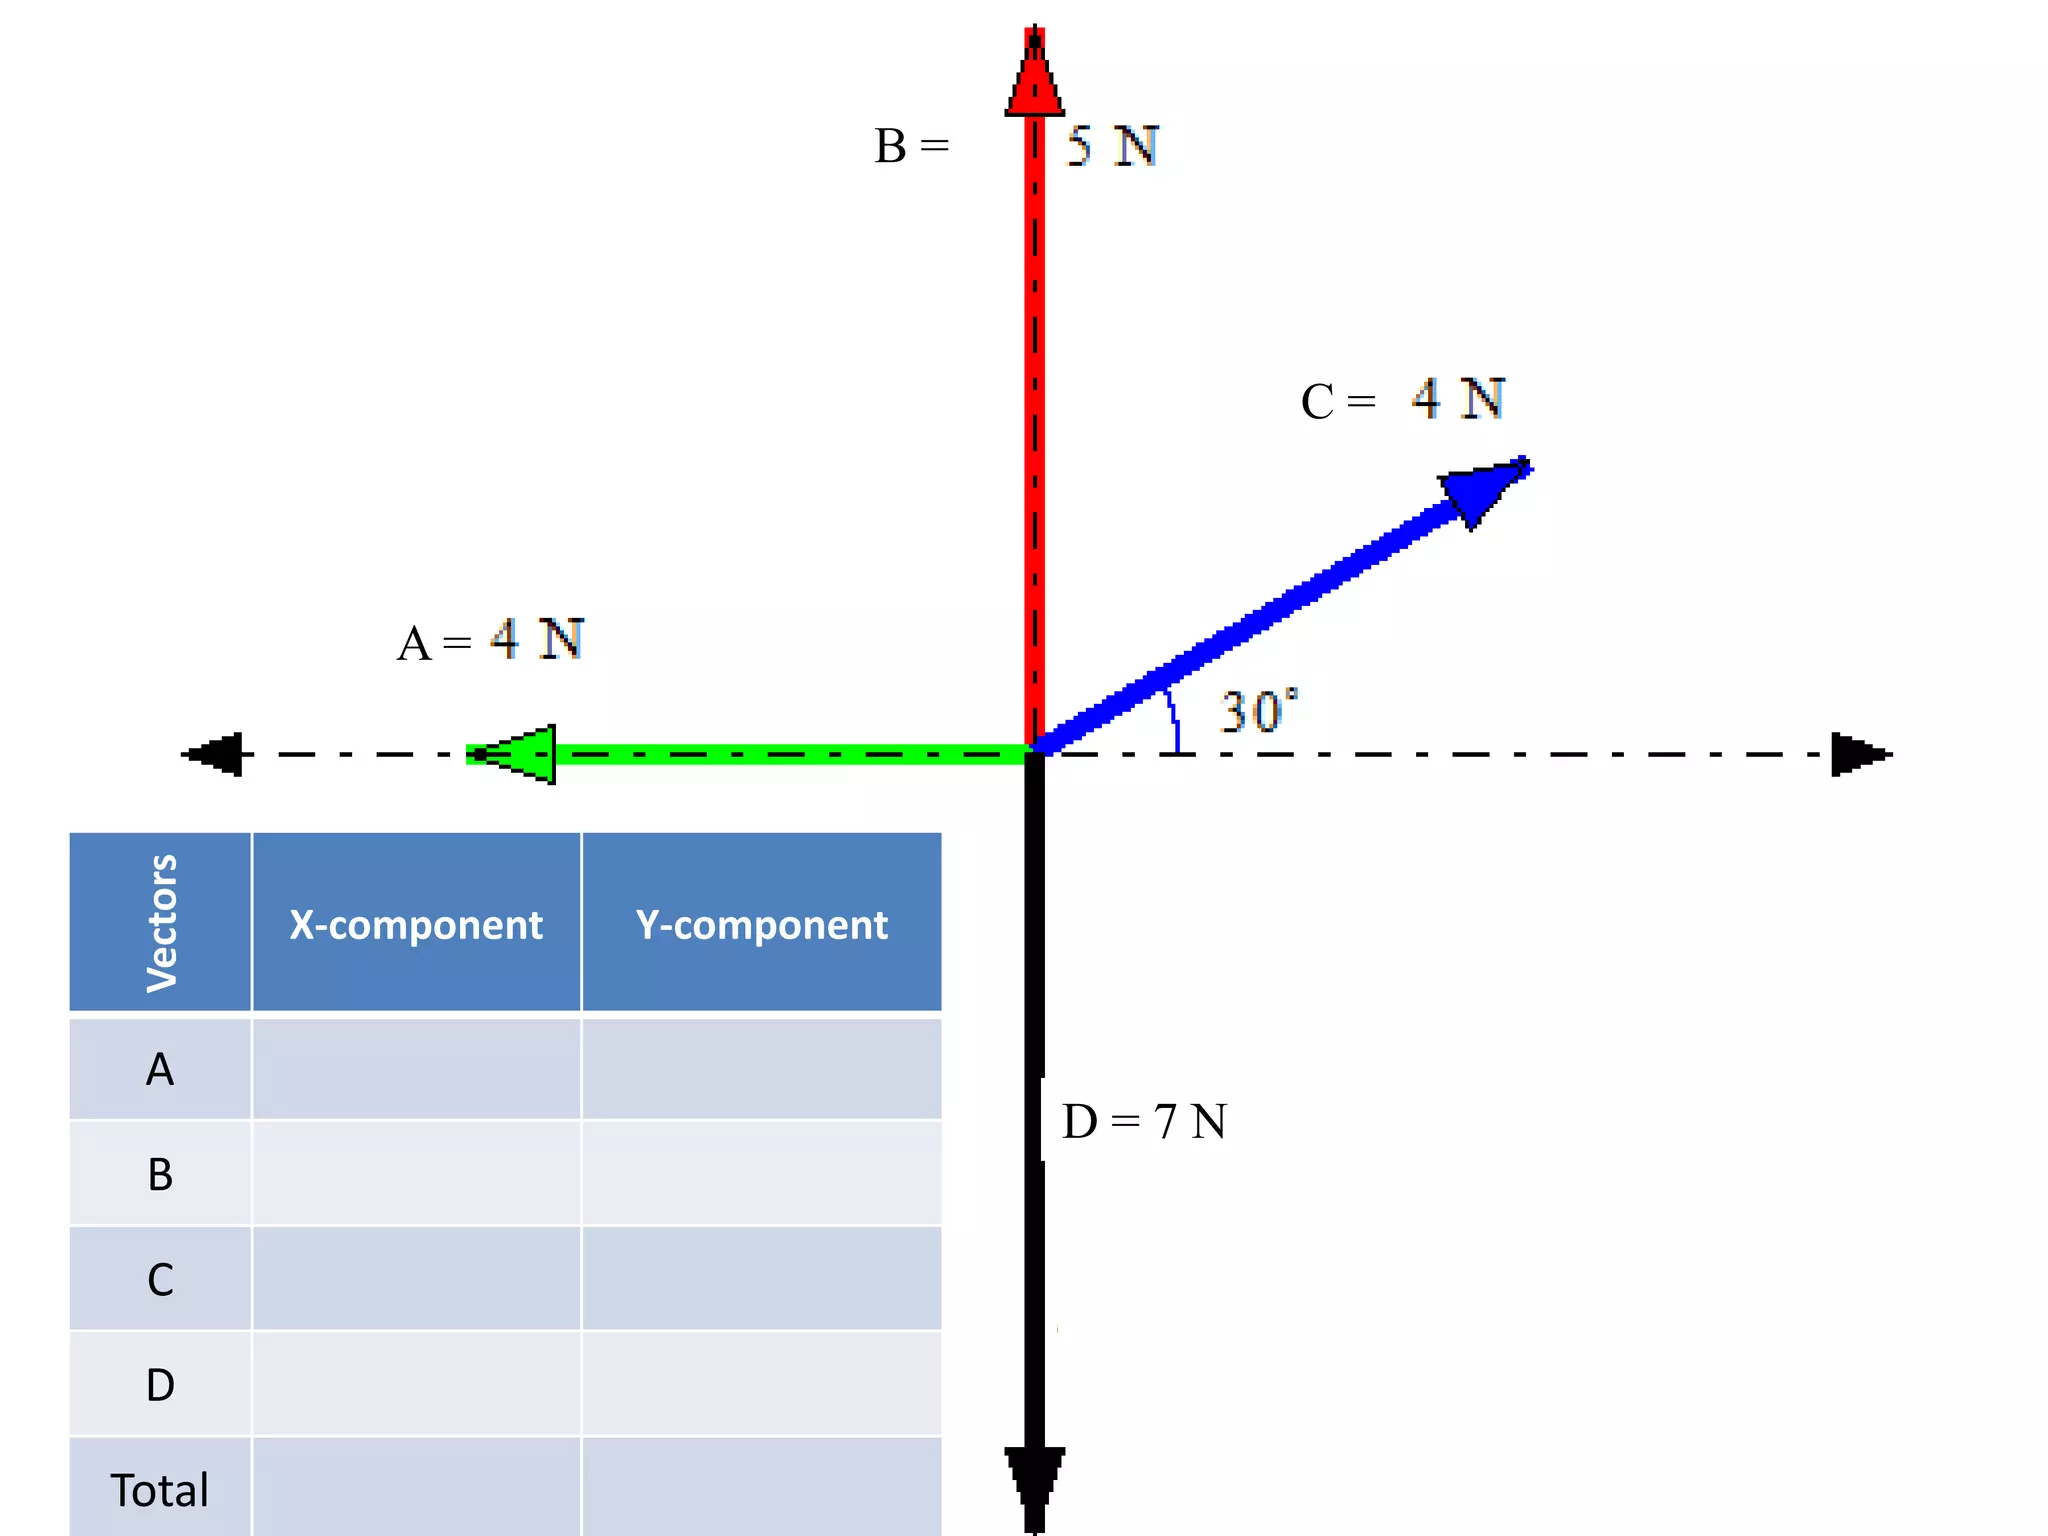
Analysis of vector components in new example problems; practice assignment given for users.
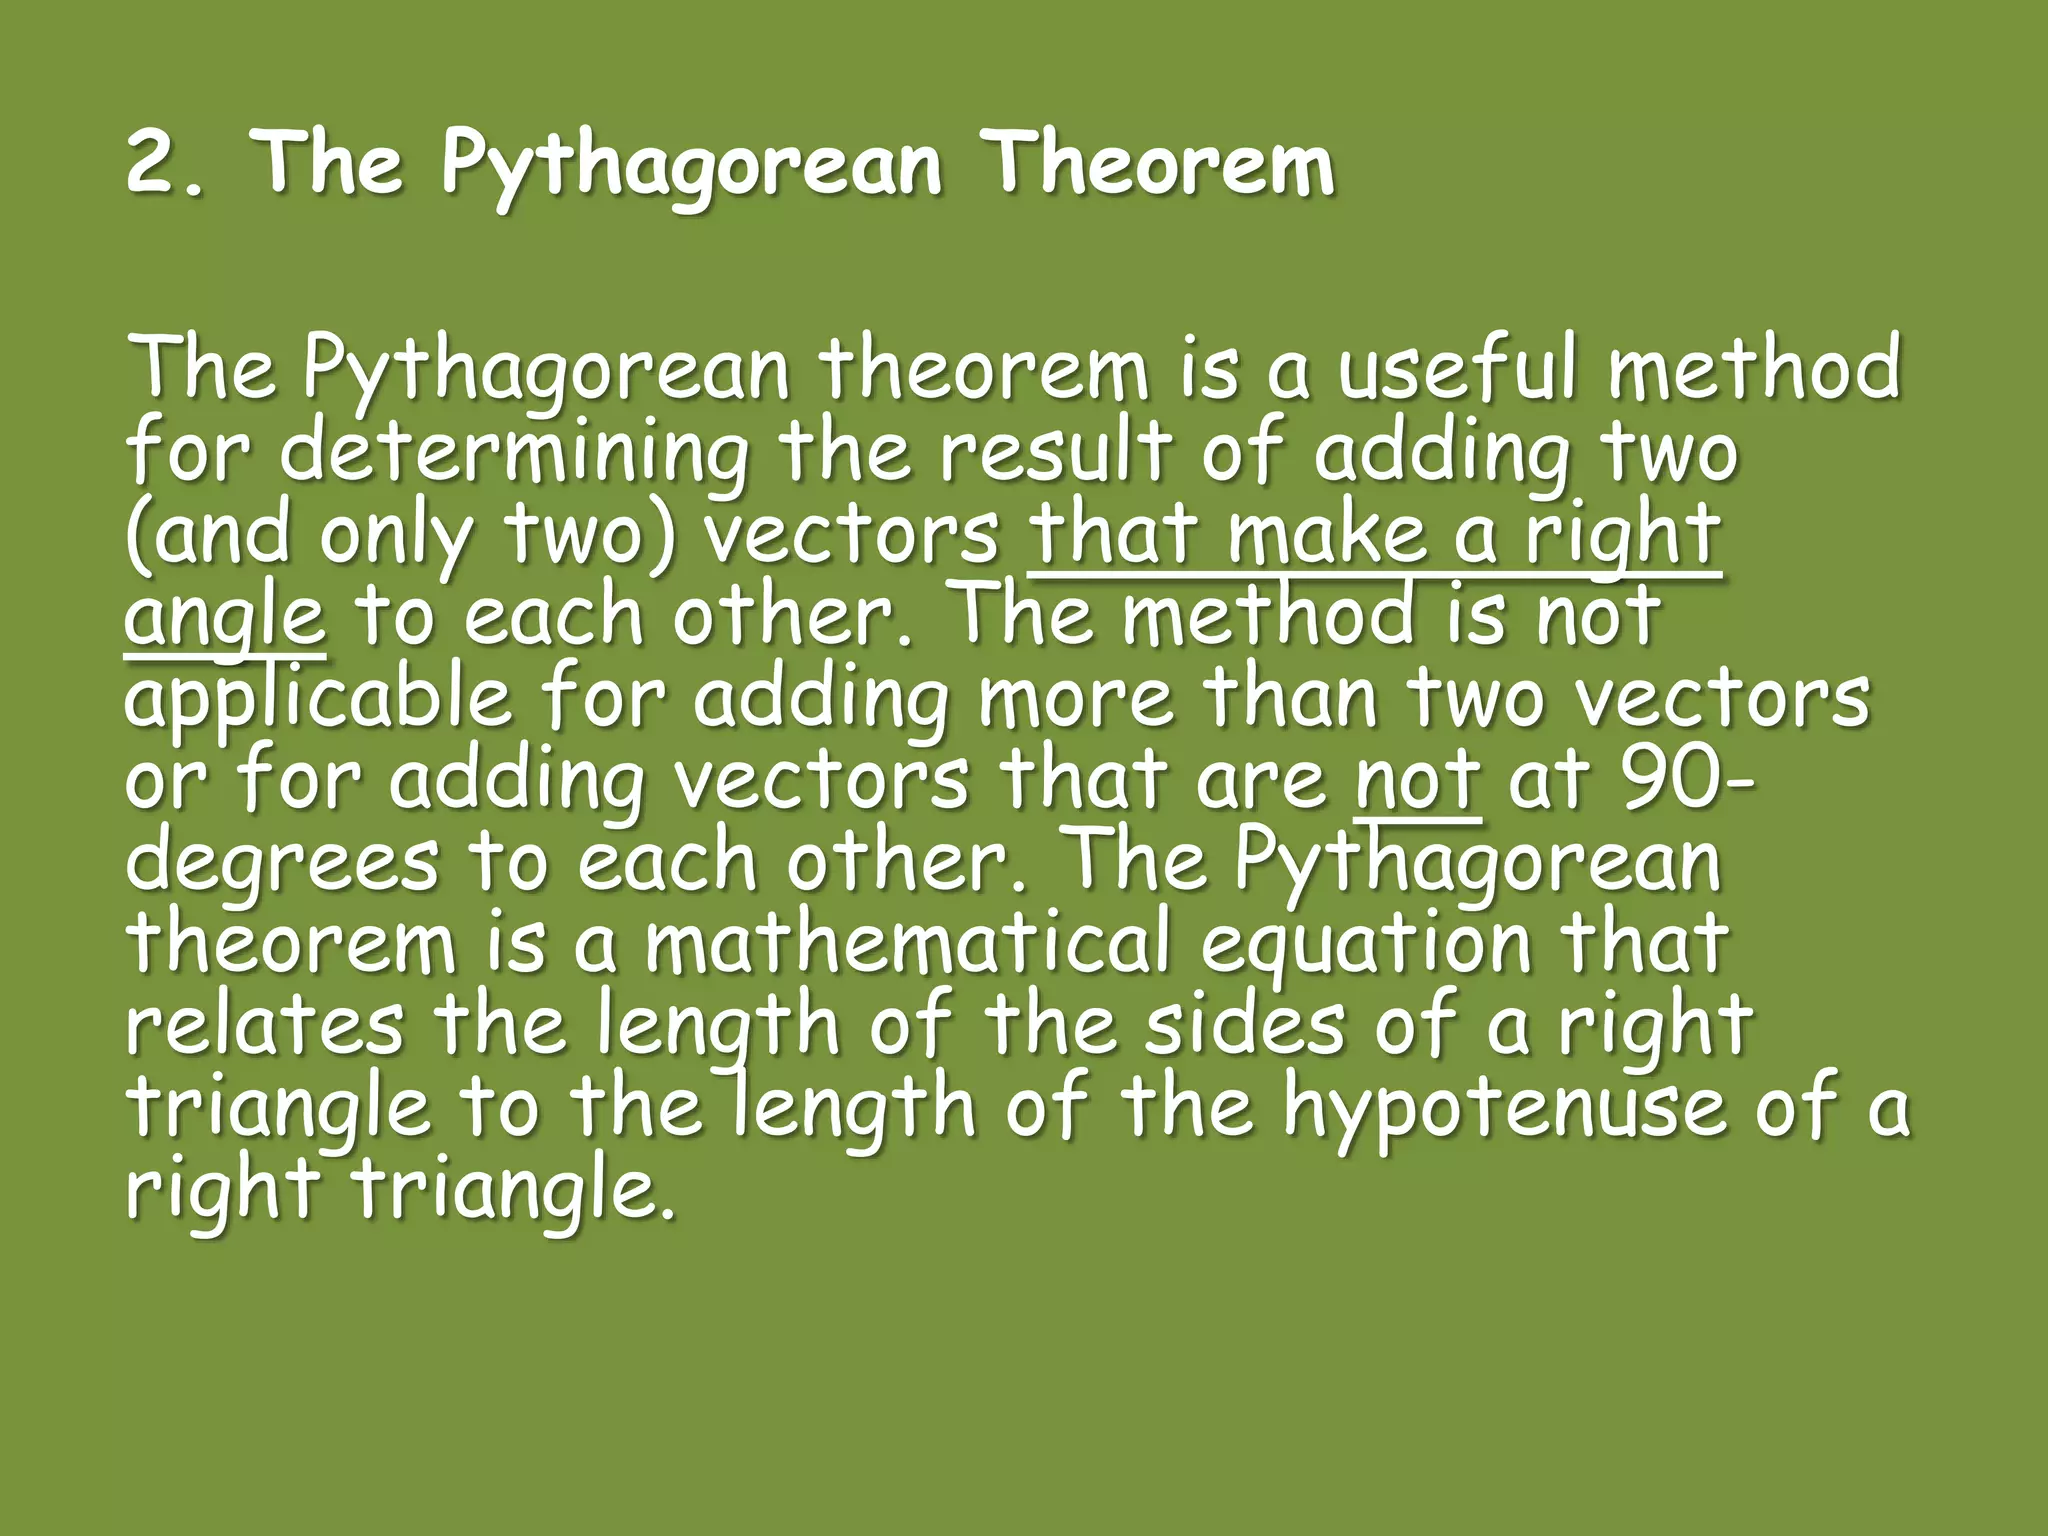
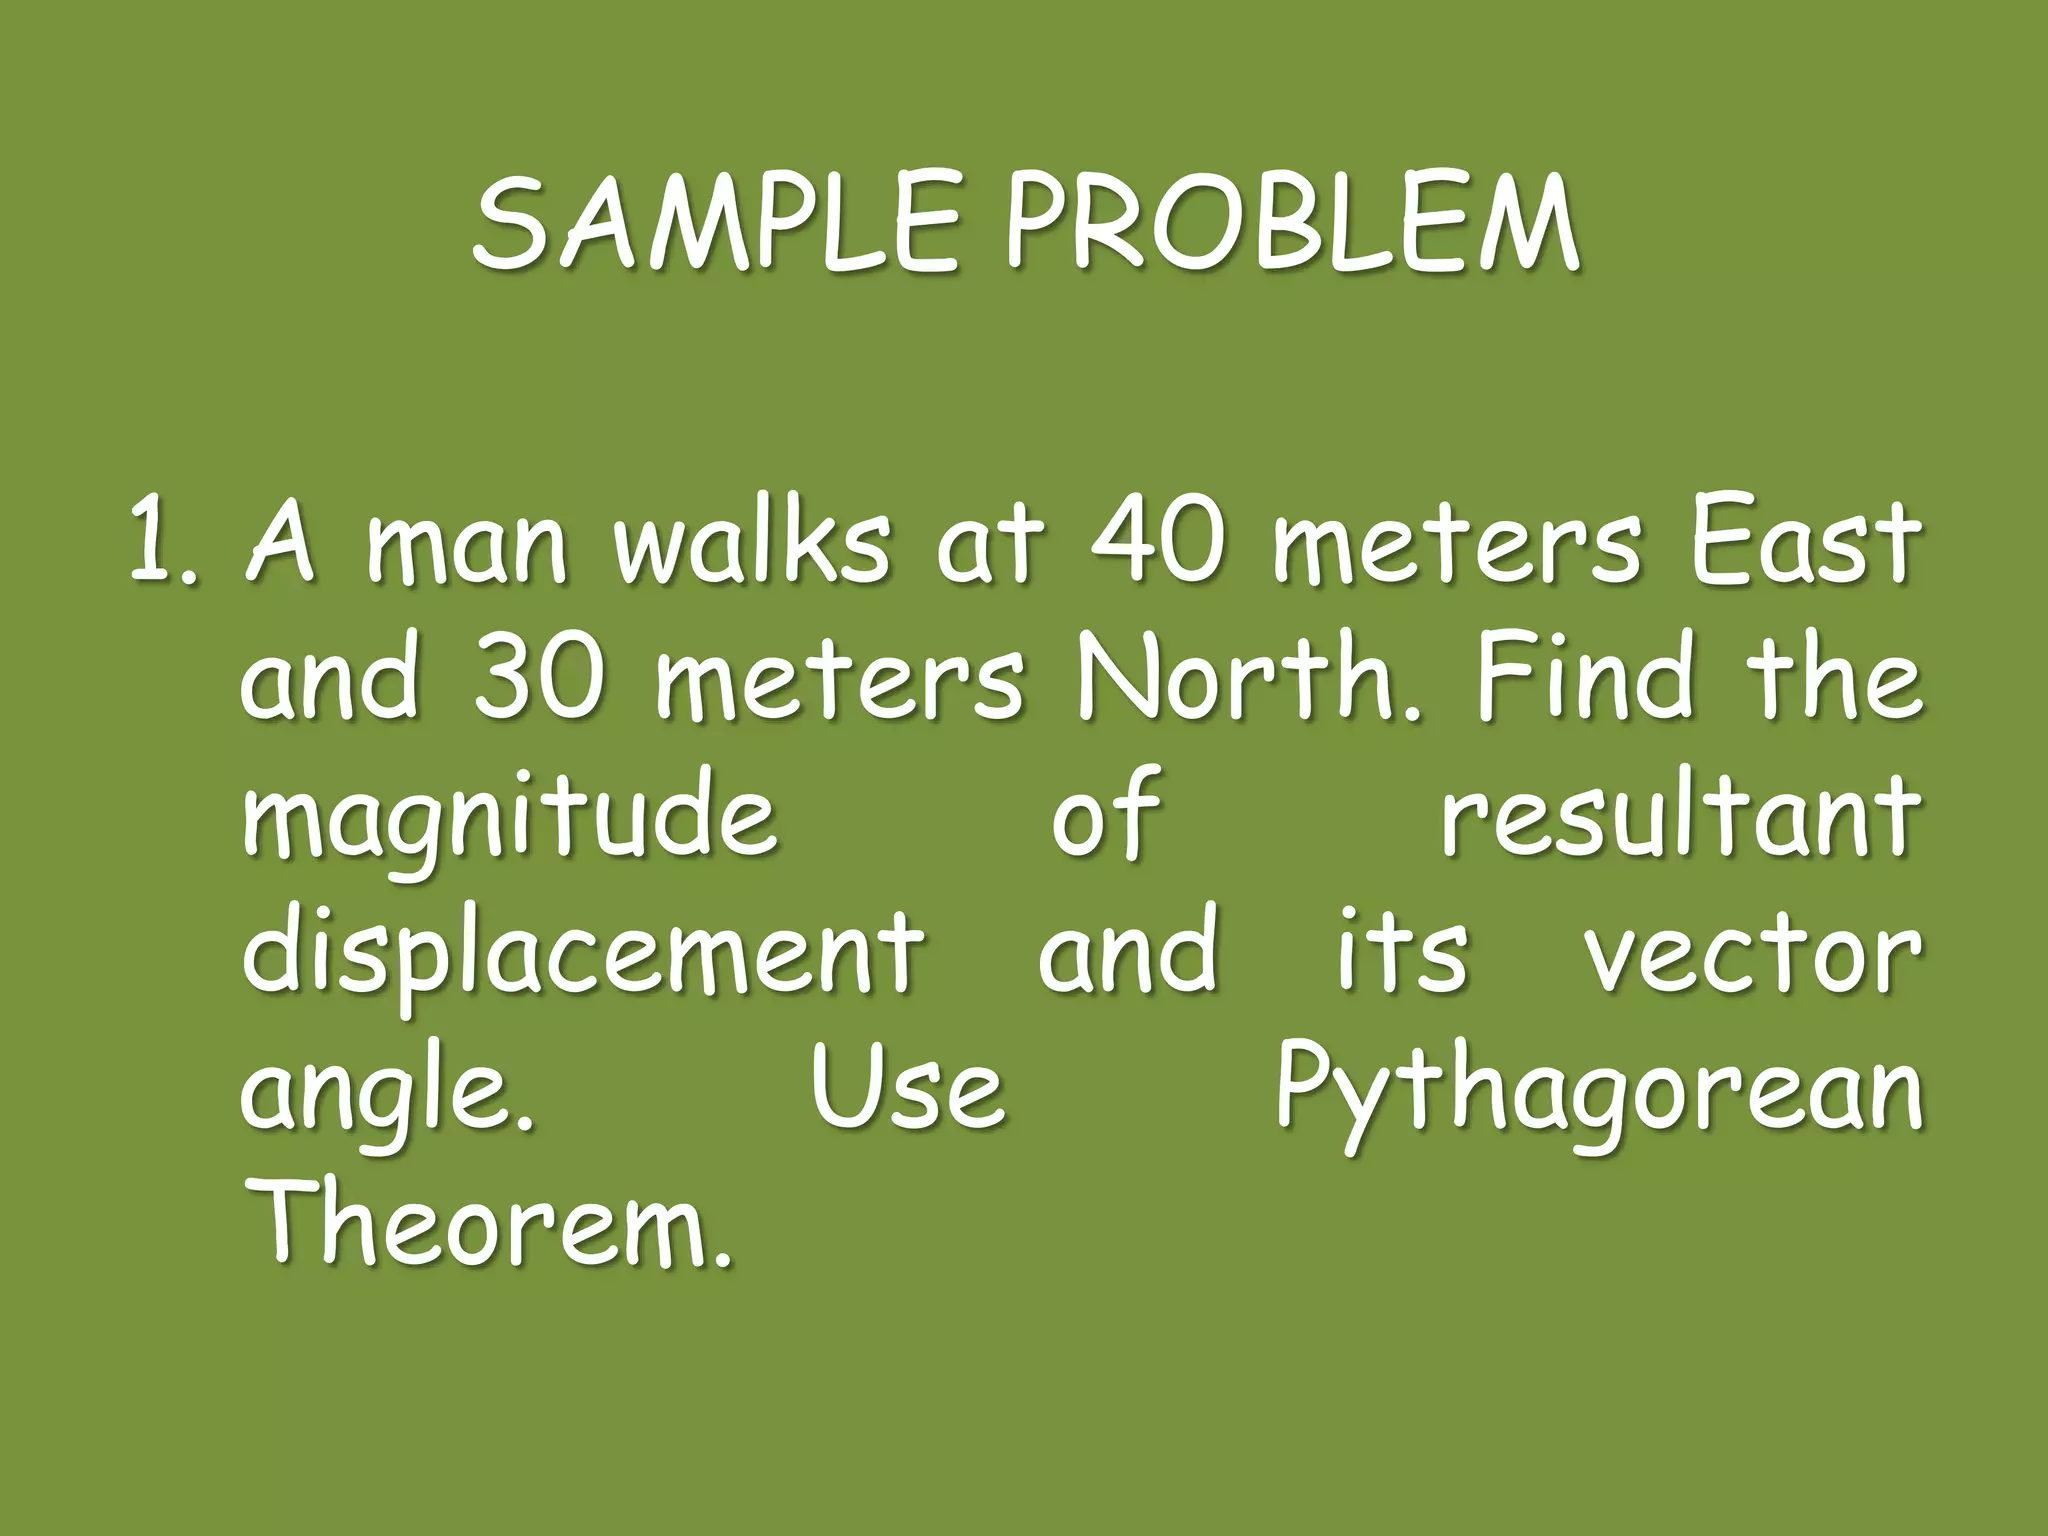
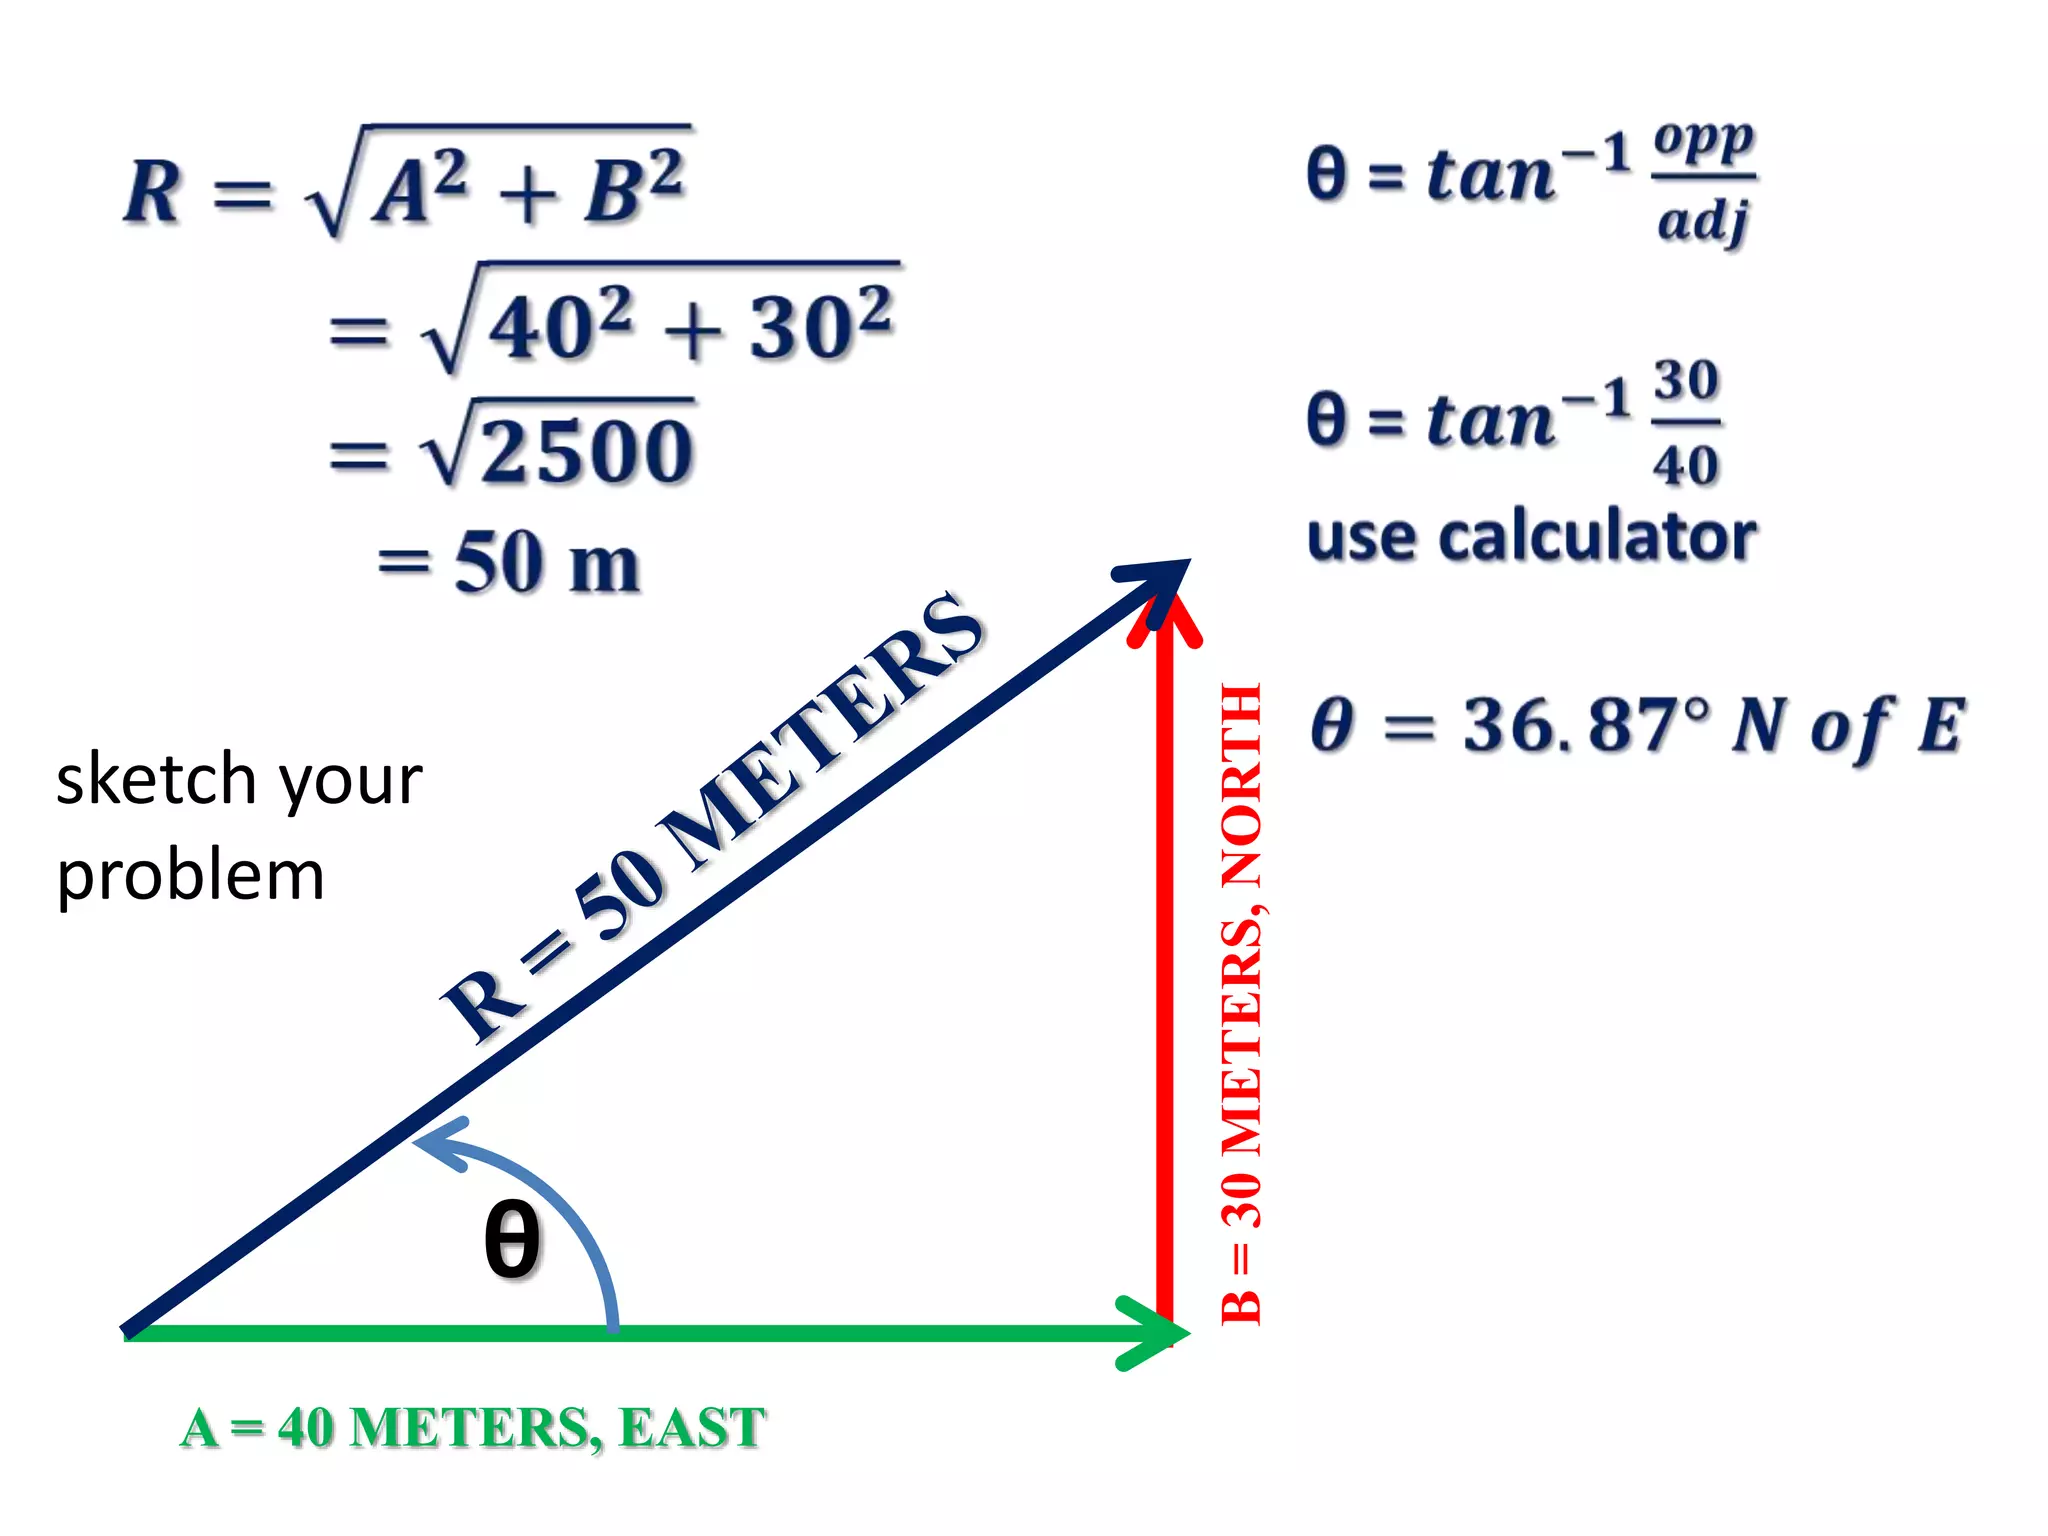
Using Pythagorean theorem to find resultant displacement in right-angle triangle problems.
Using Pythagorean theorem to find resultant displacement in right-angle triangle problems.
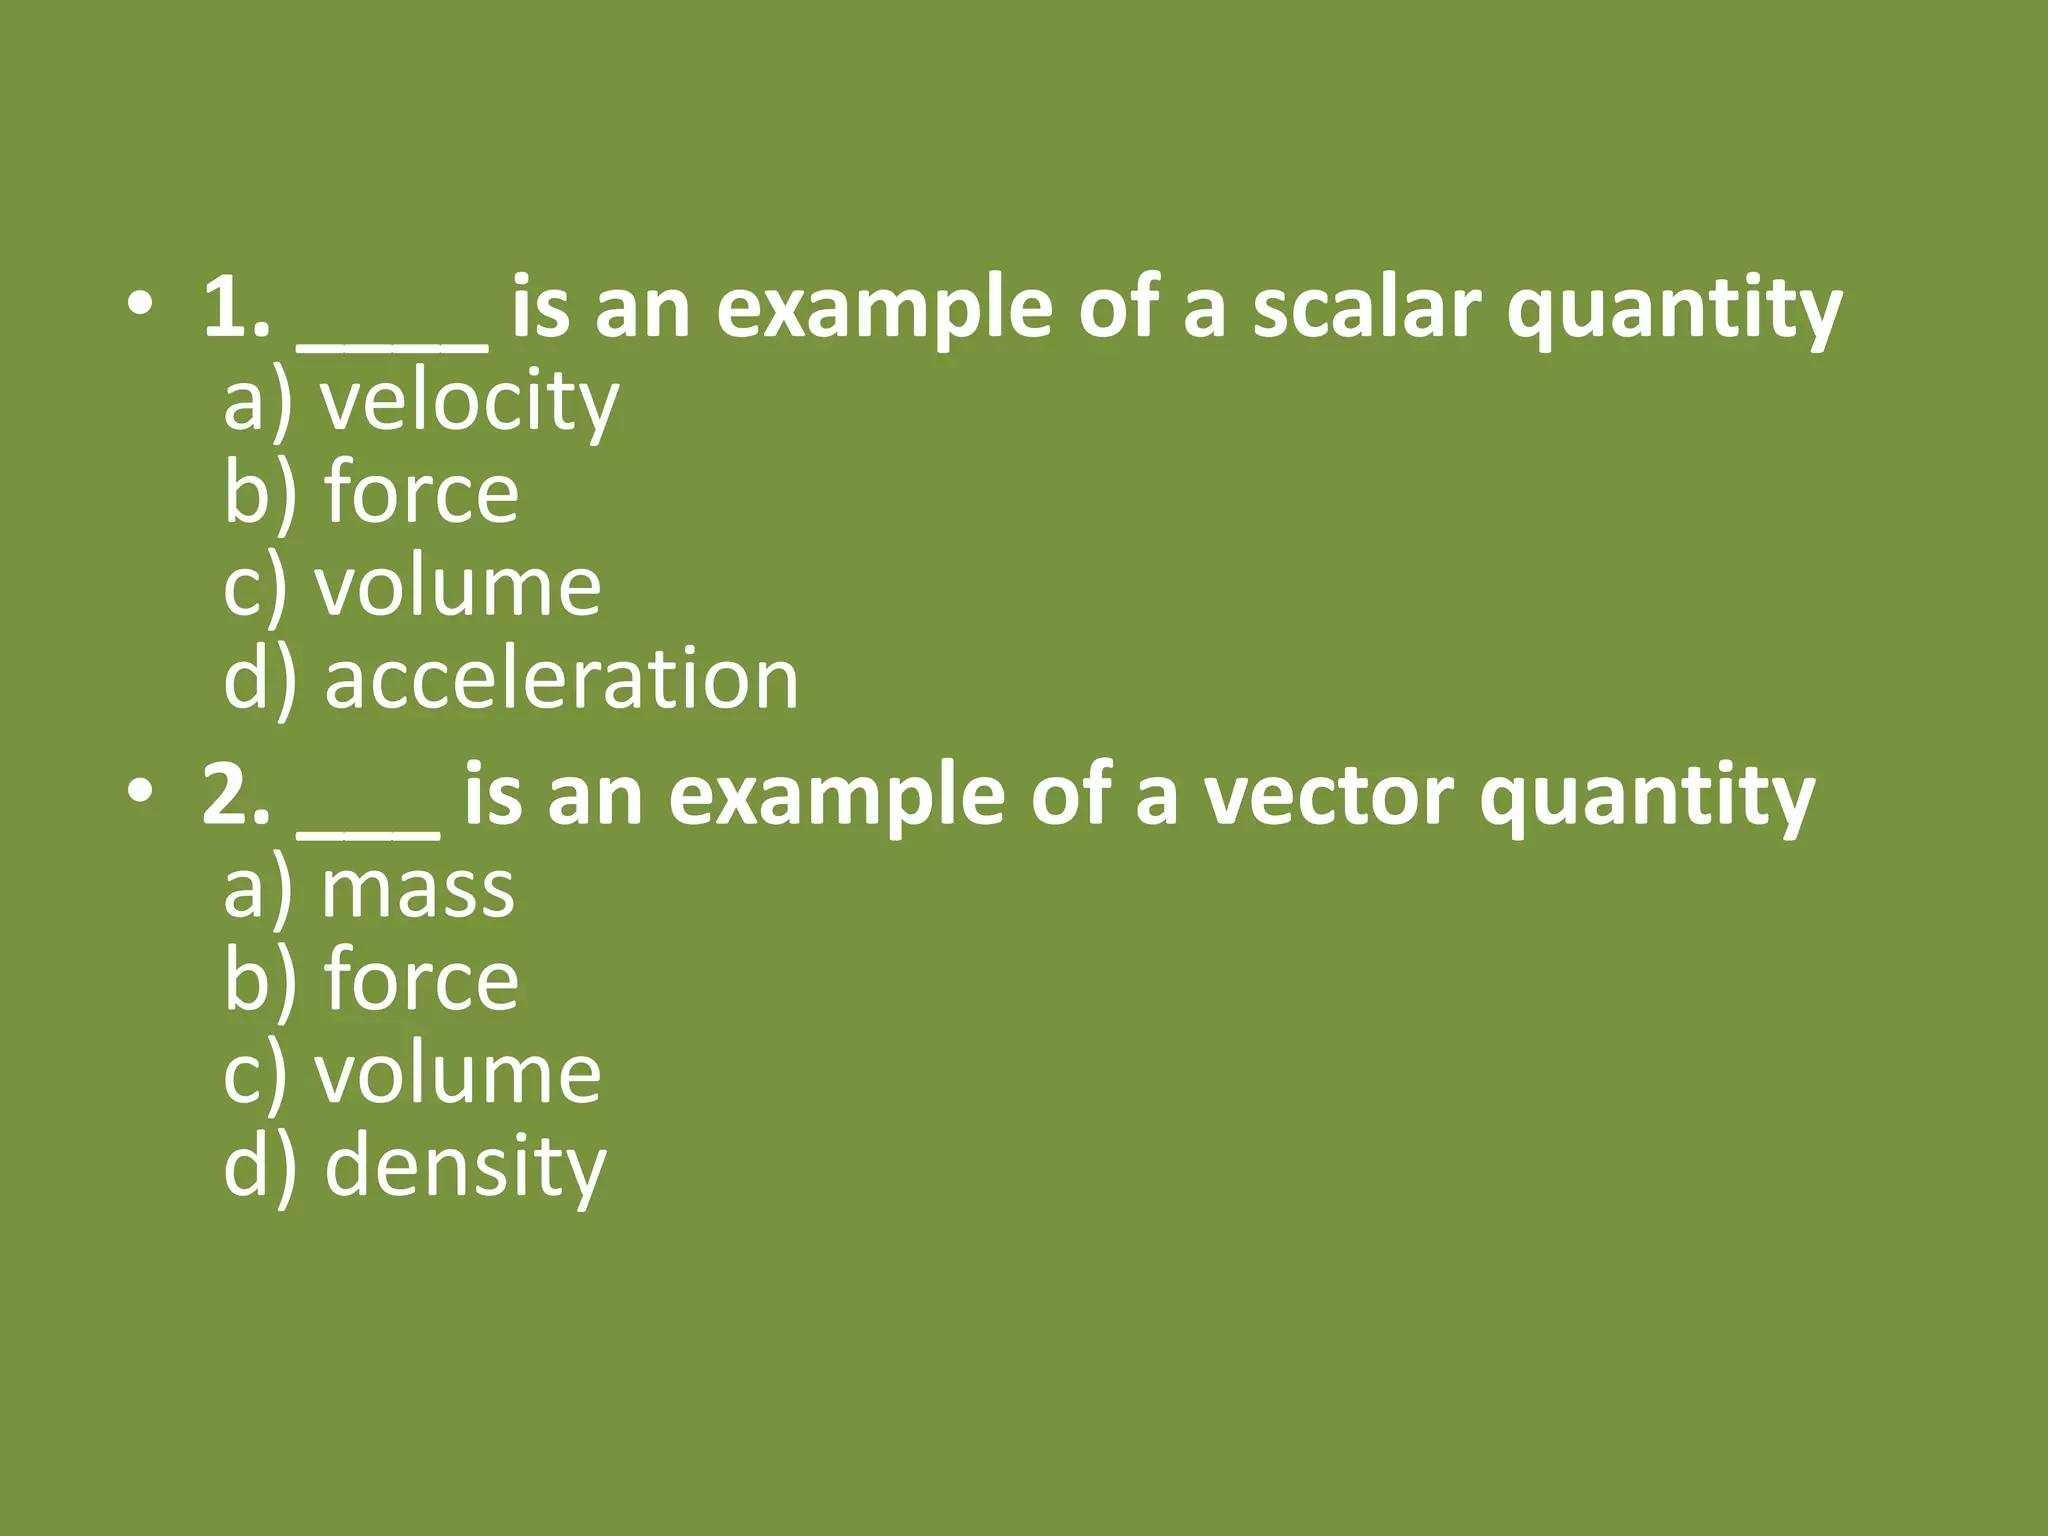
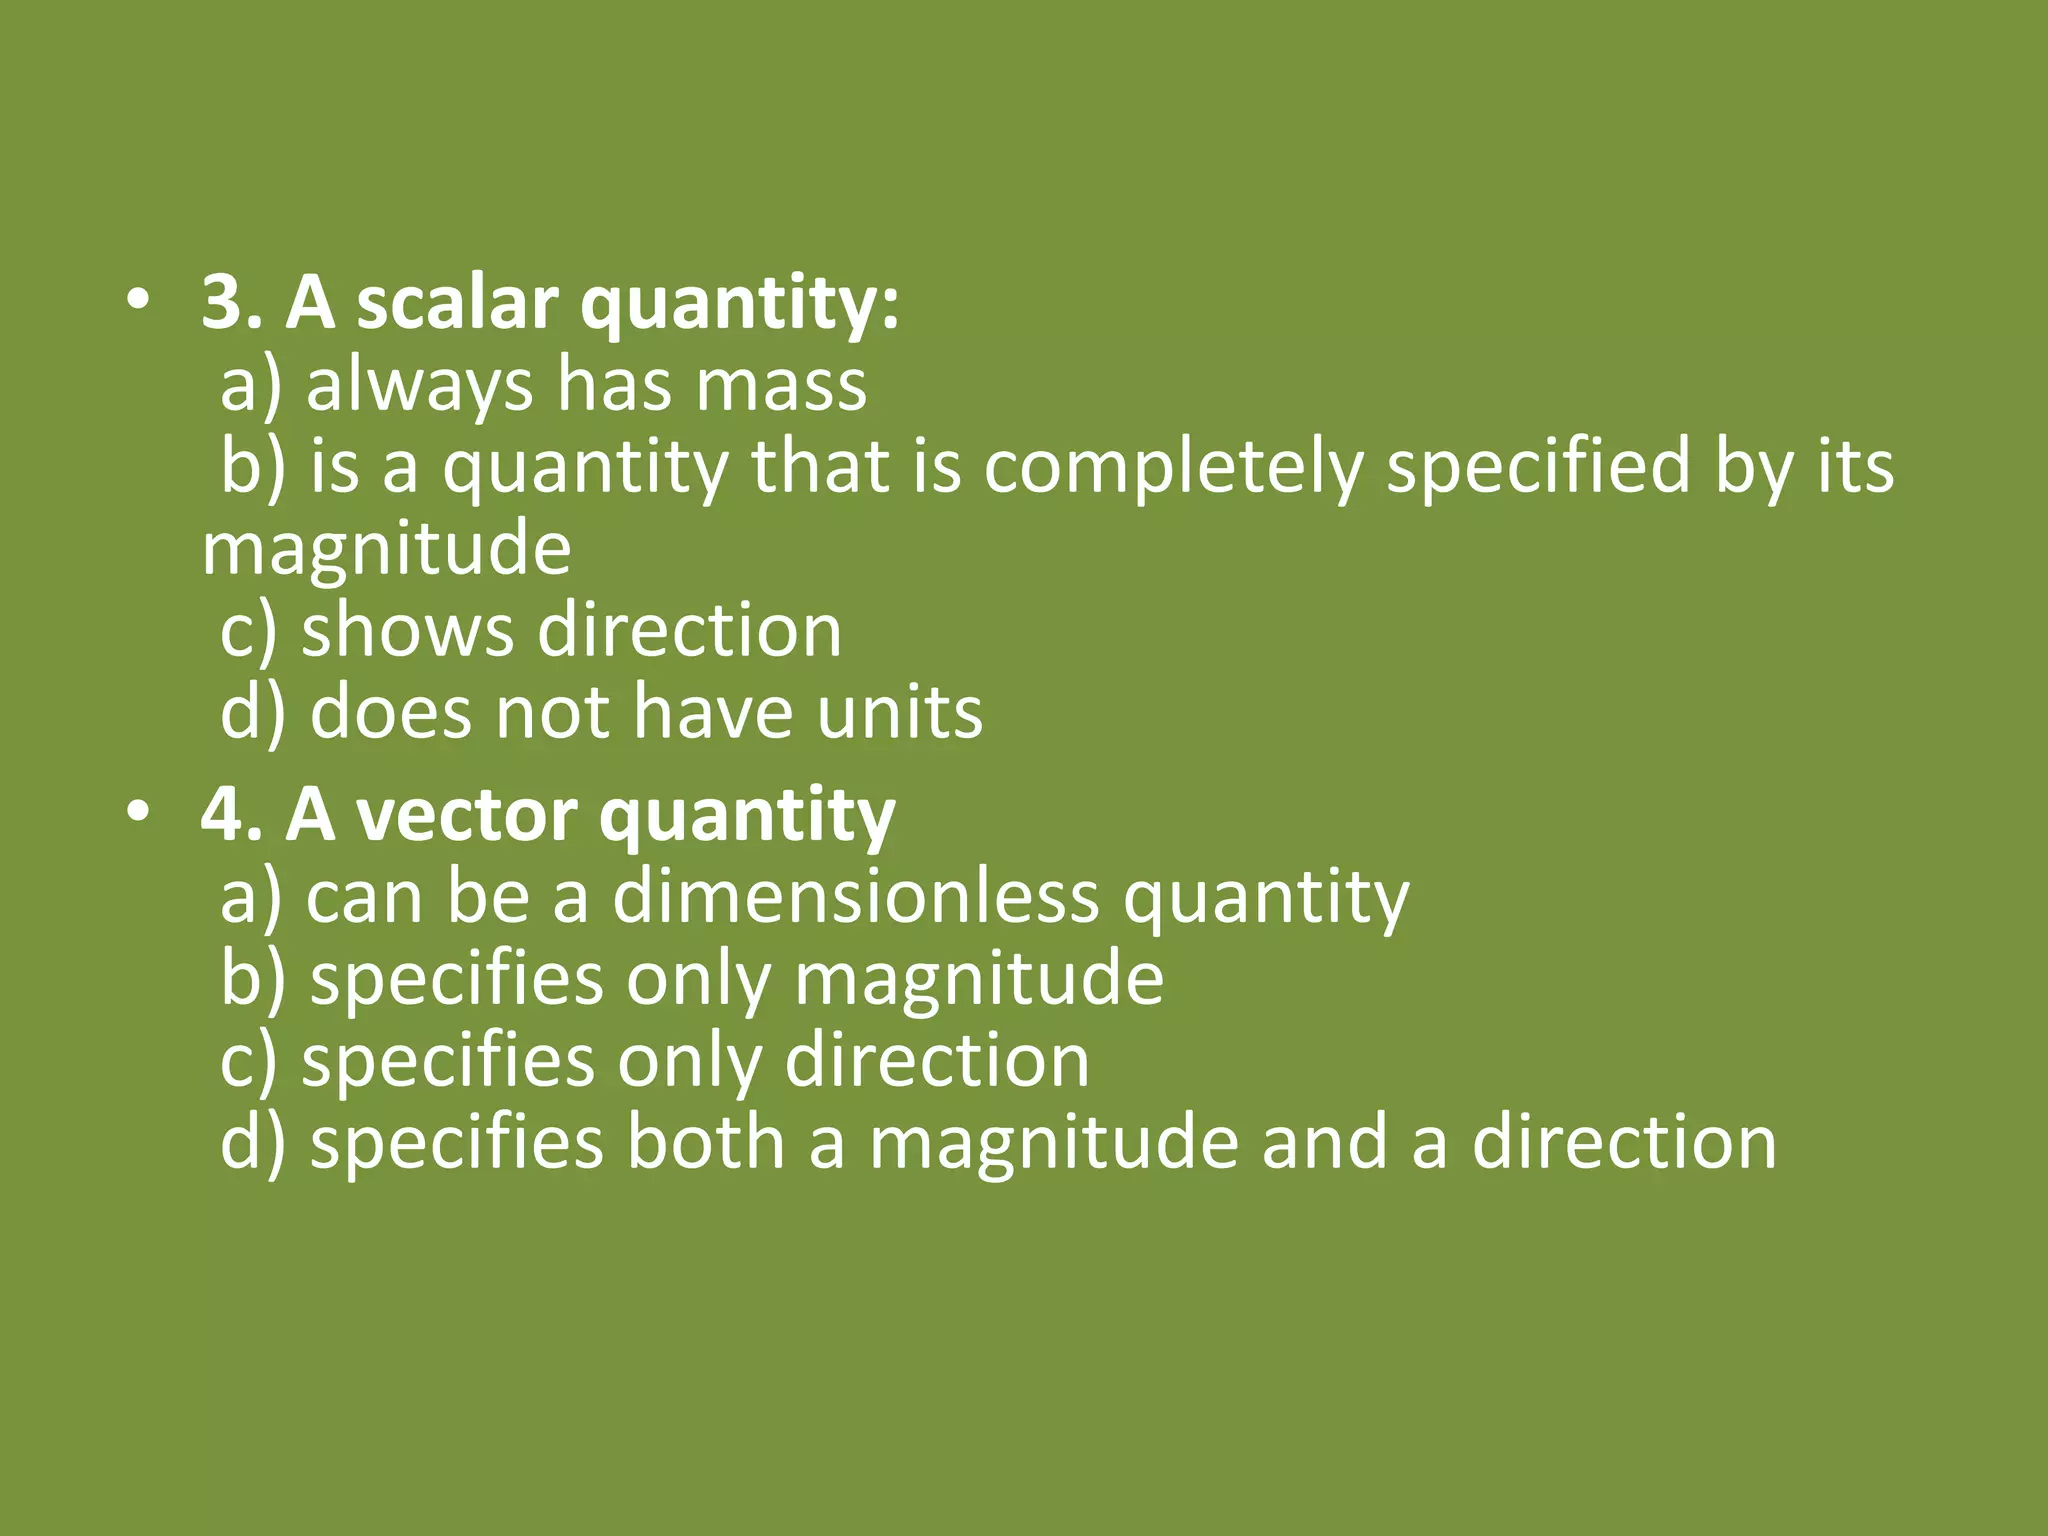
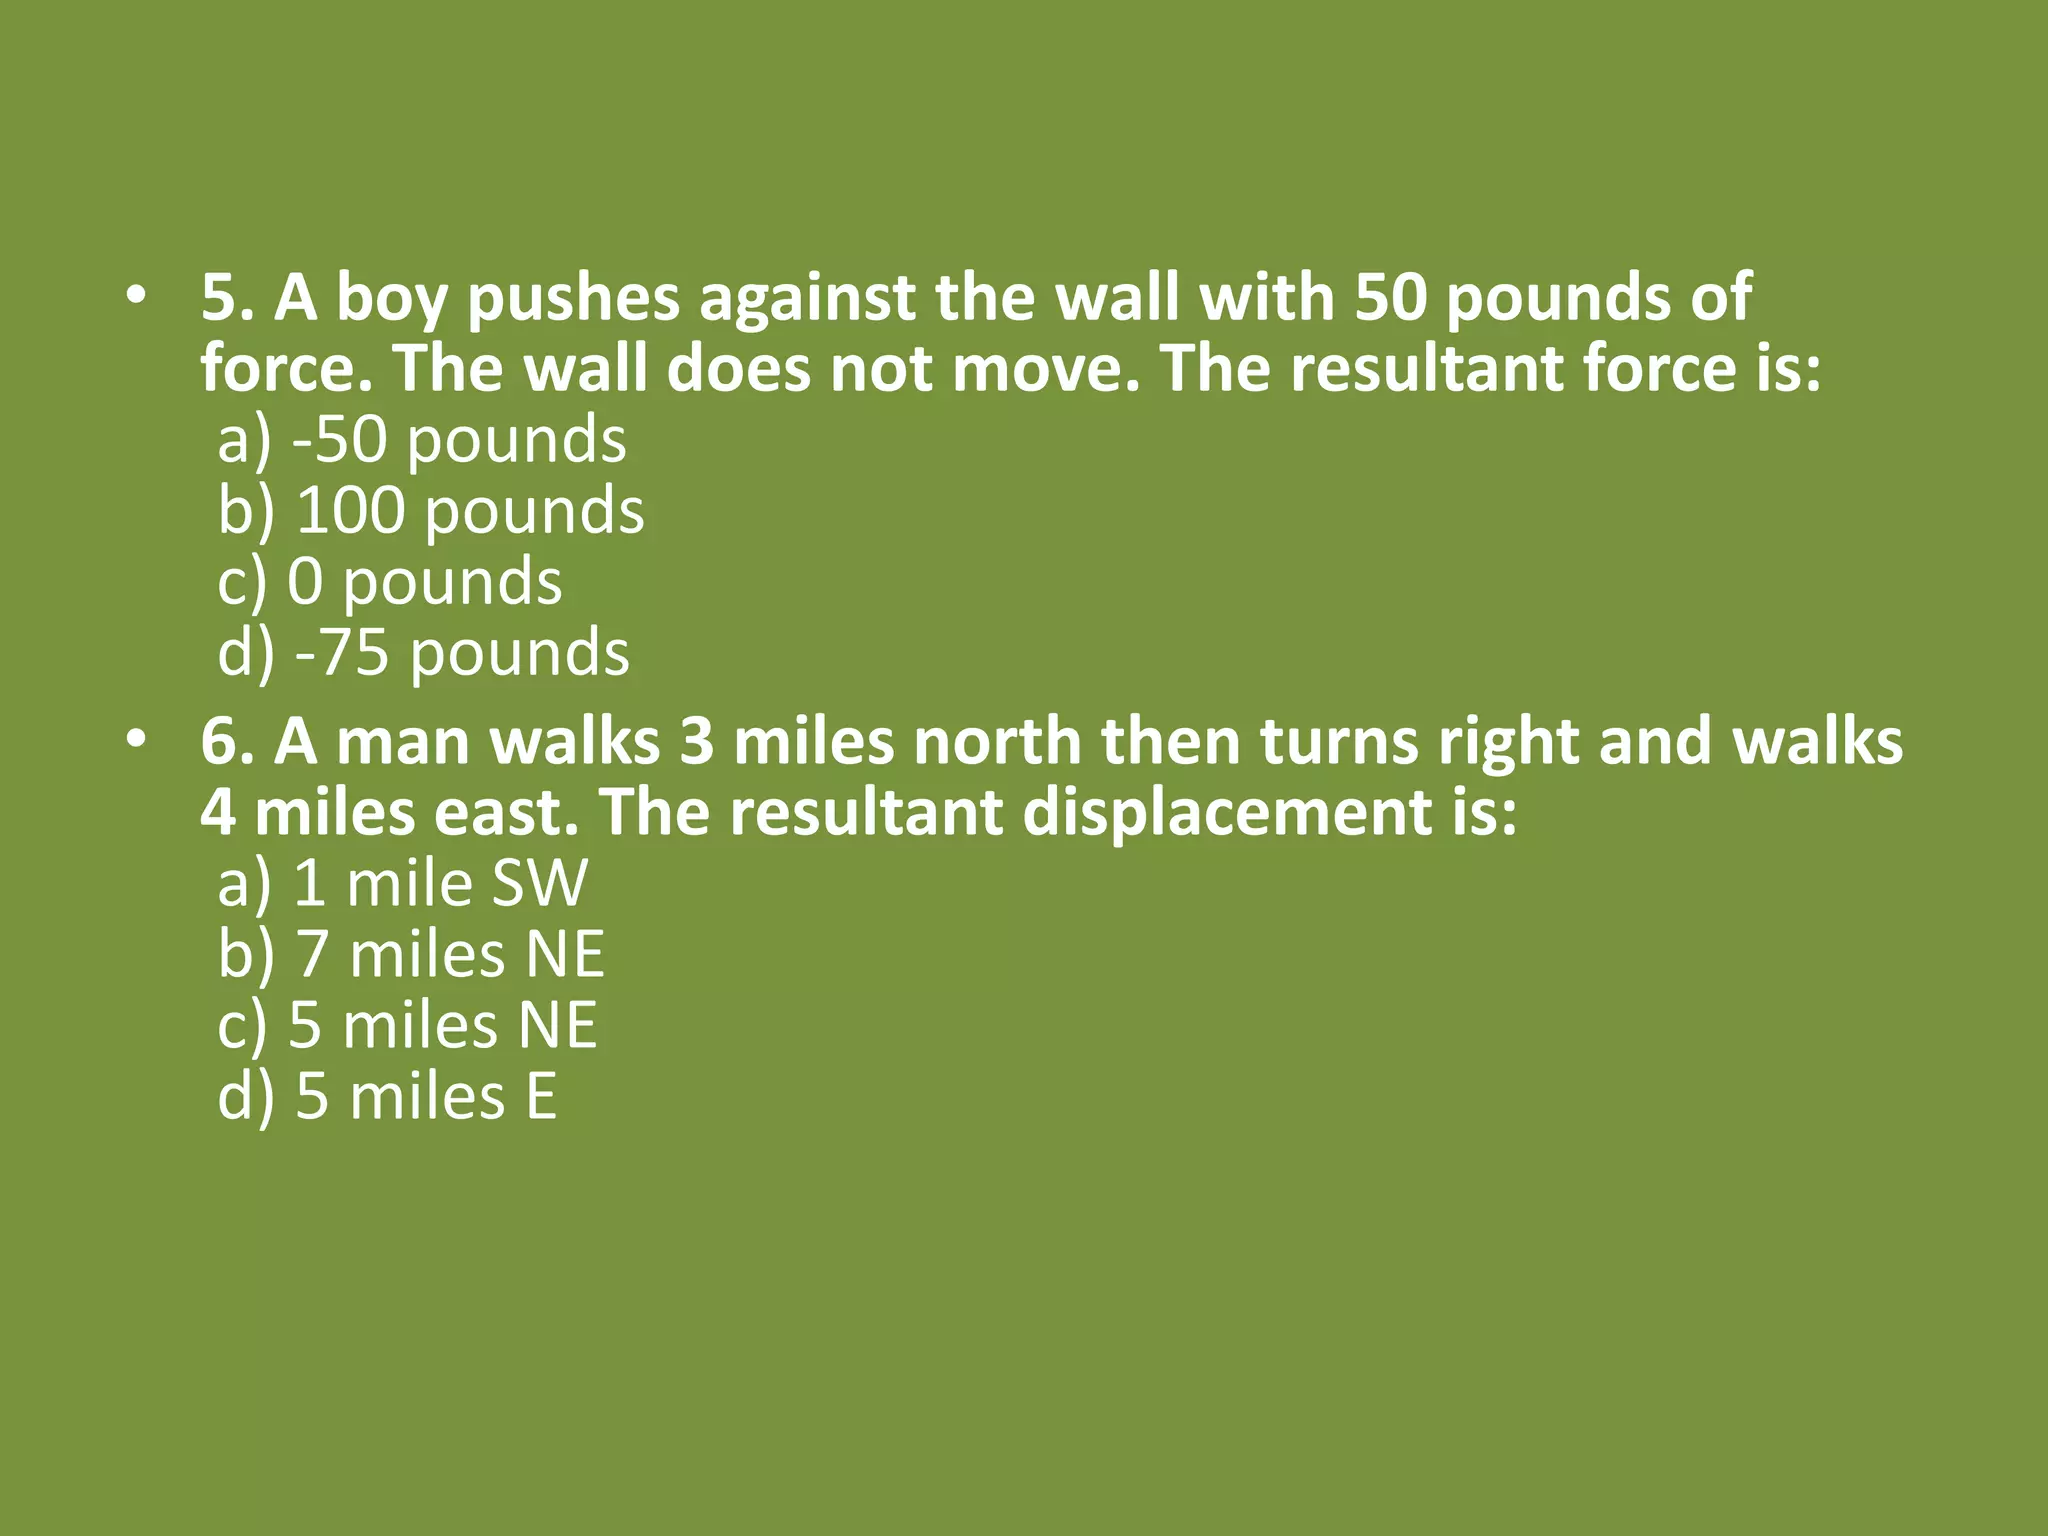
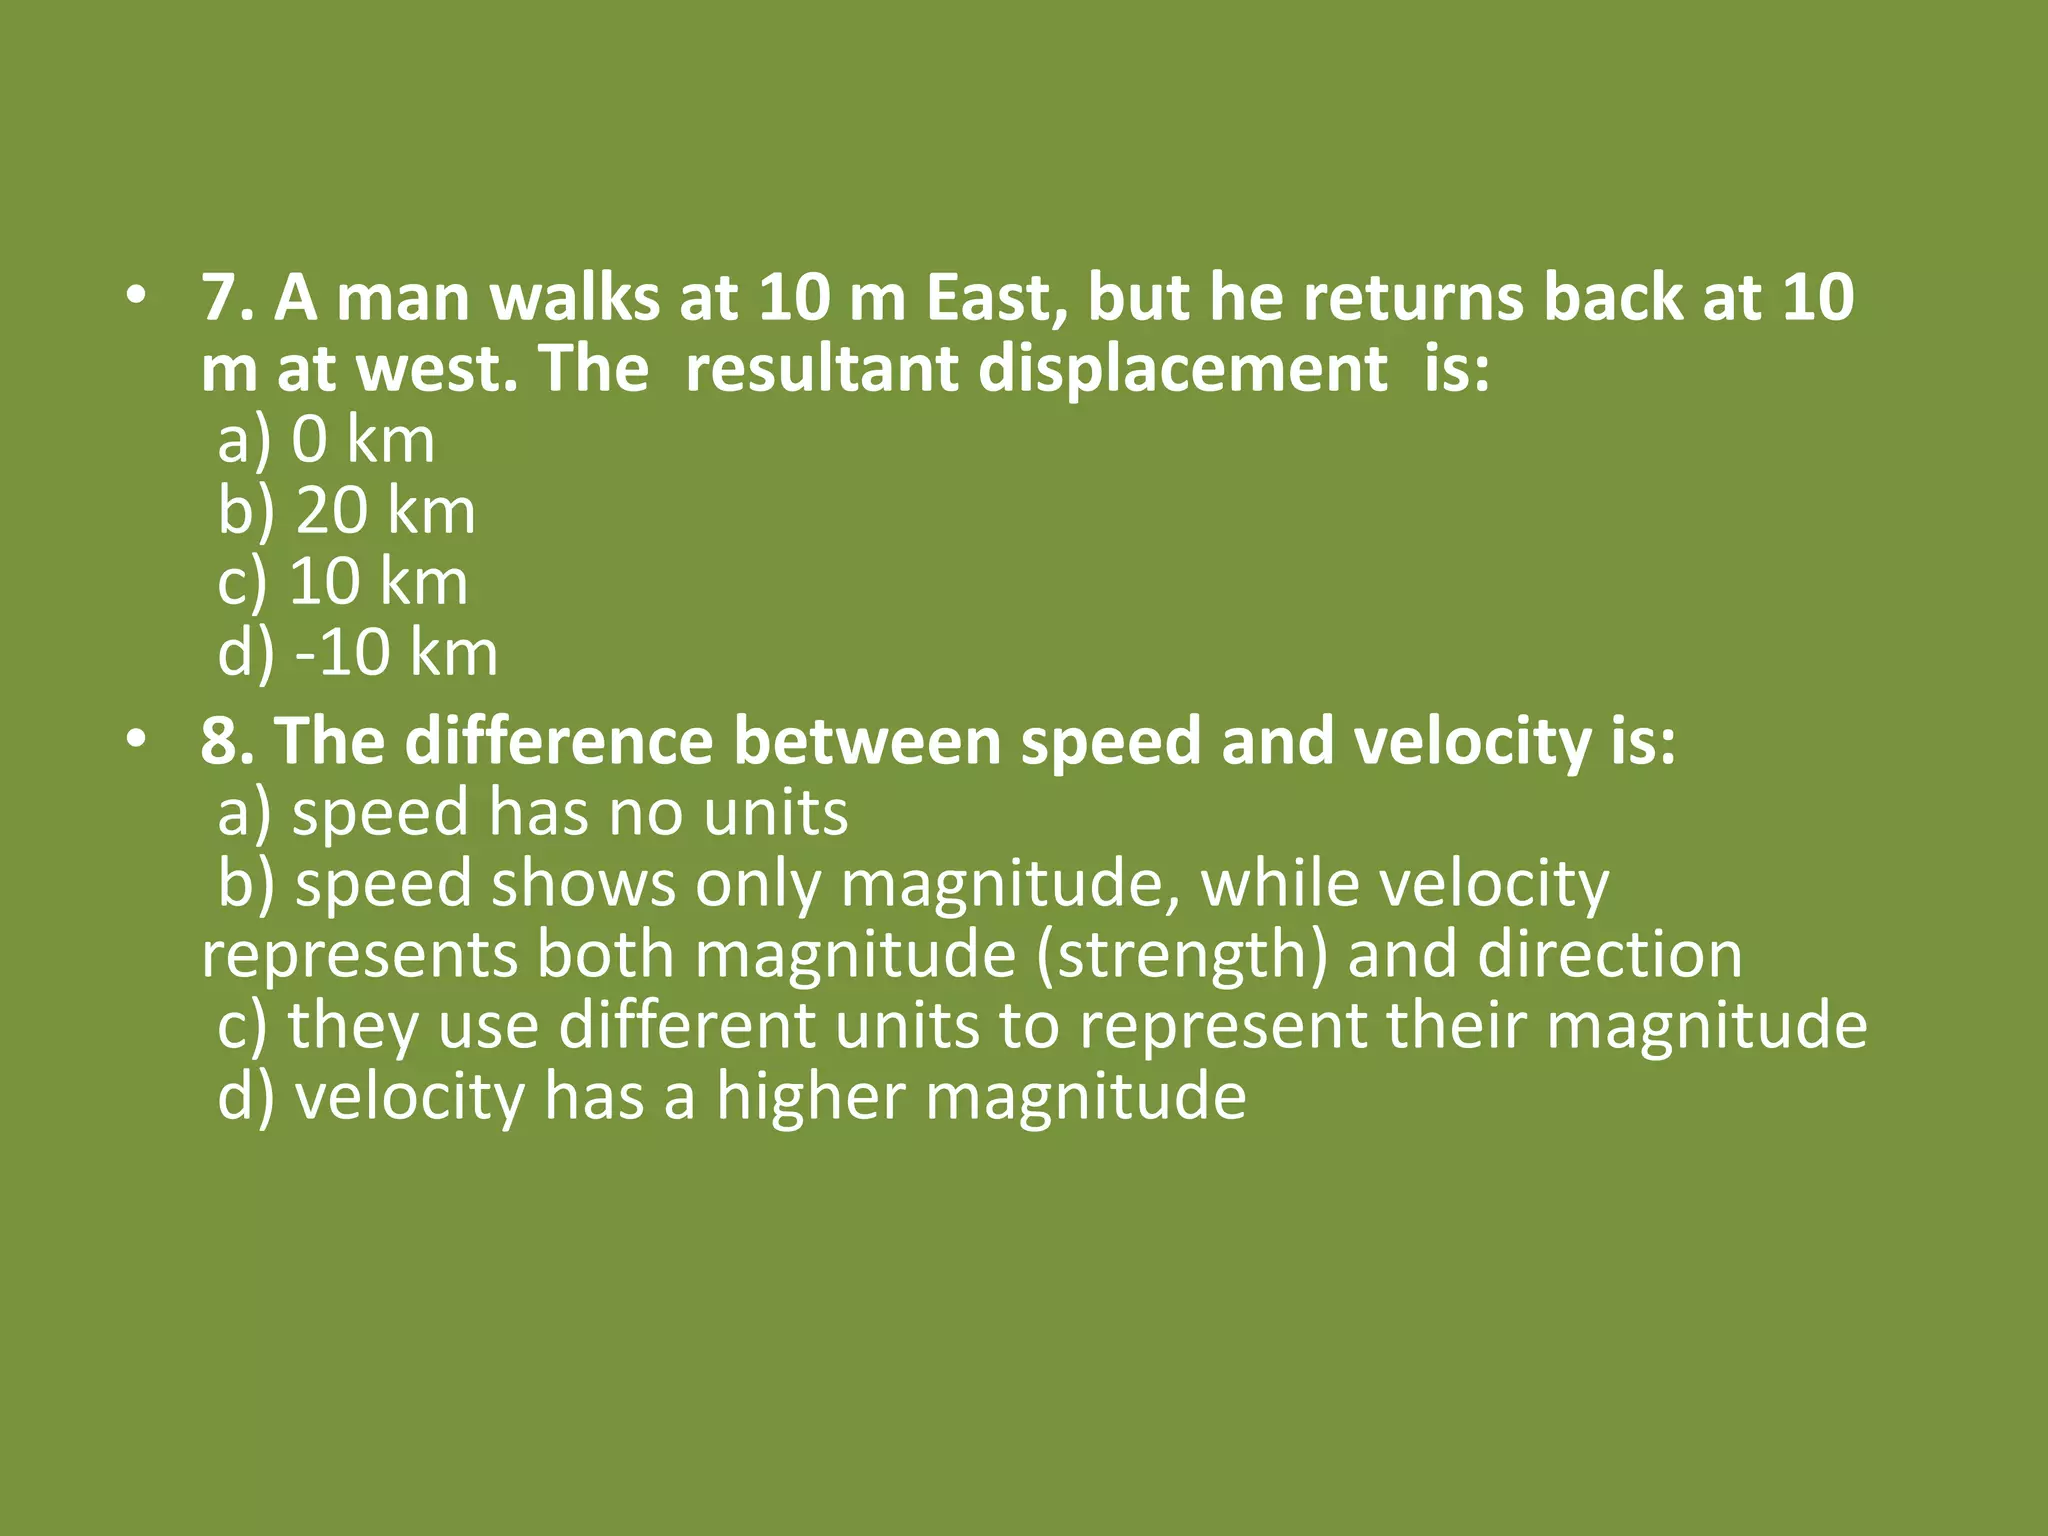
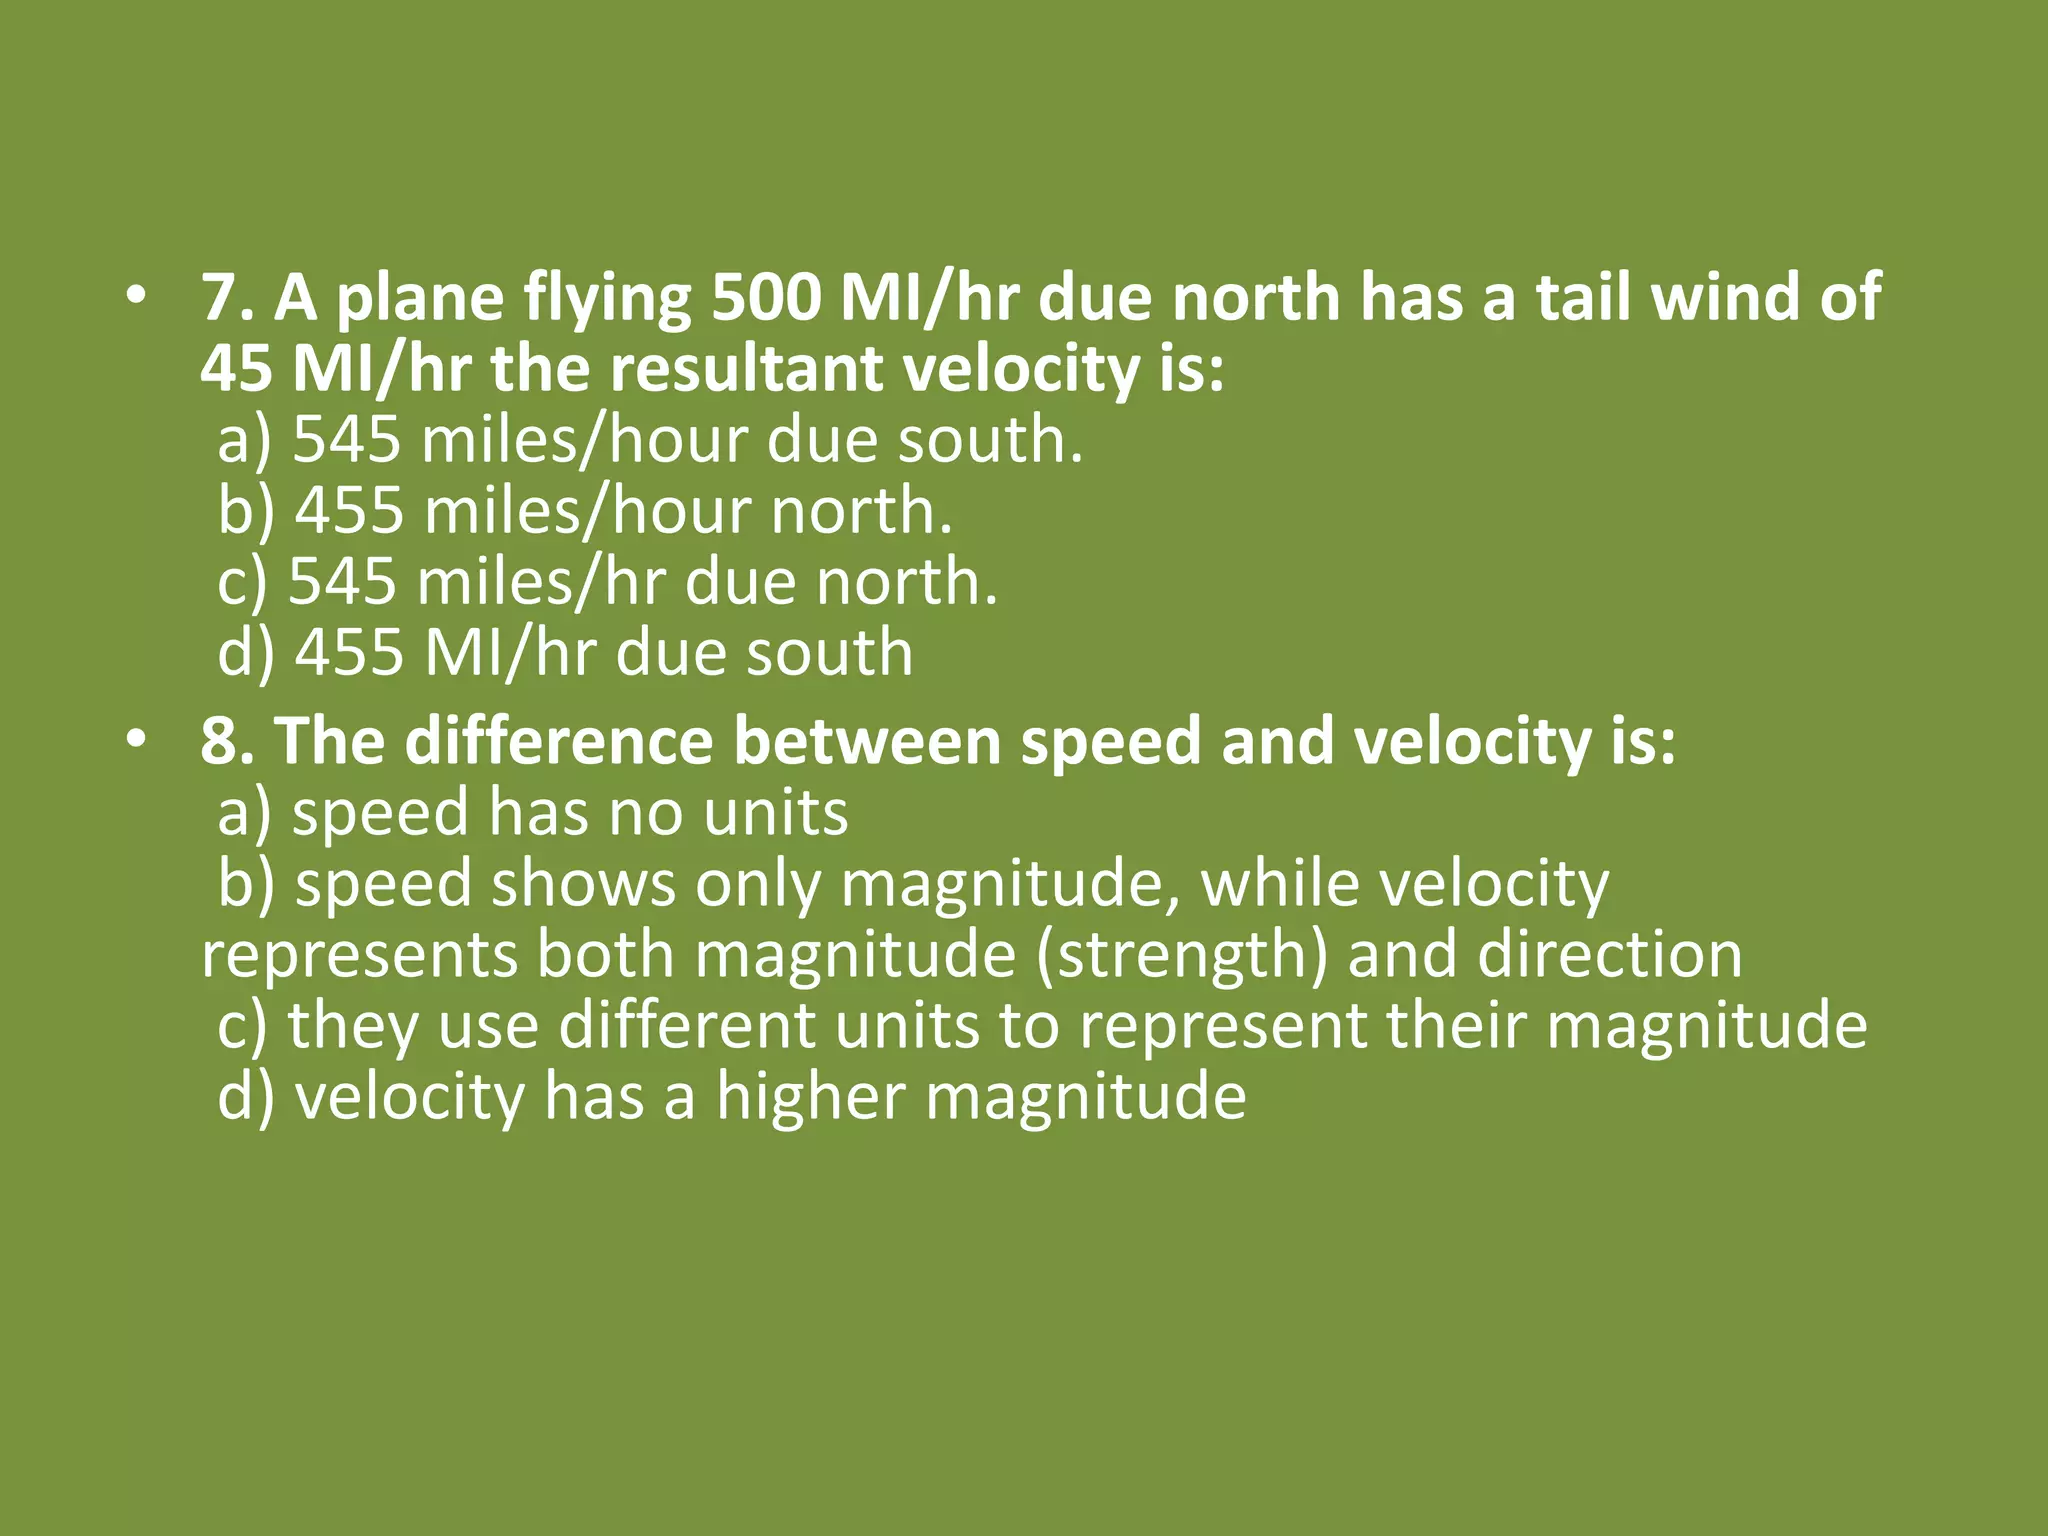
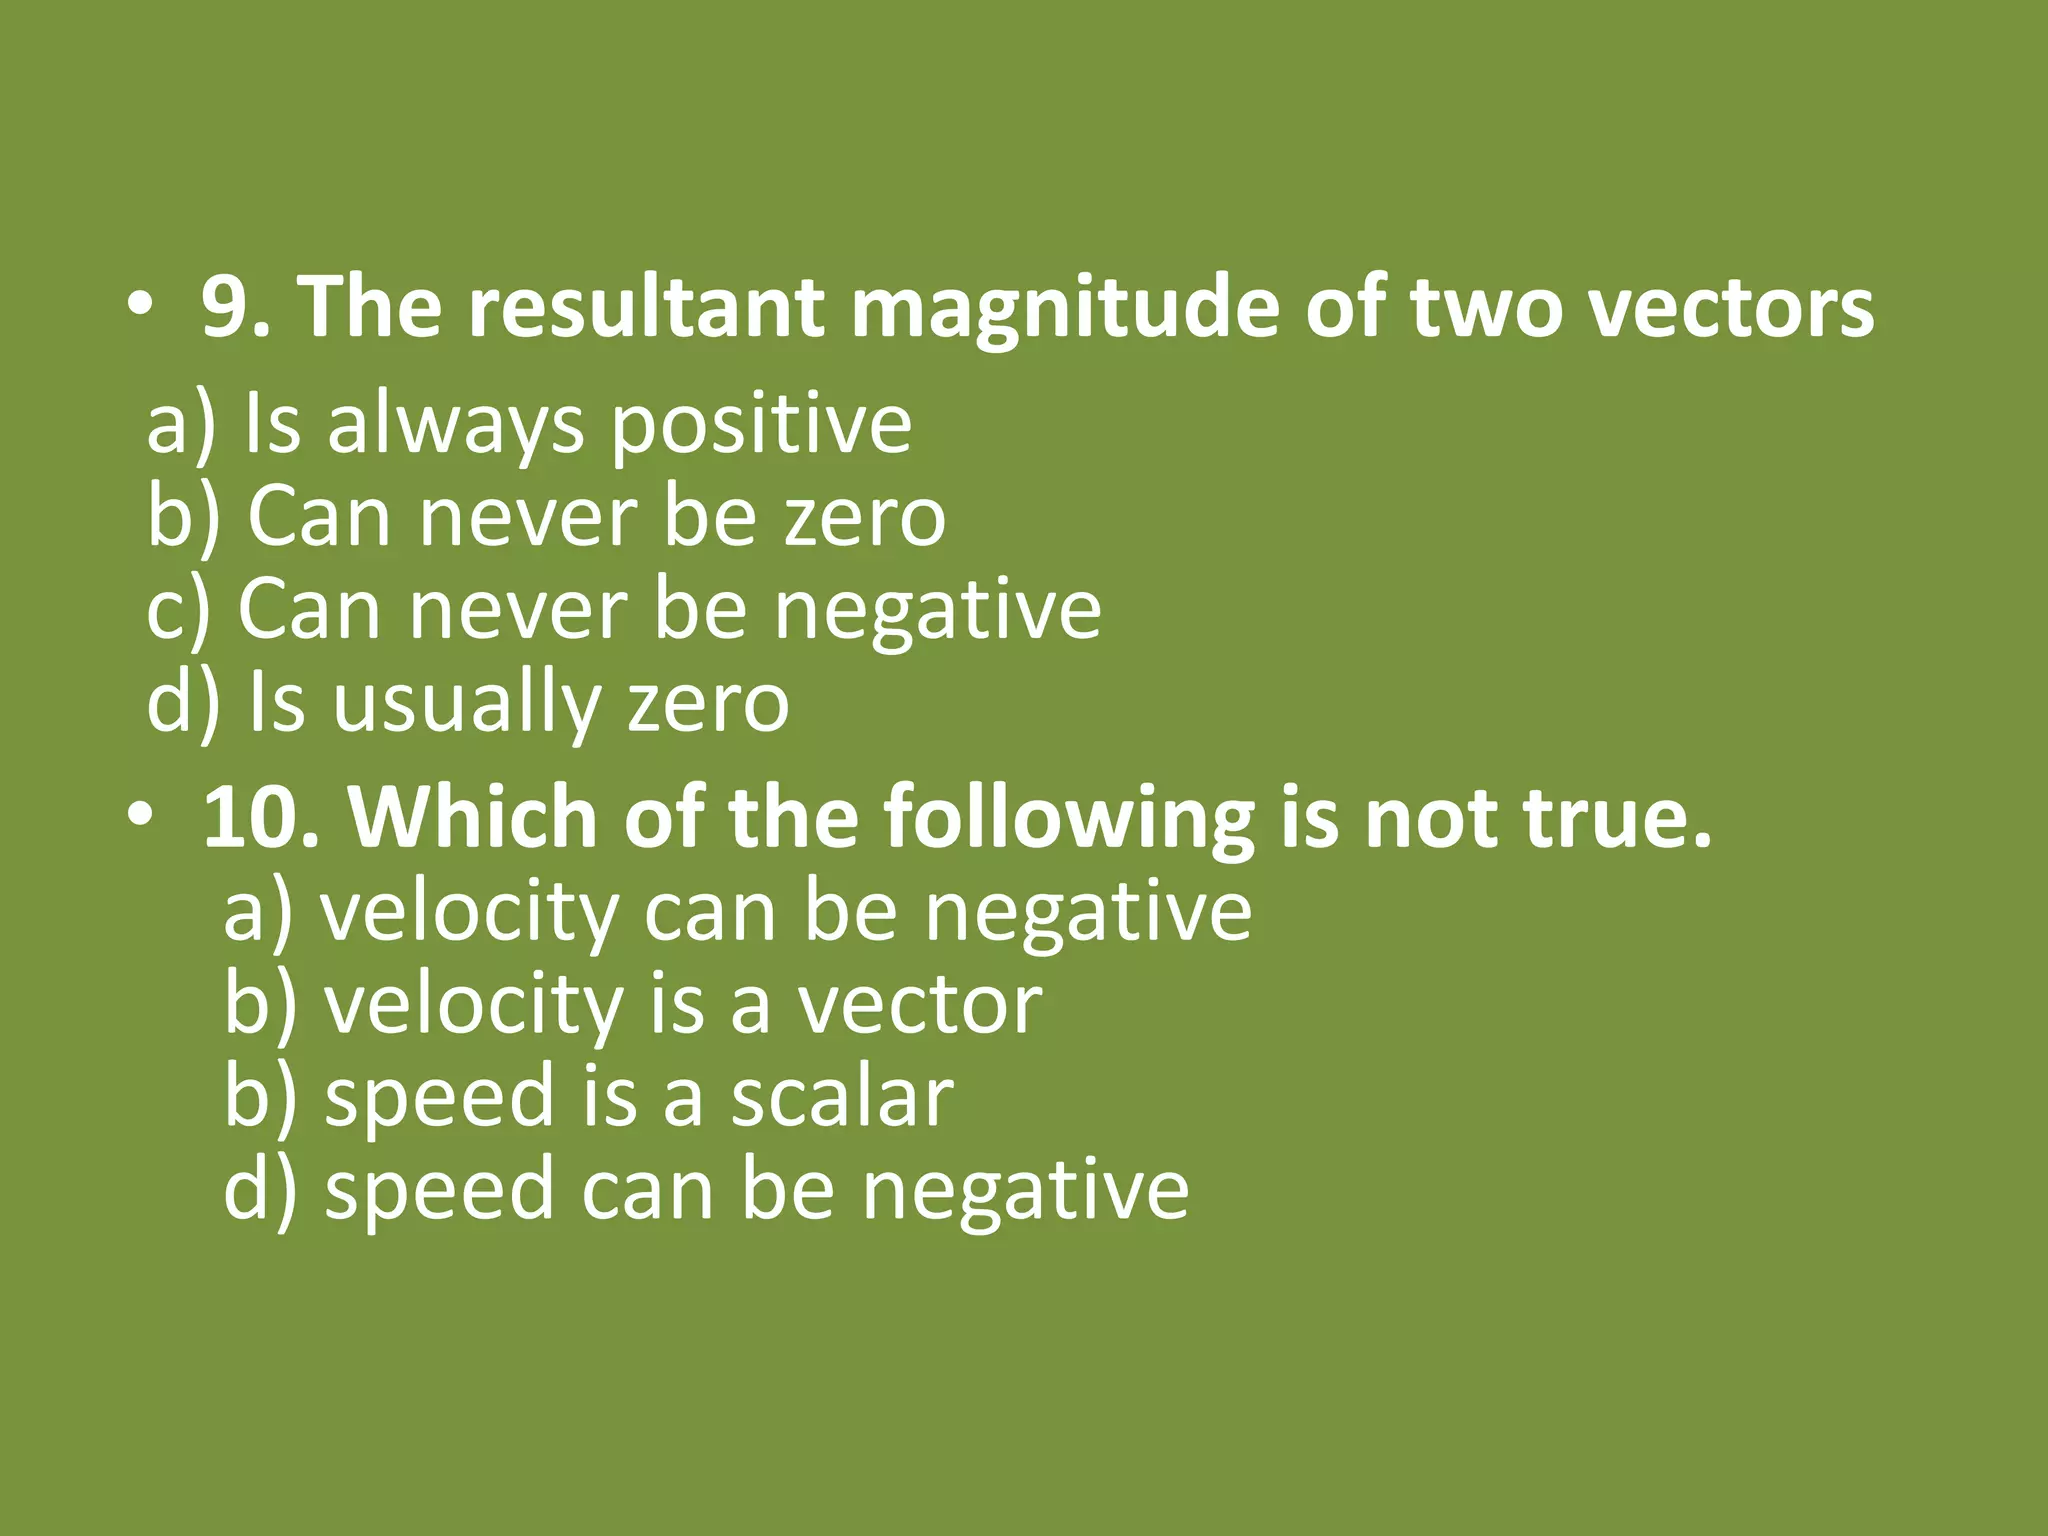
Quiz questions focusing on identifying scalar and vector quantities and their properties.
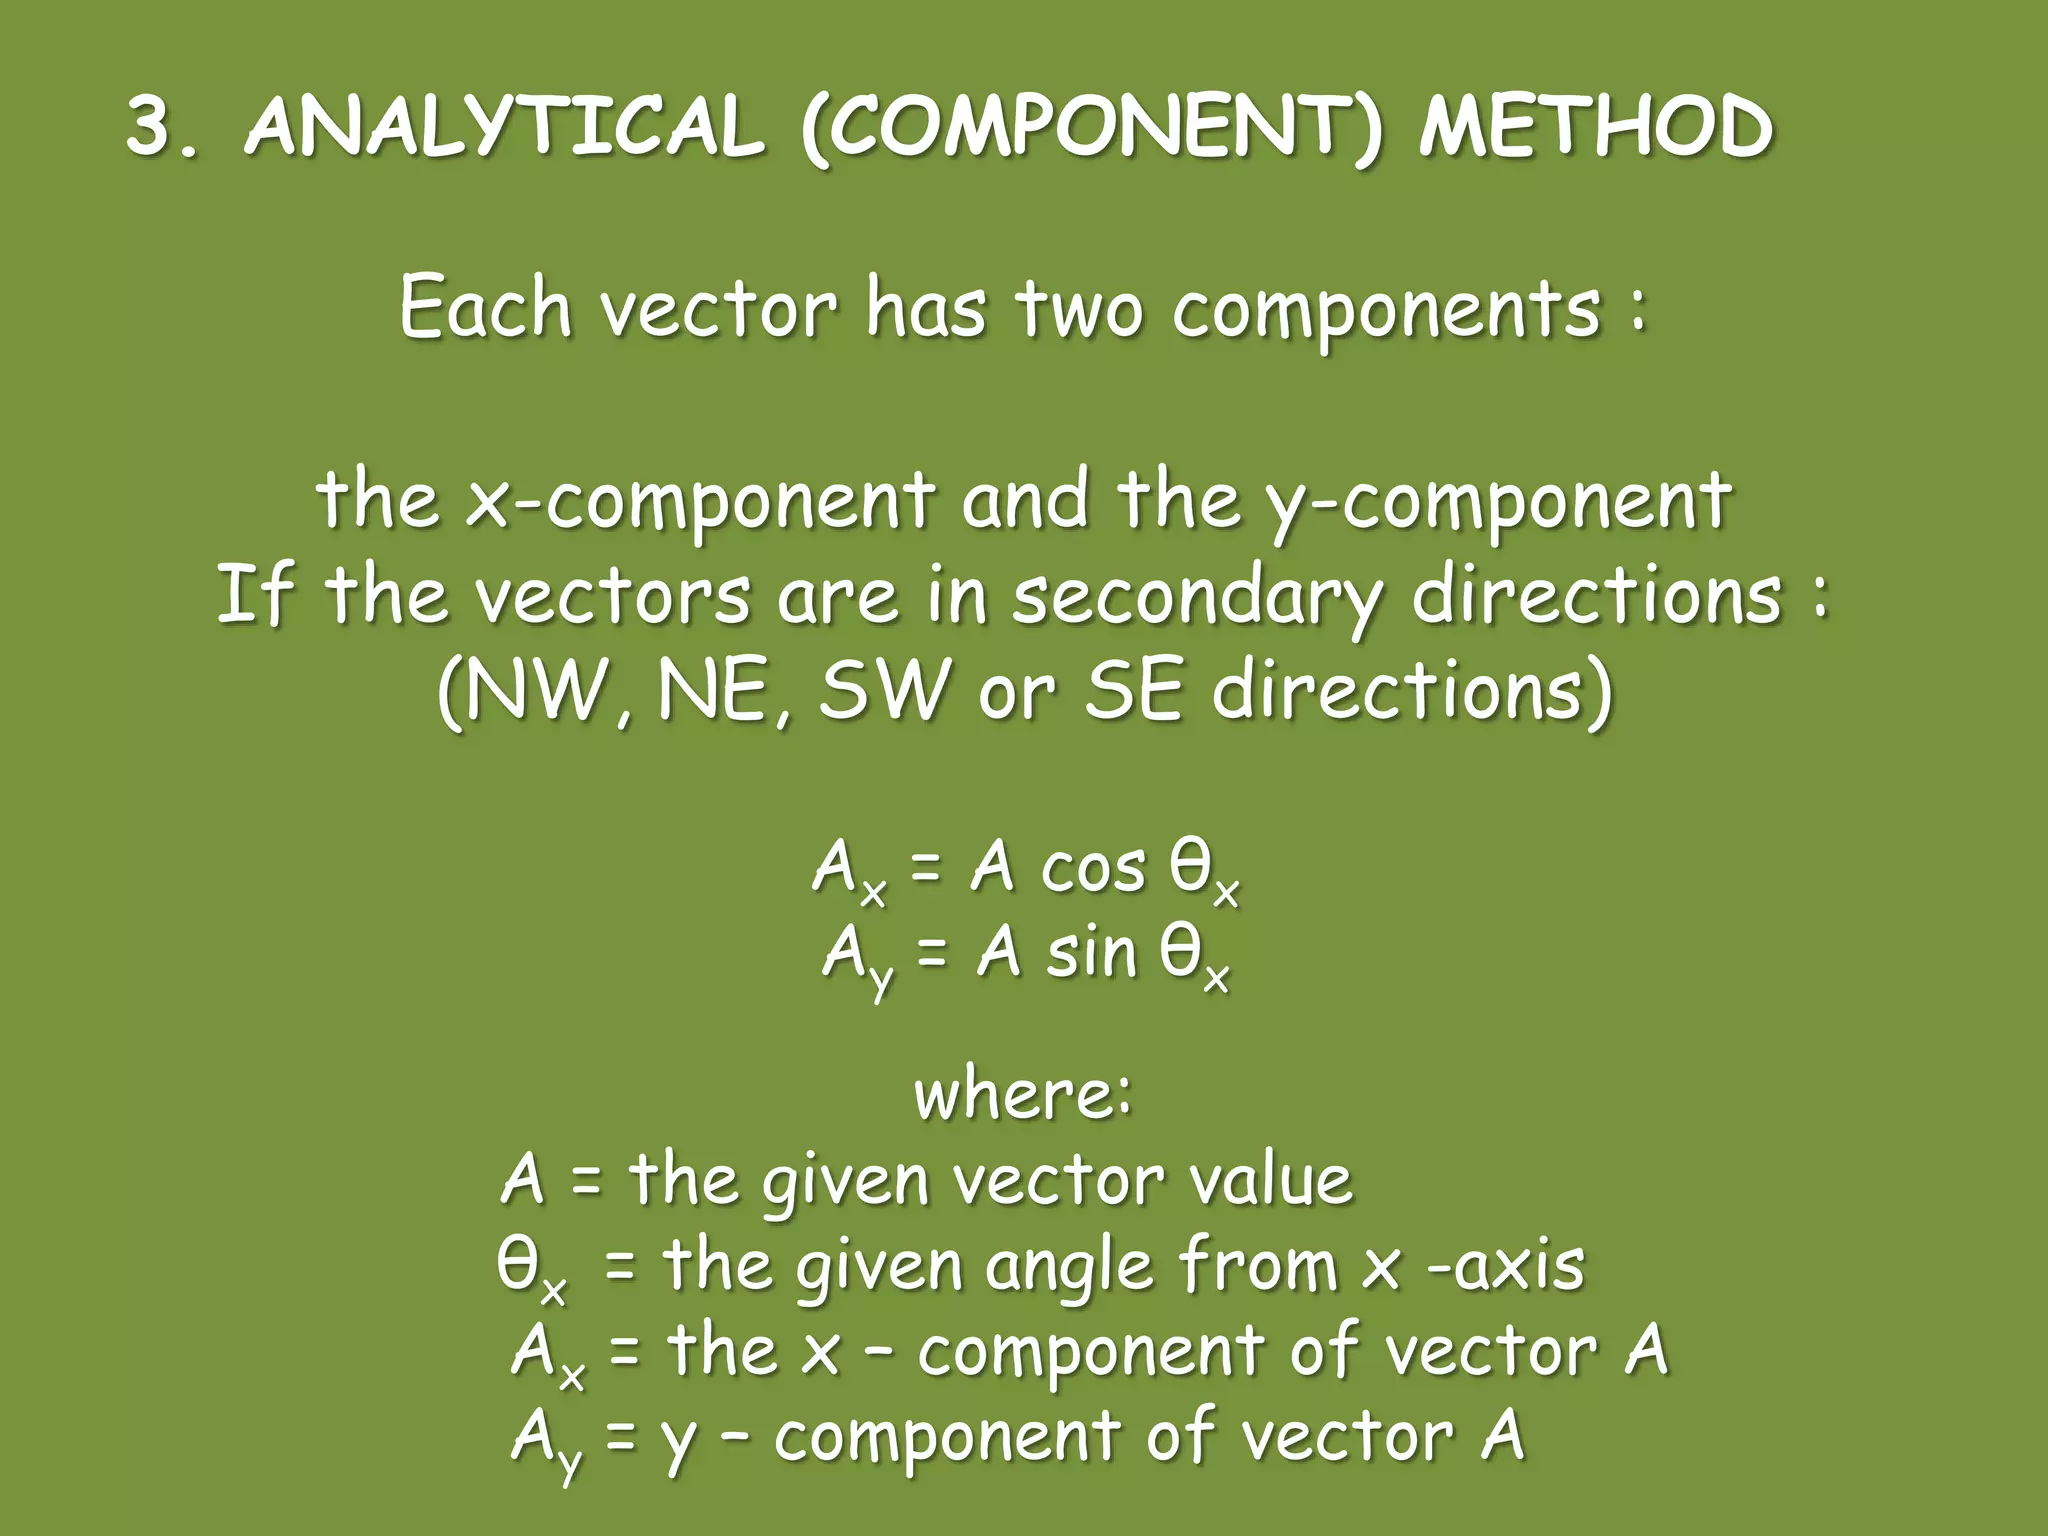
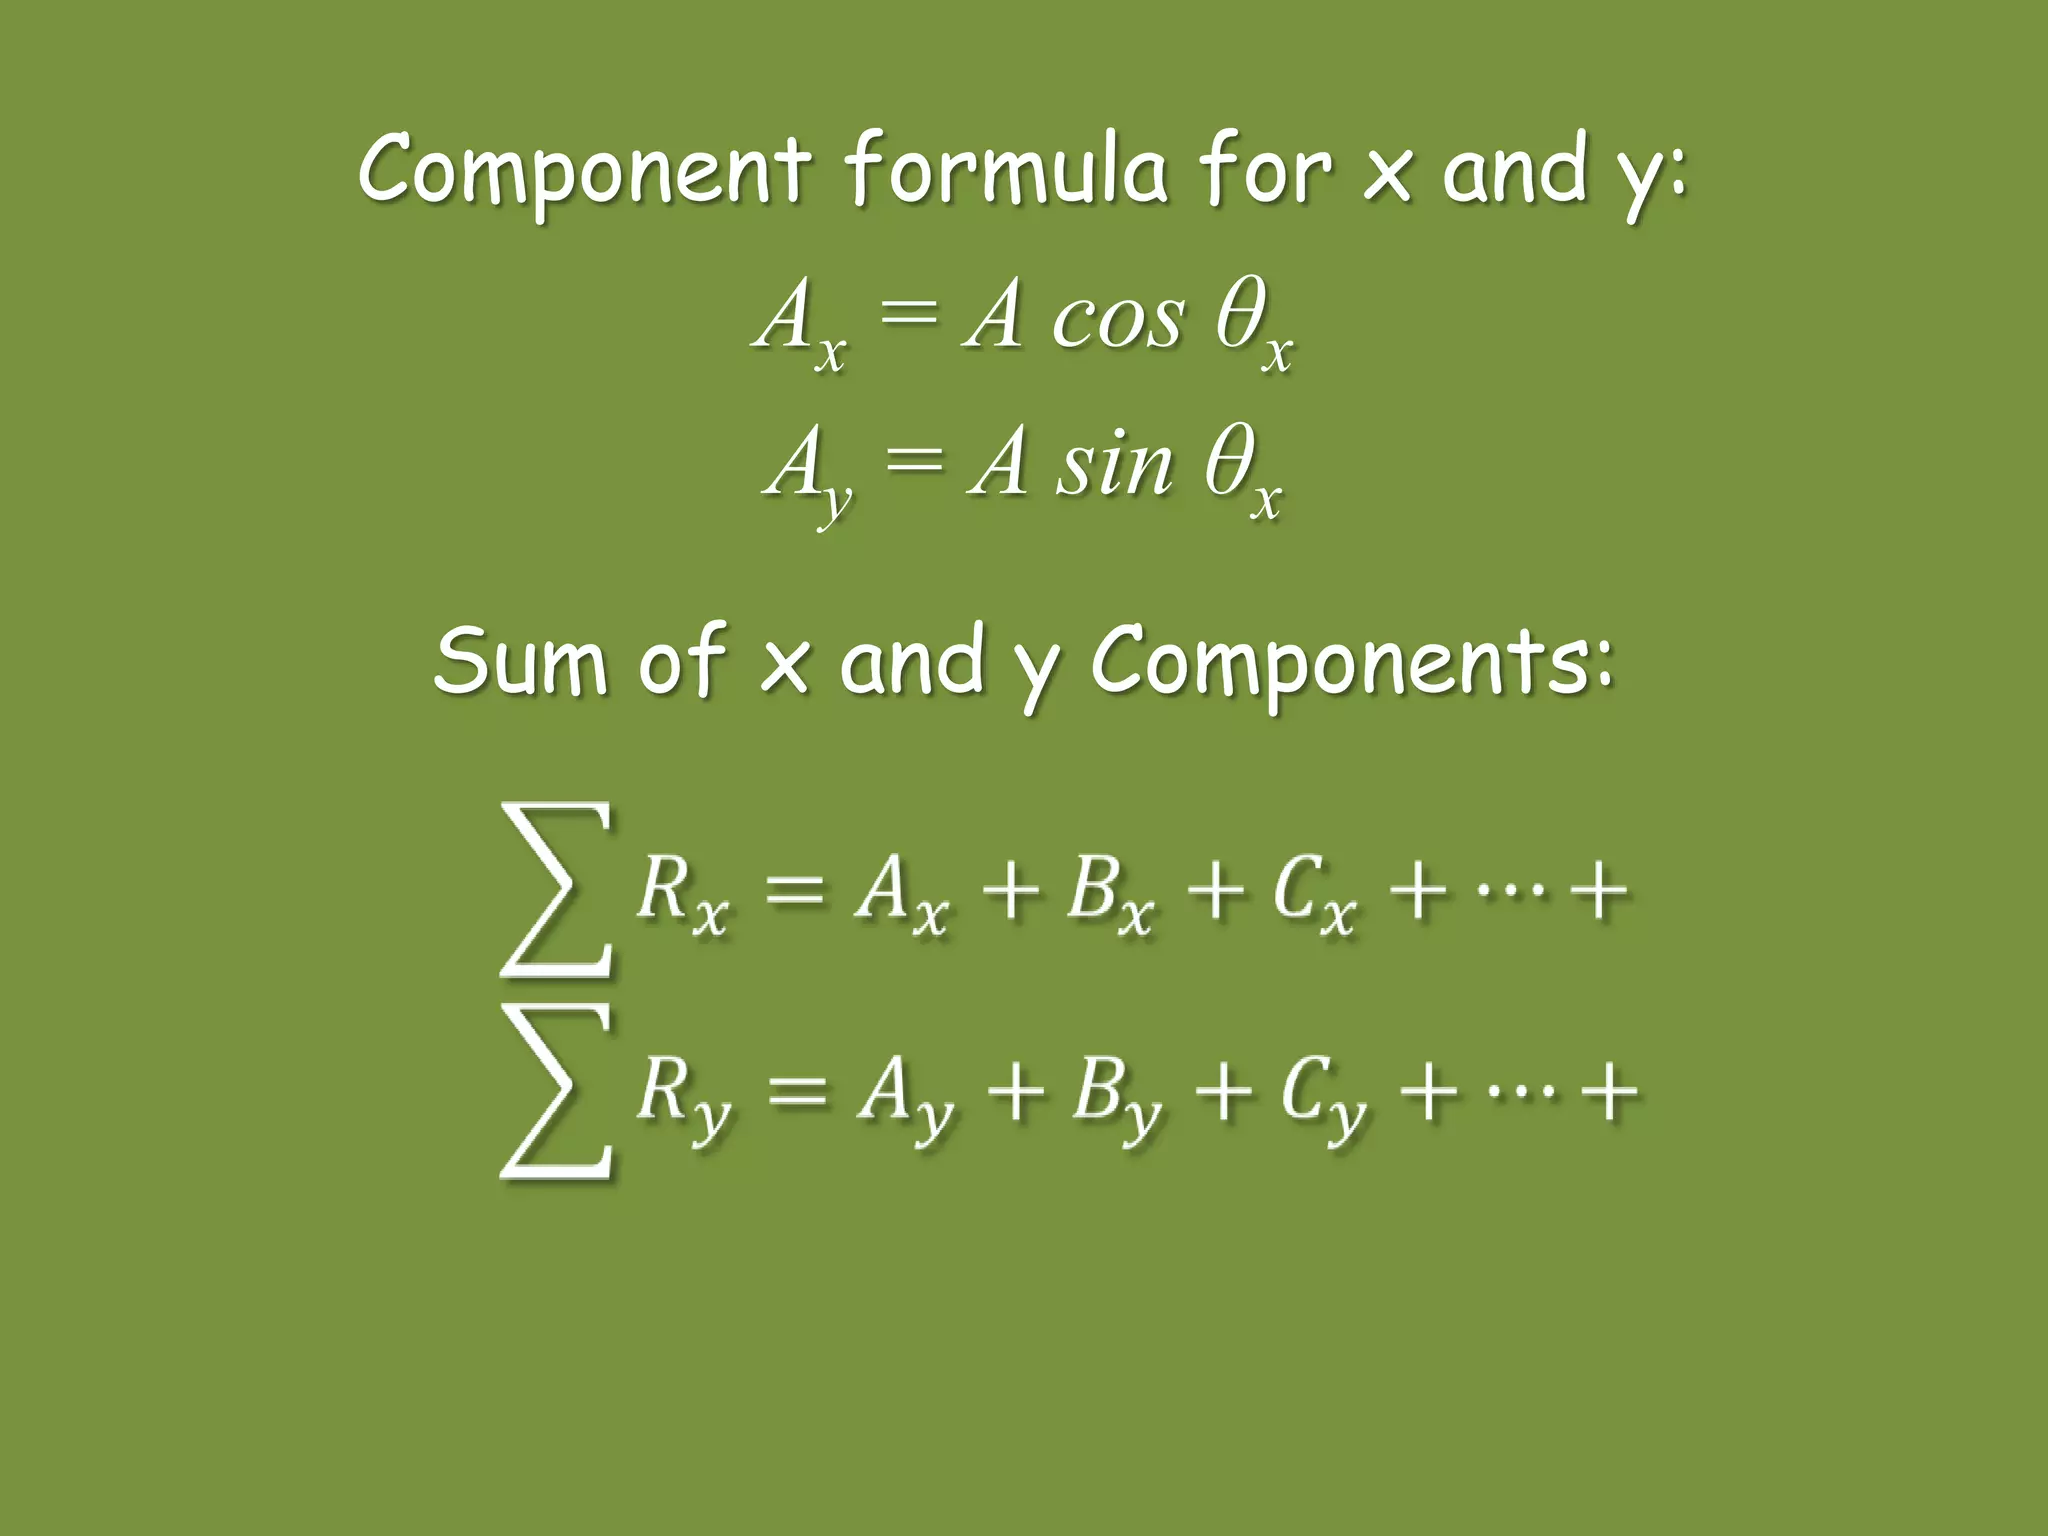
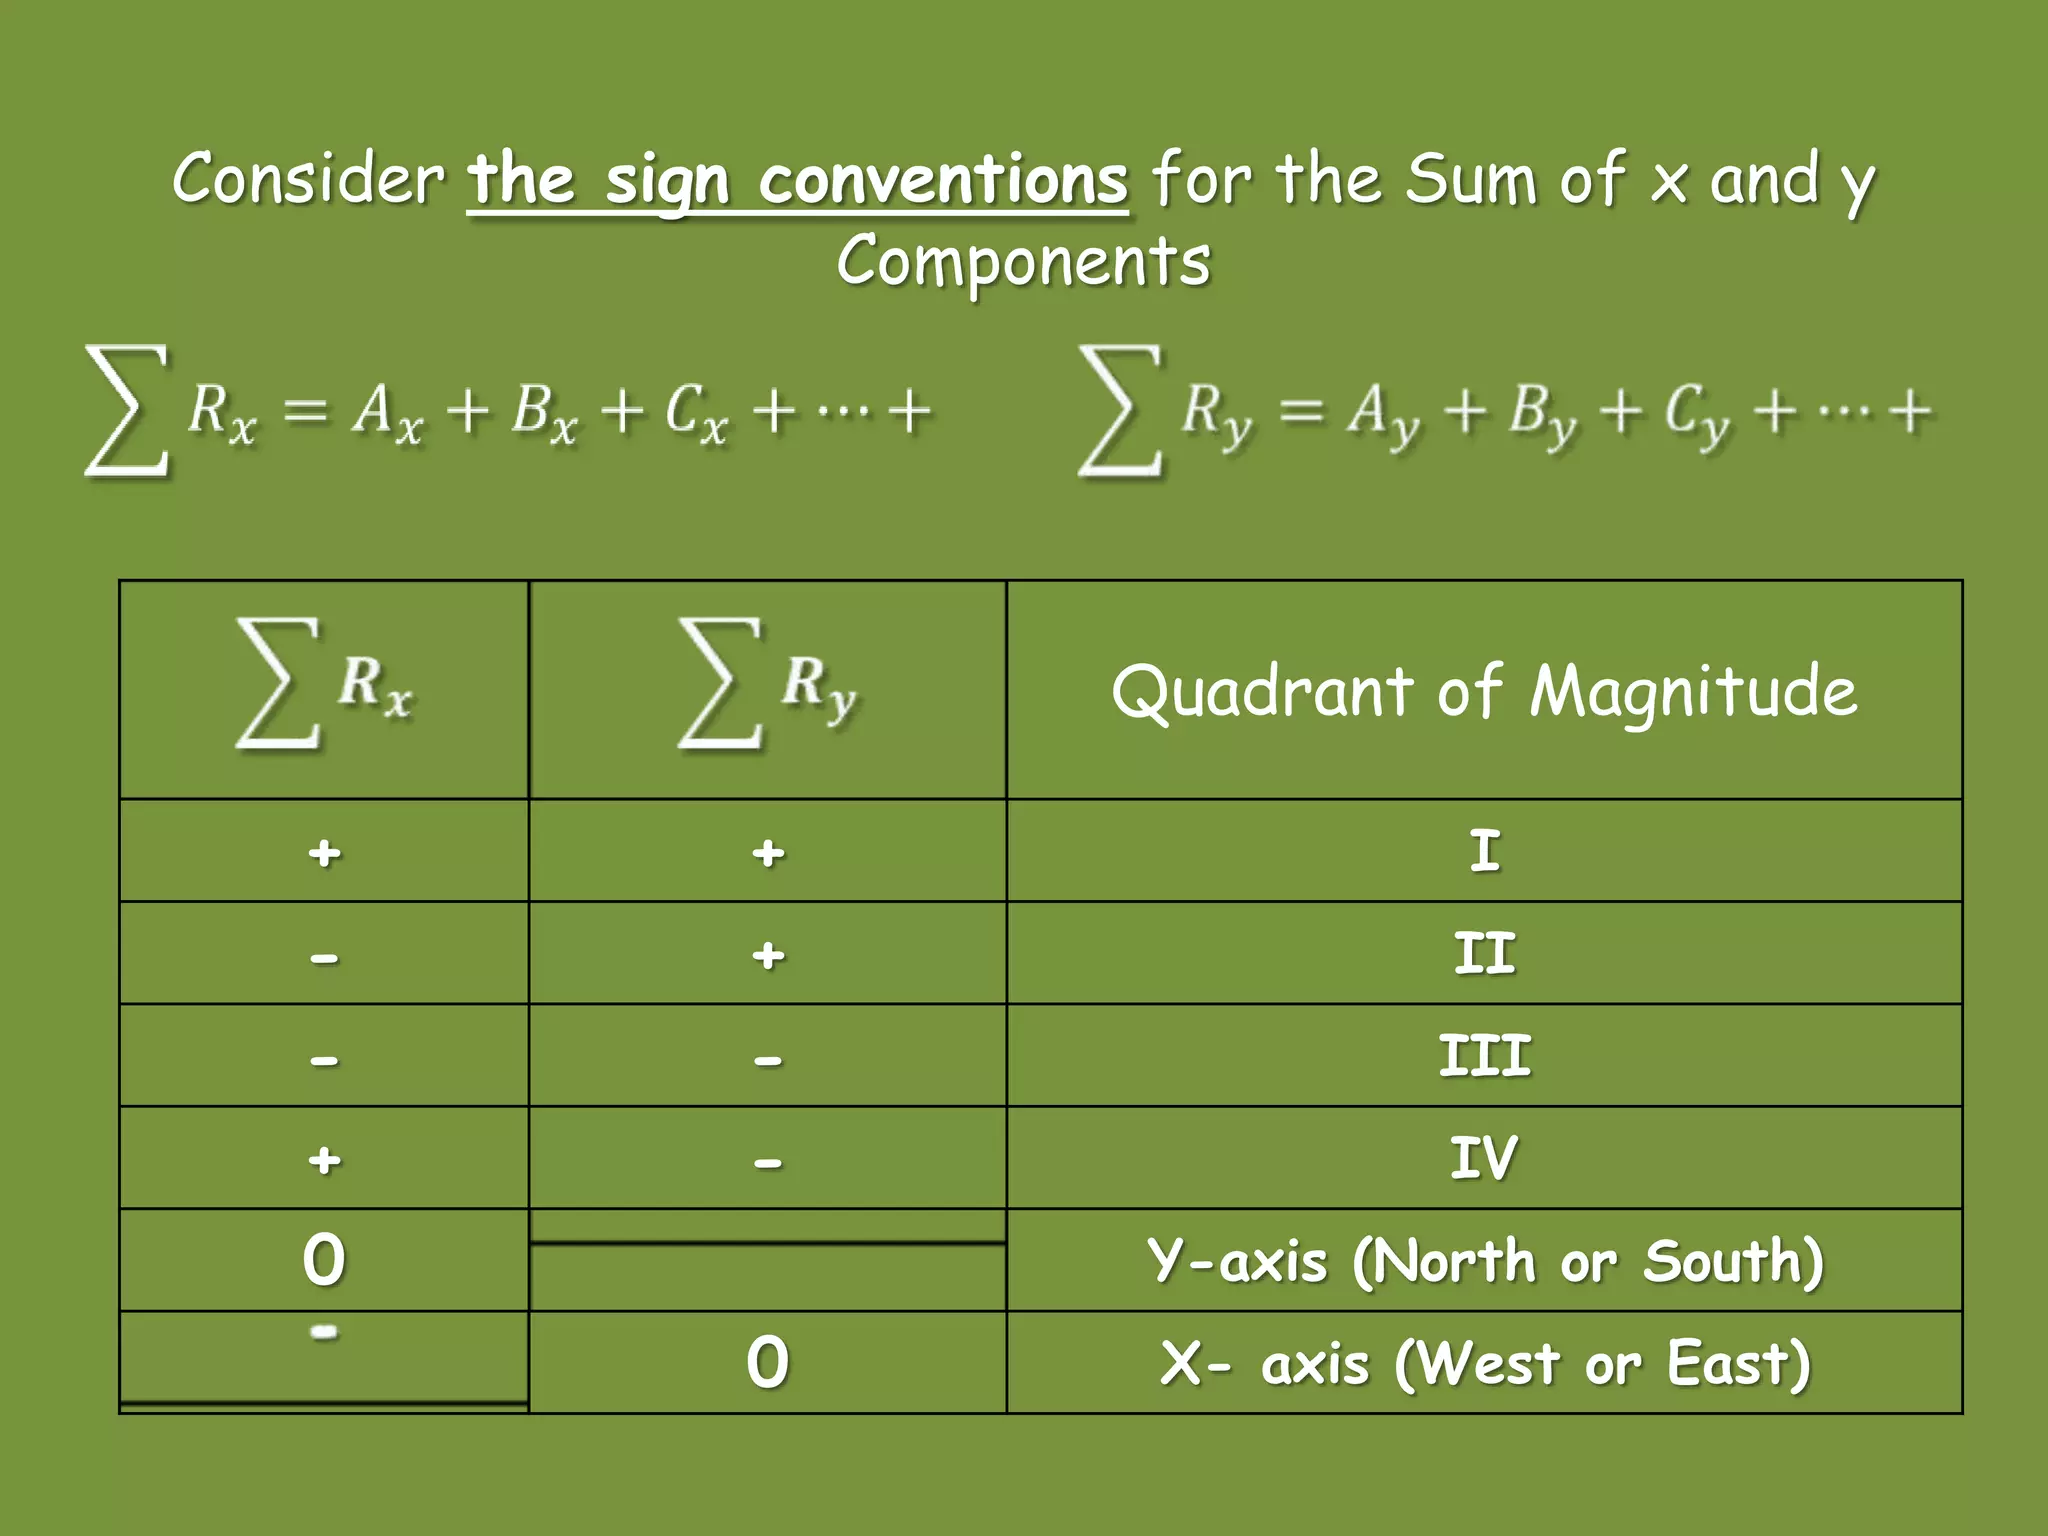
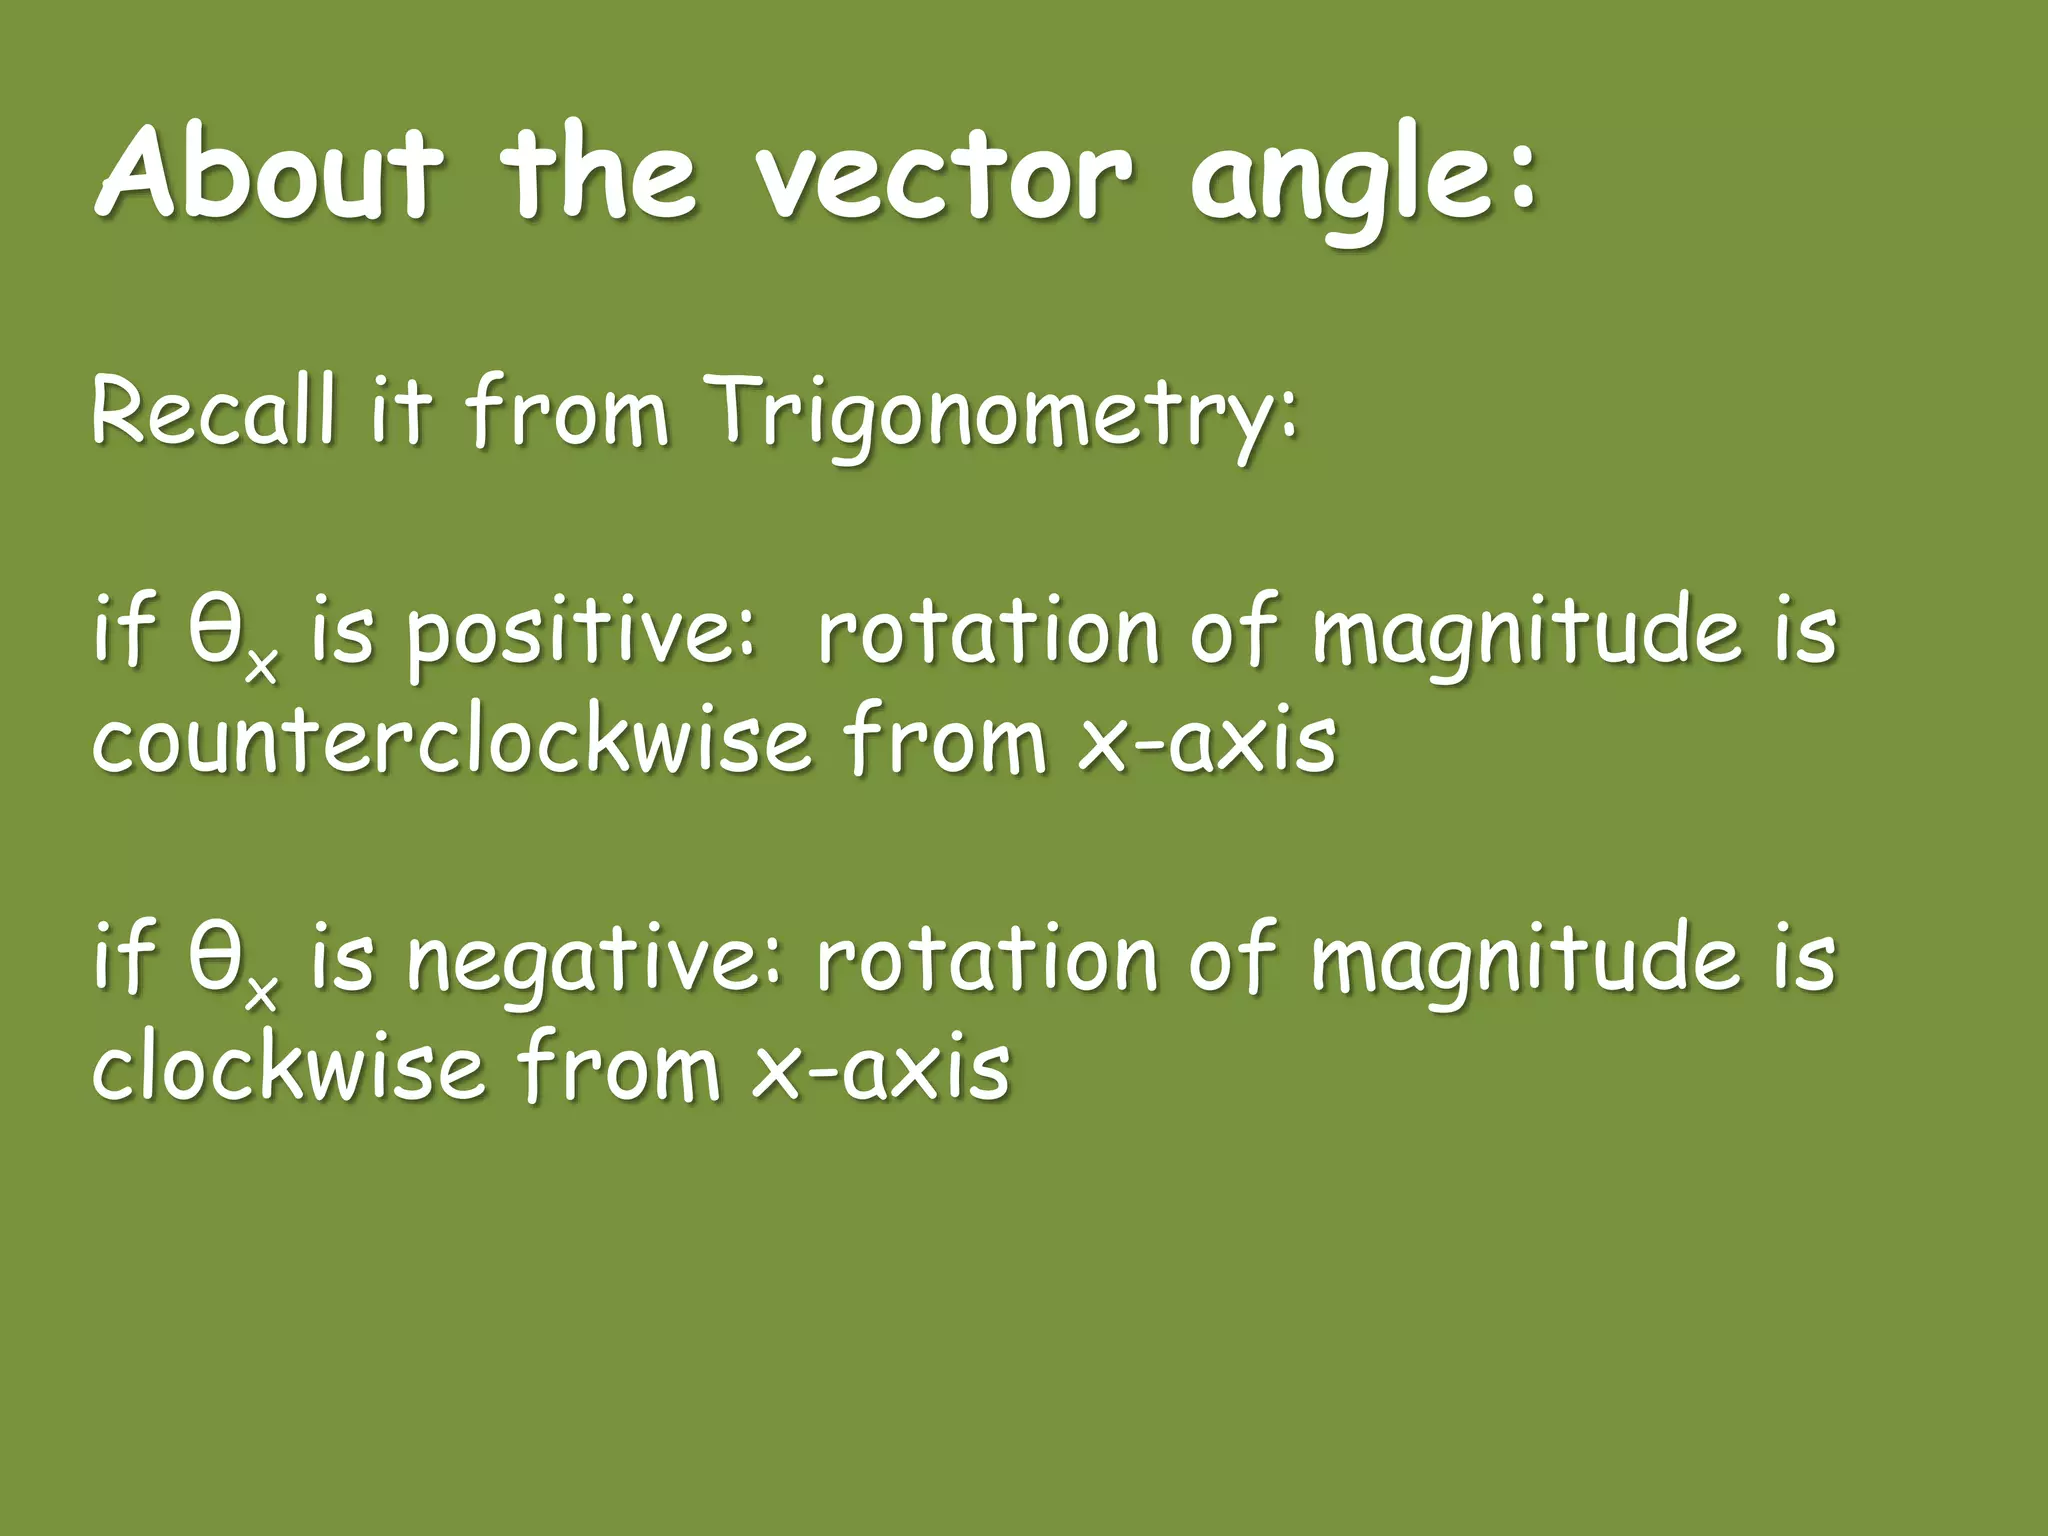
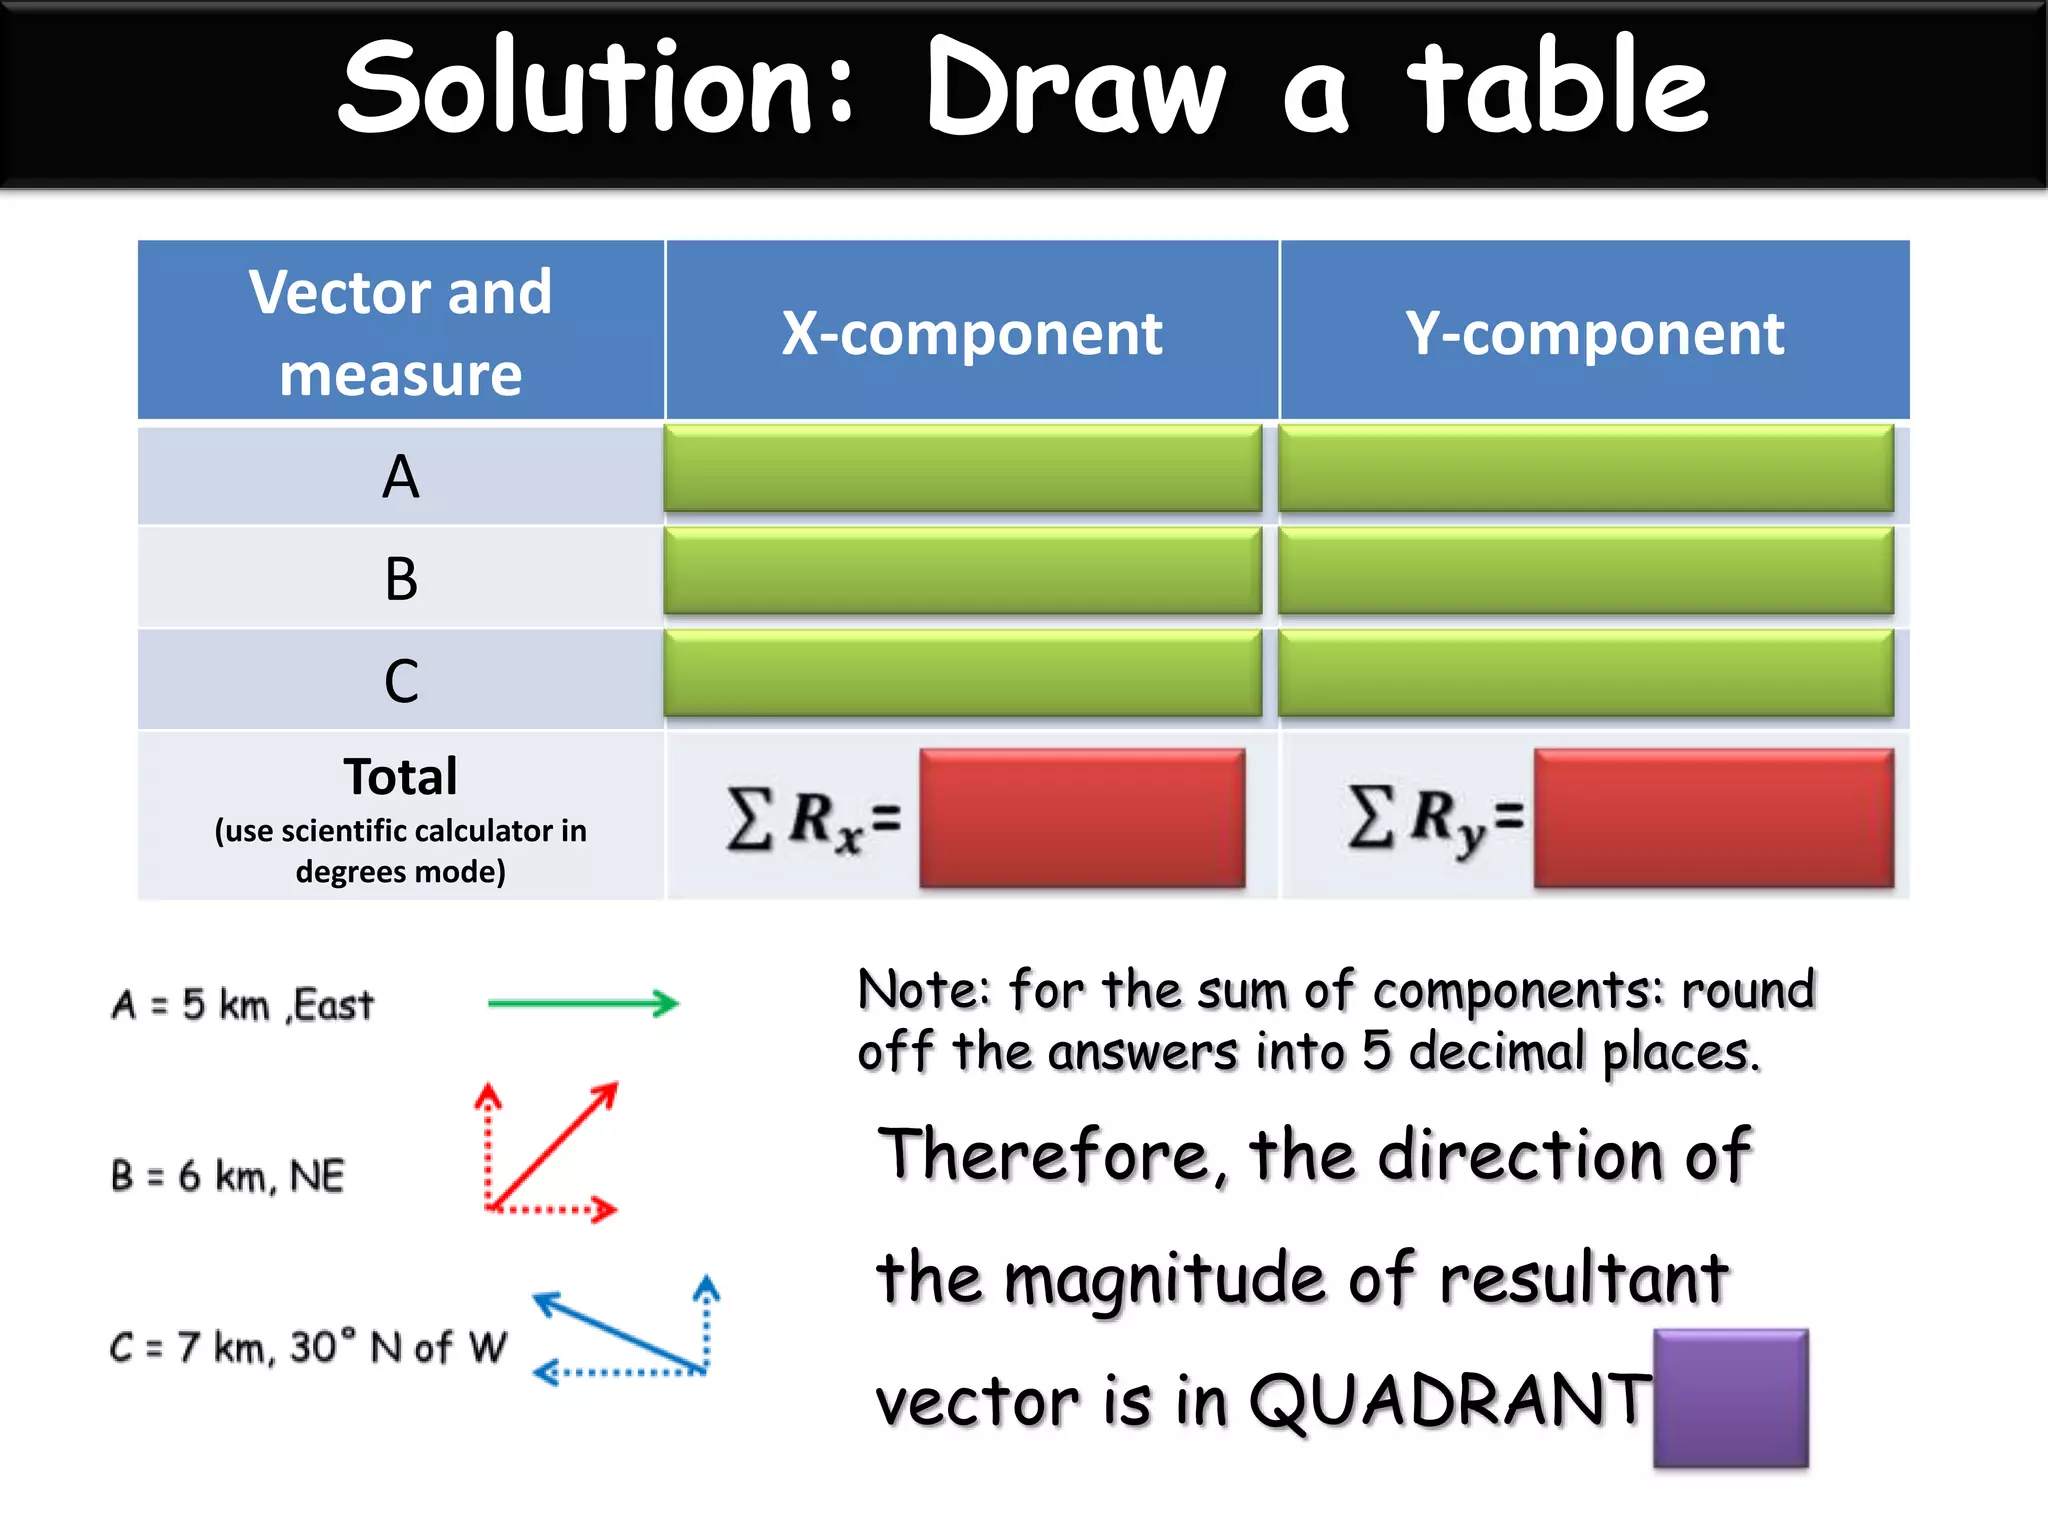
Detailed methods to calculate components of vectors, integrating trigonometric concepts.
Detailed methods to calculate components of vectors, integrating trigonometric concepts.
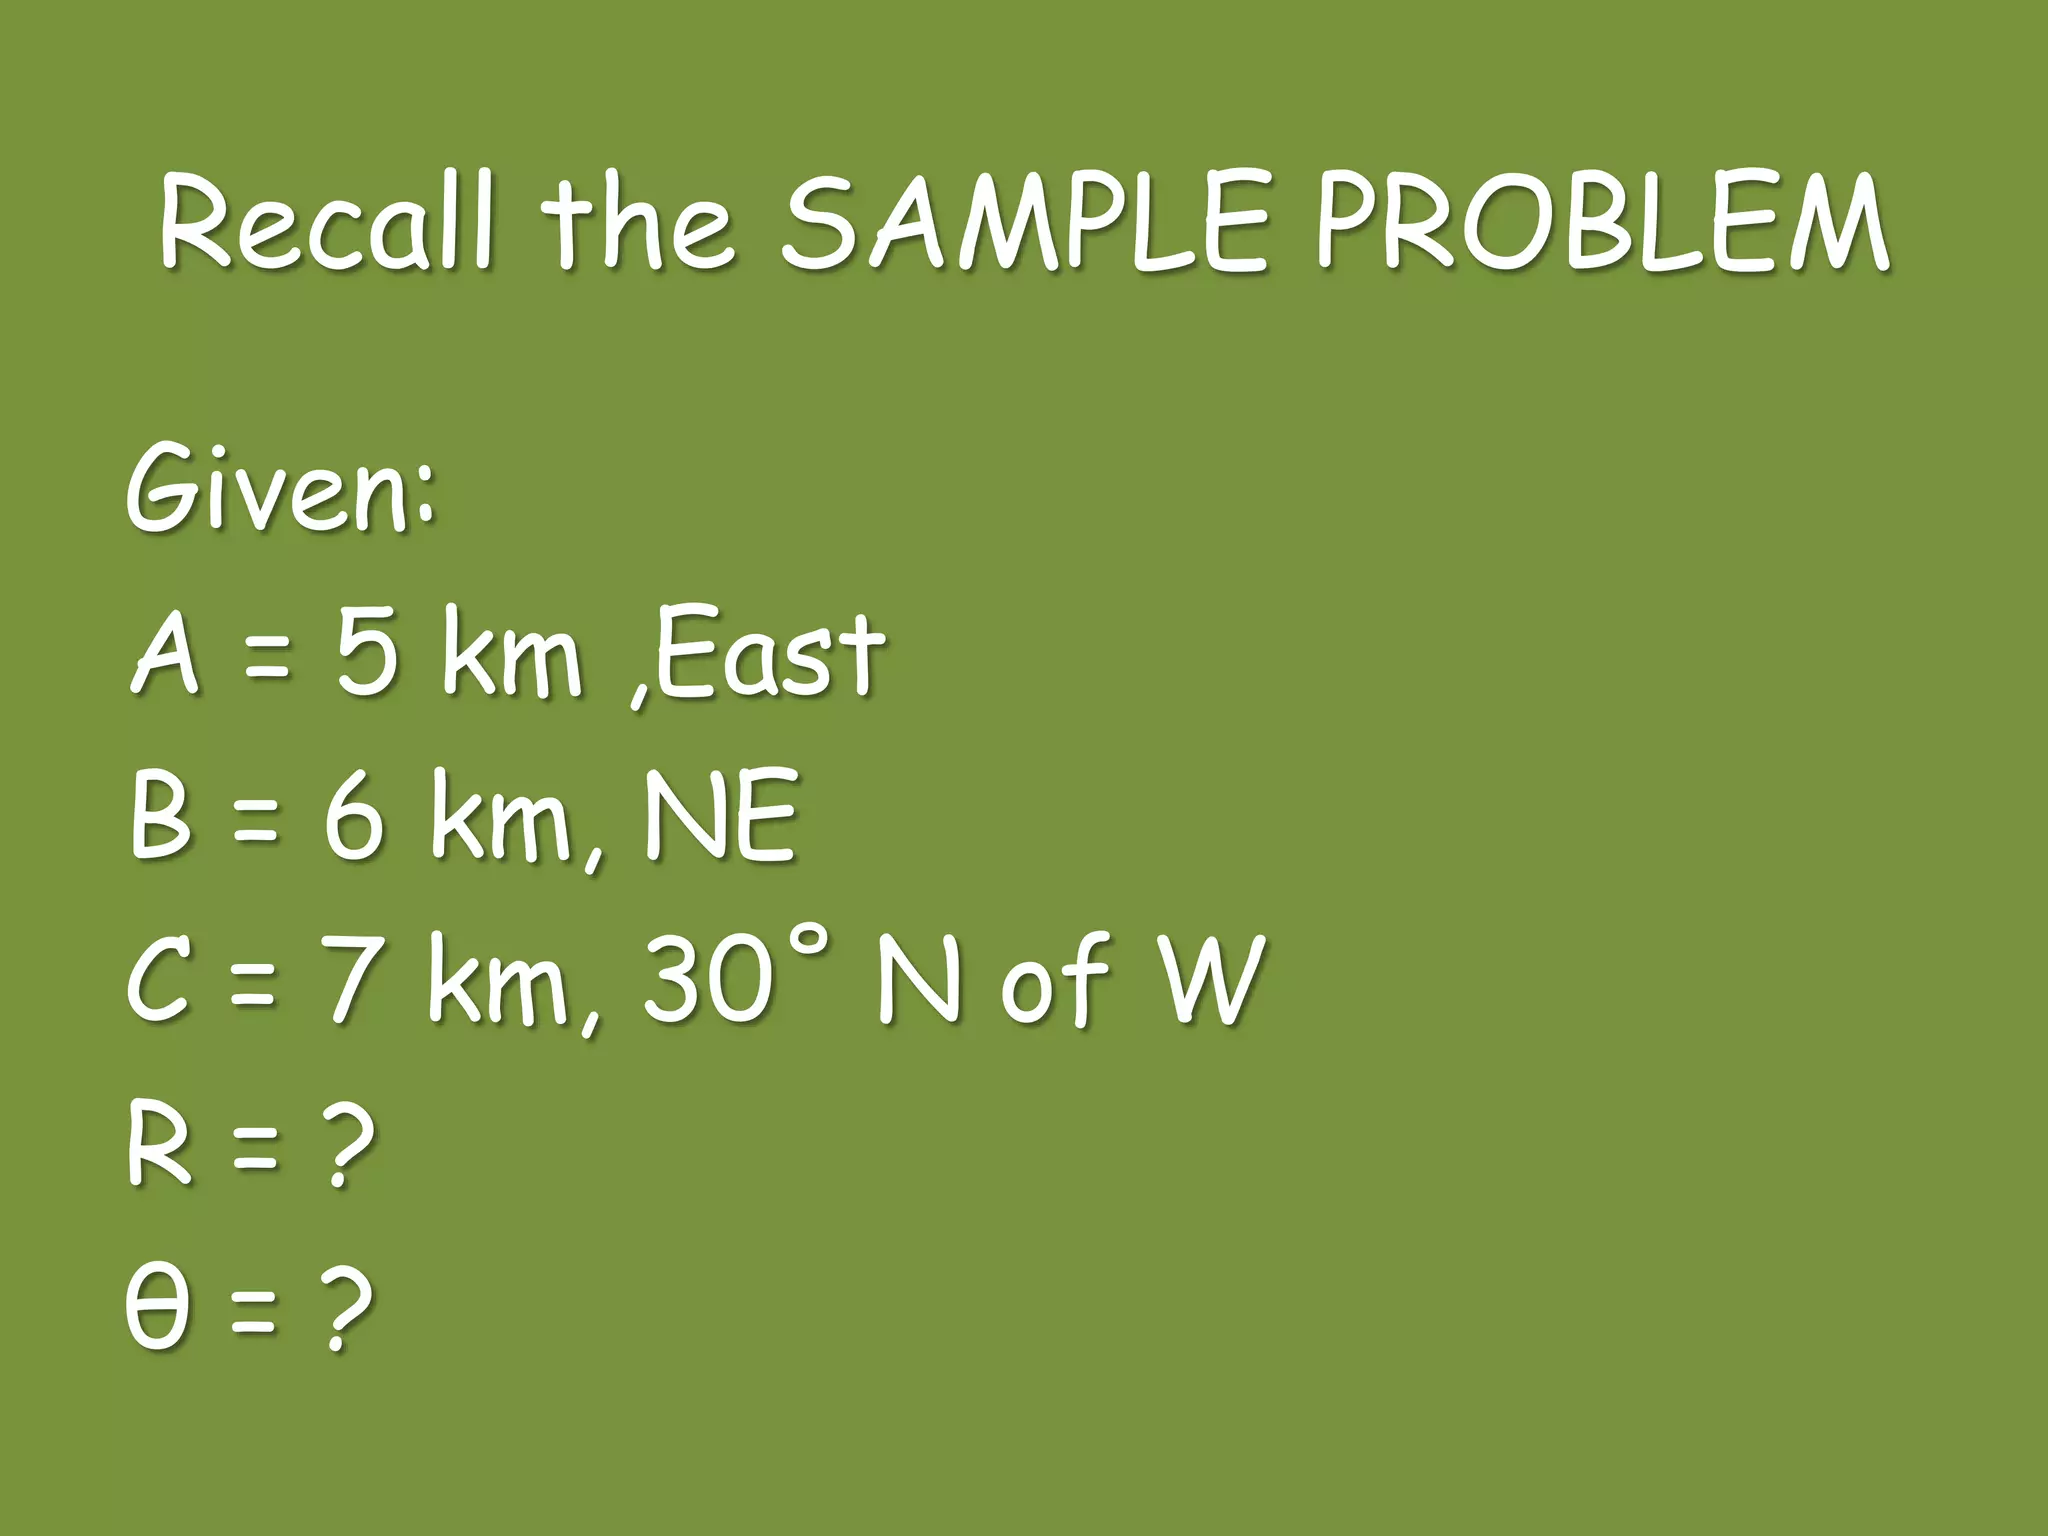
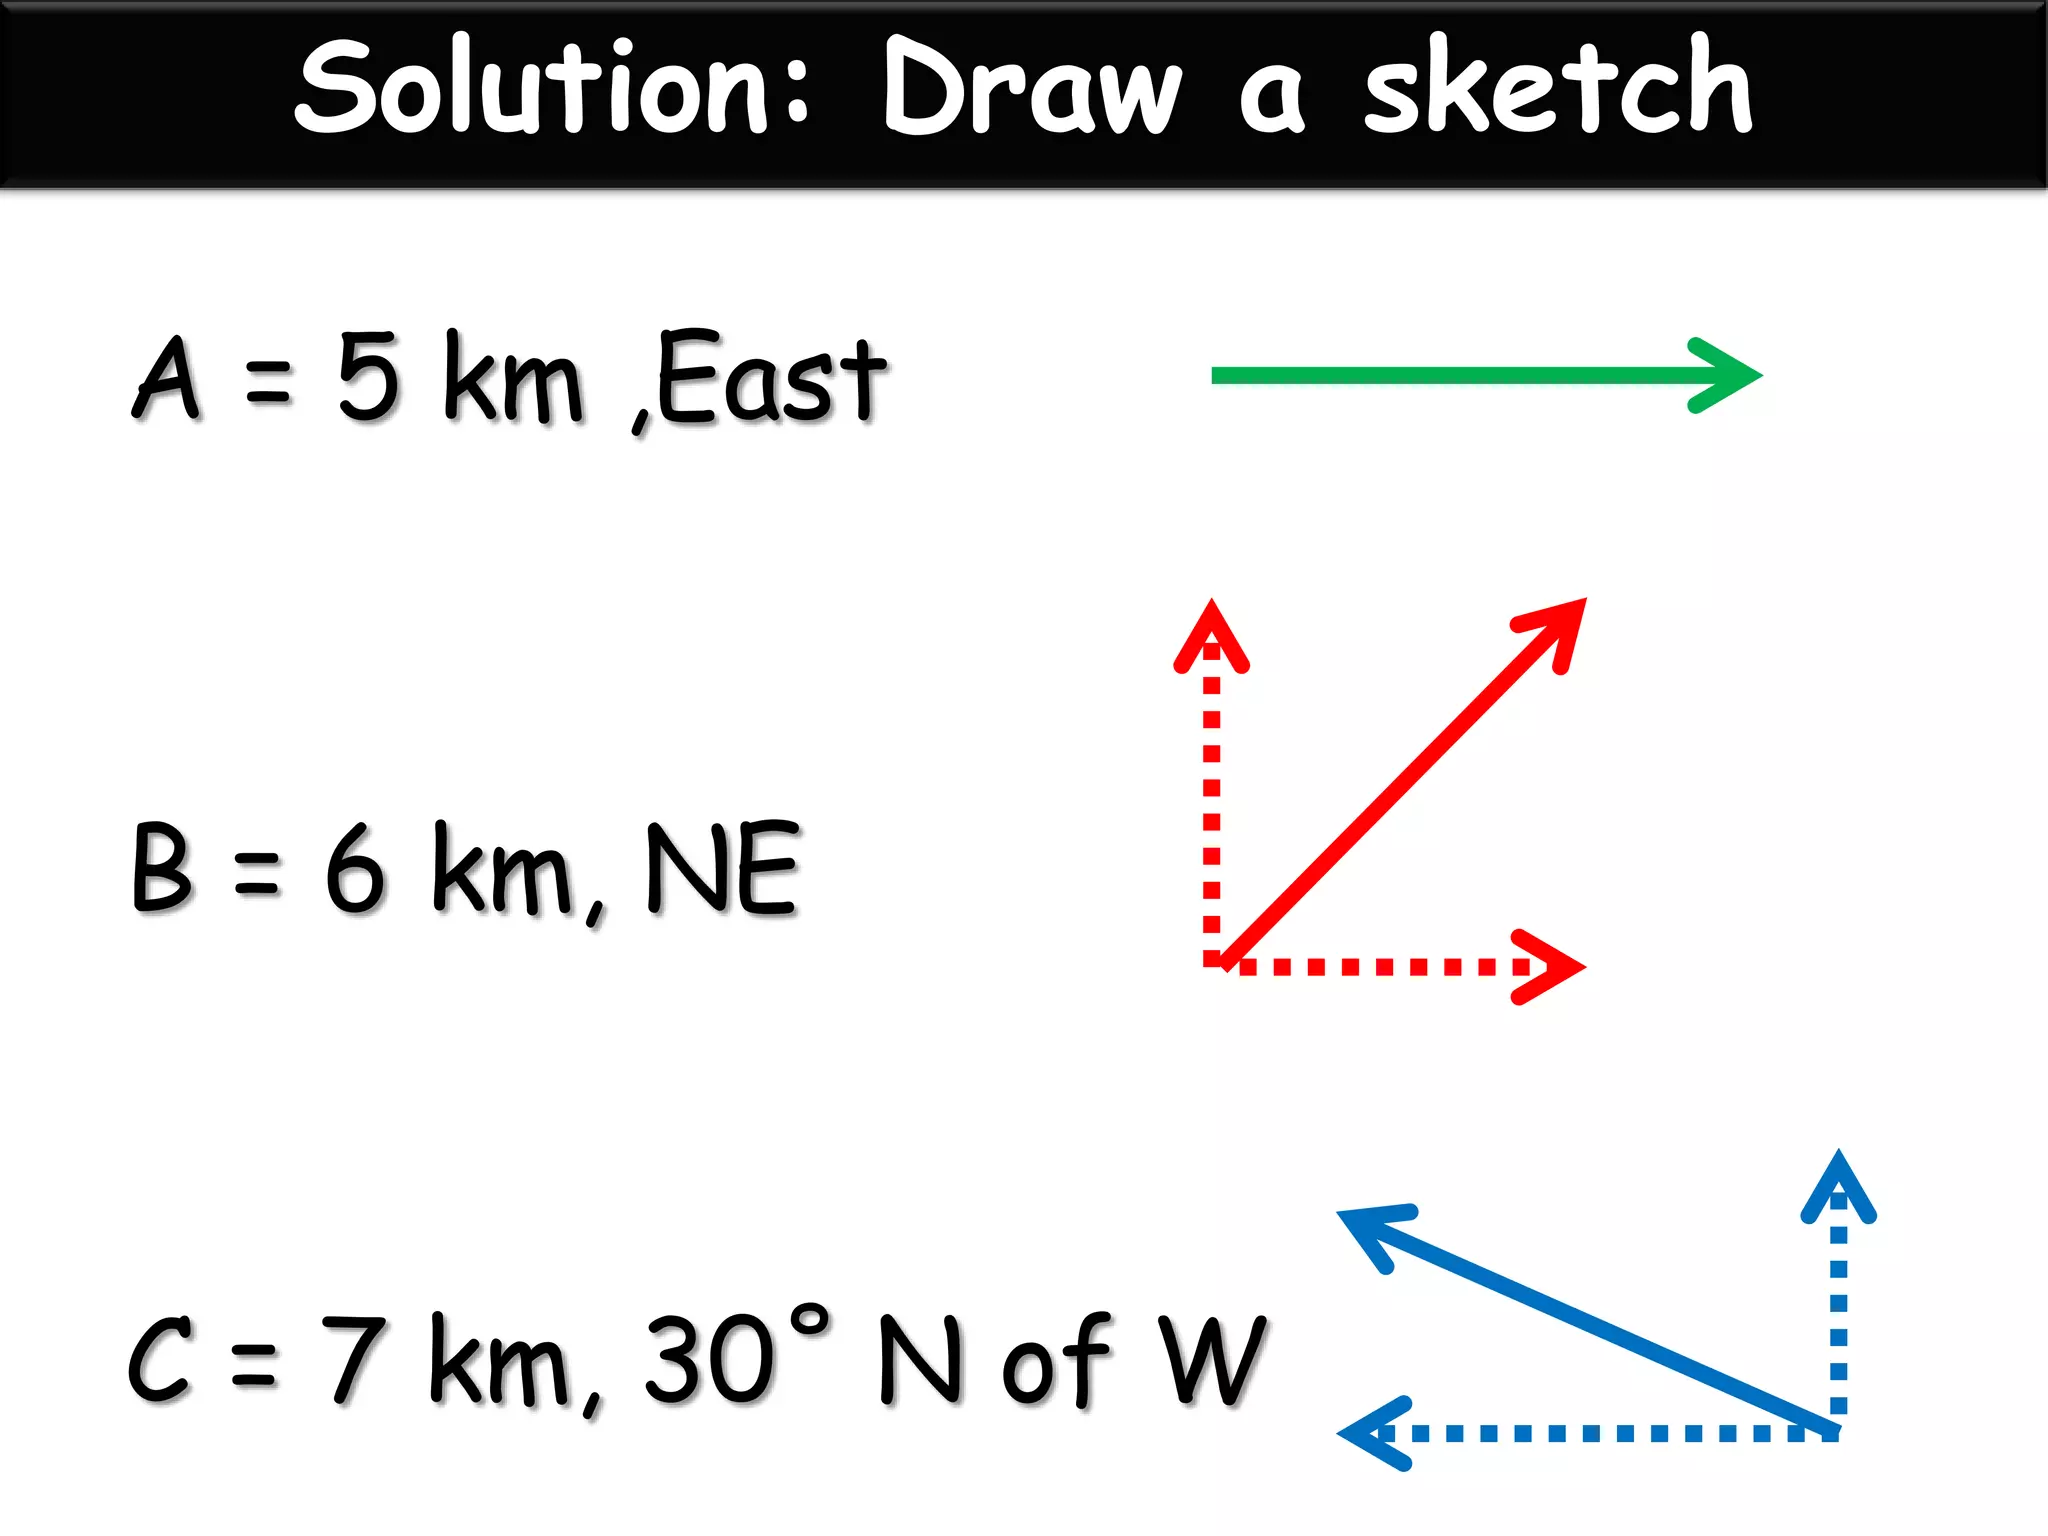
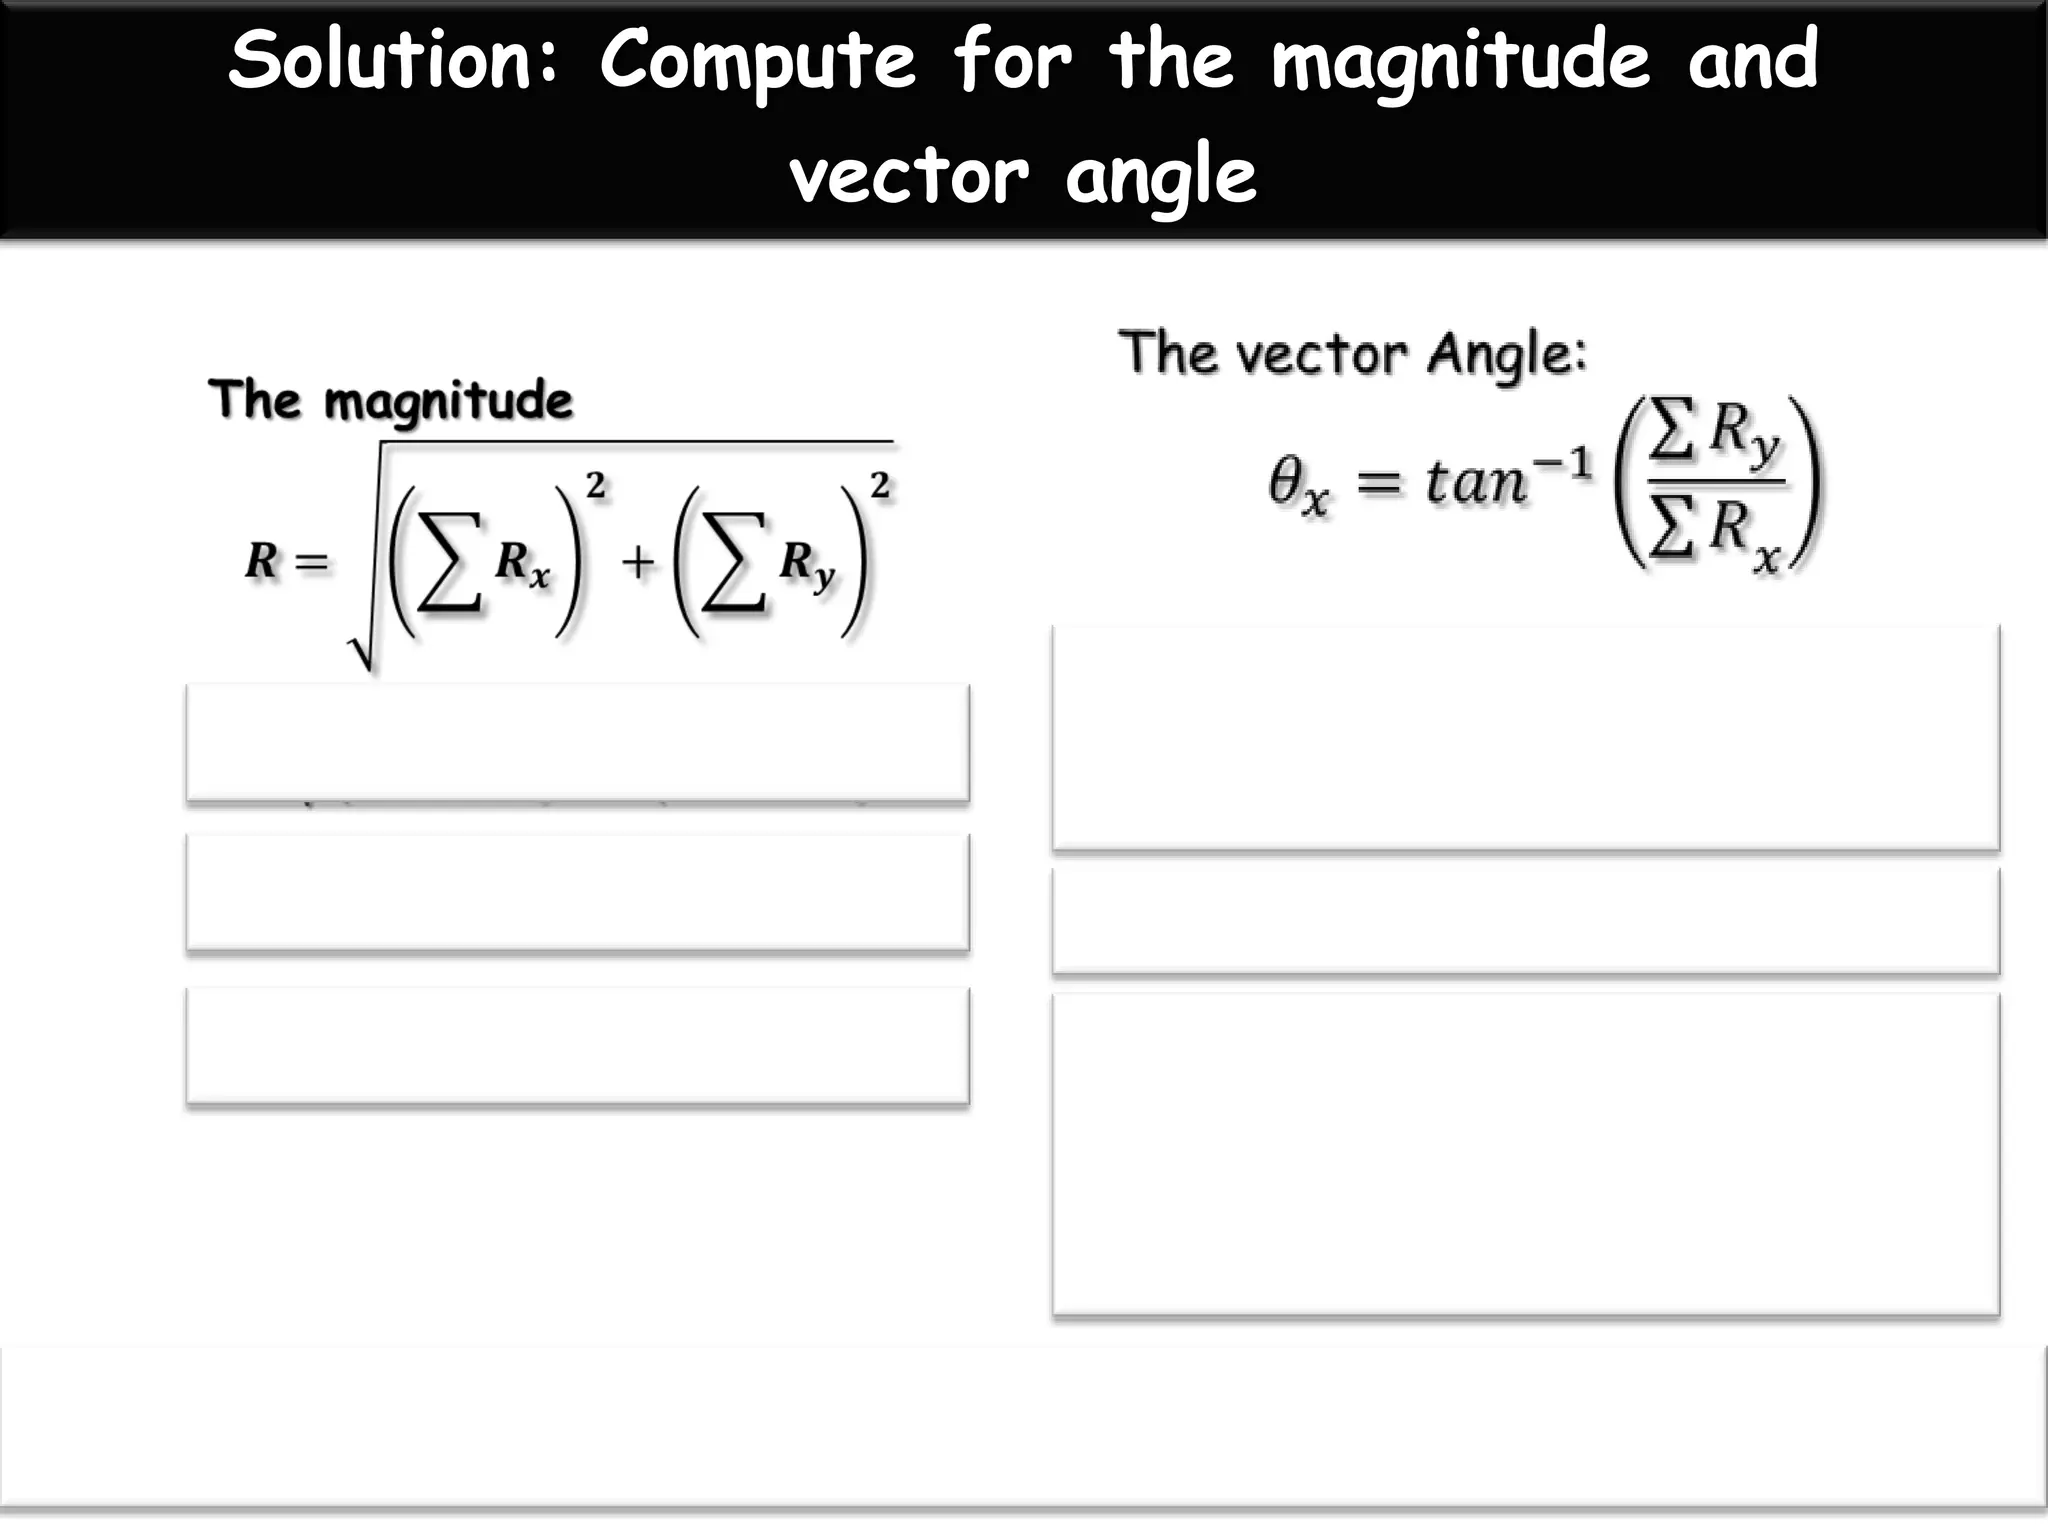
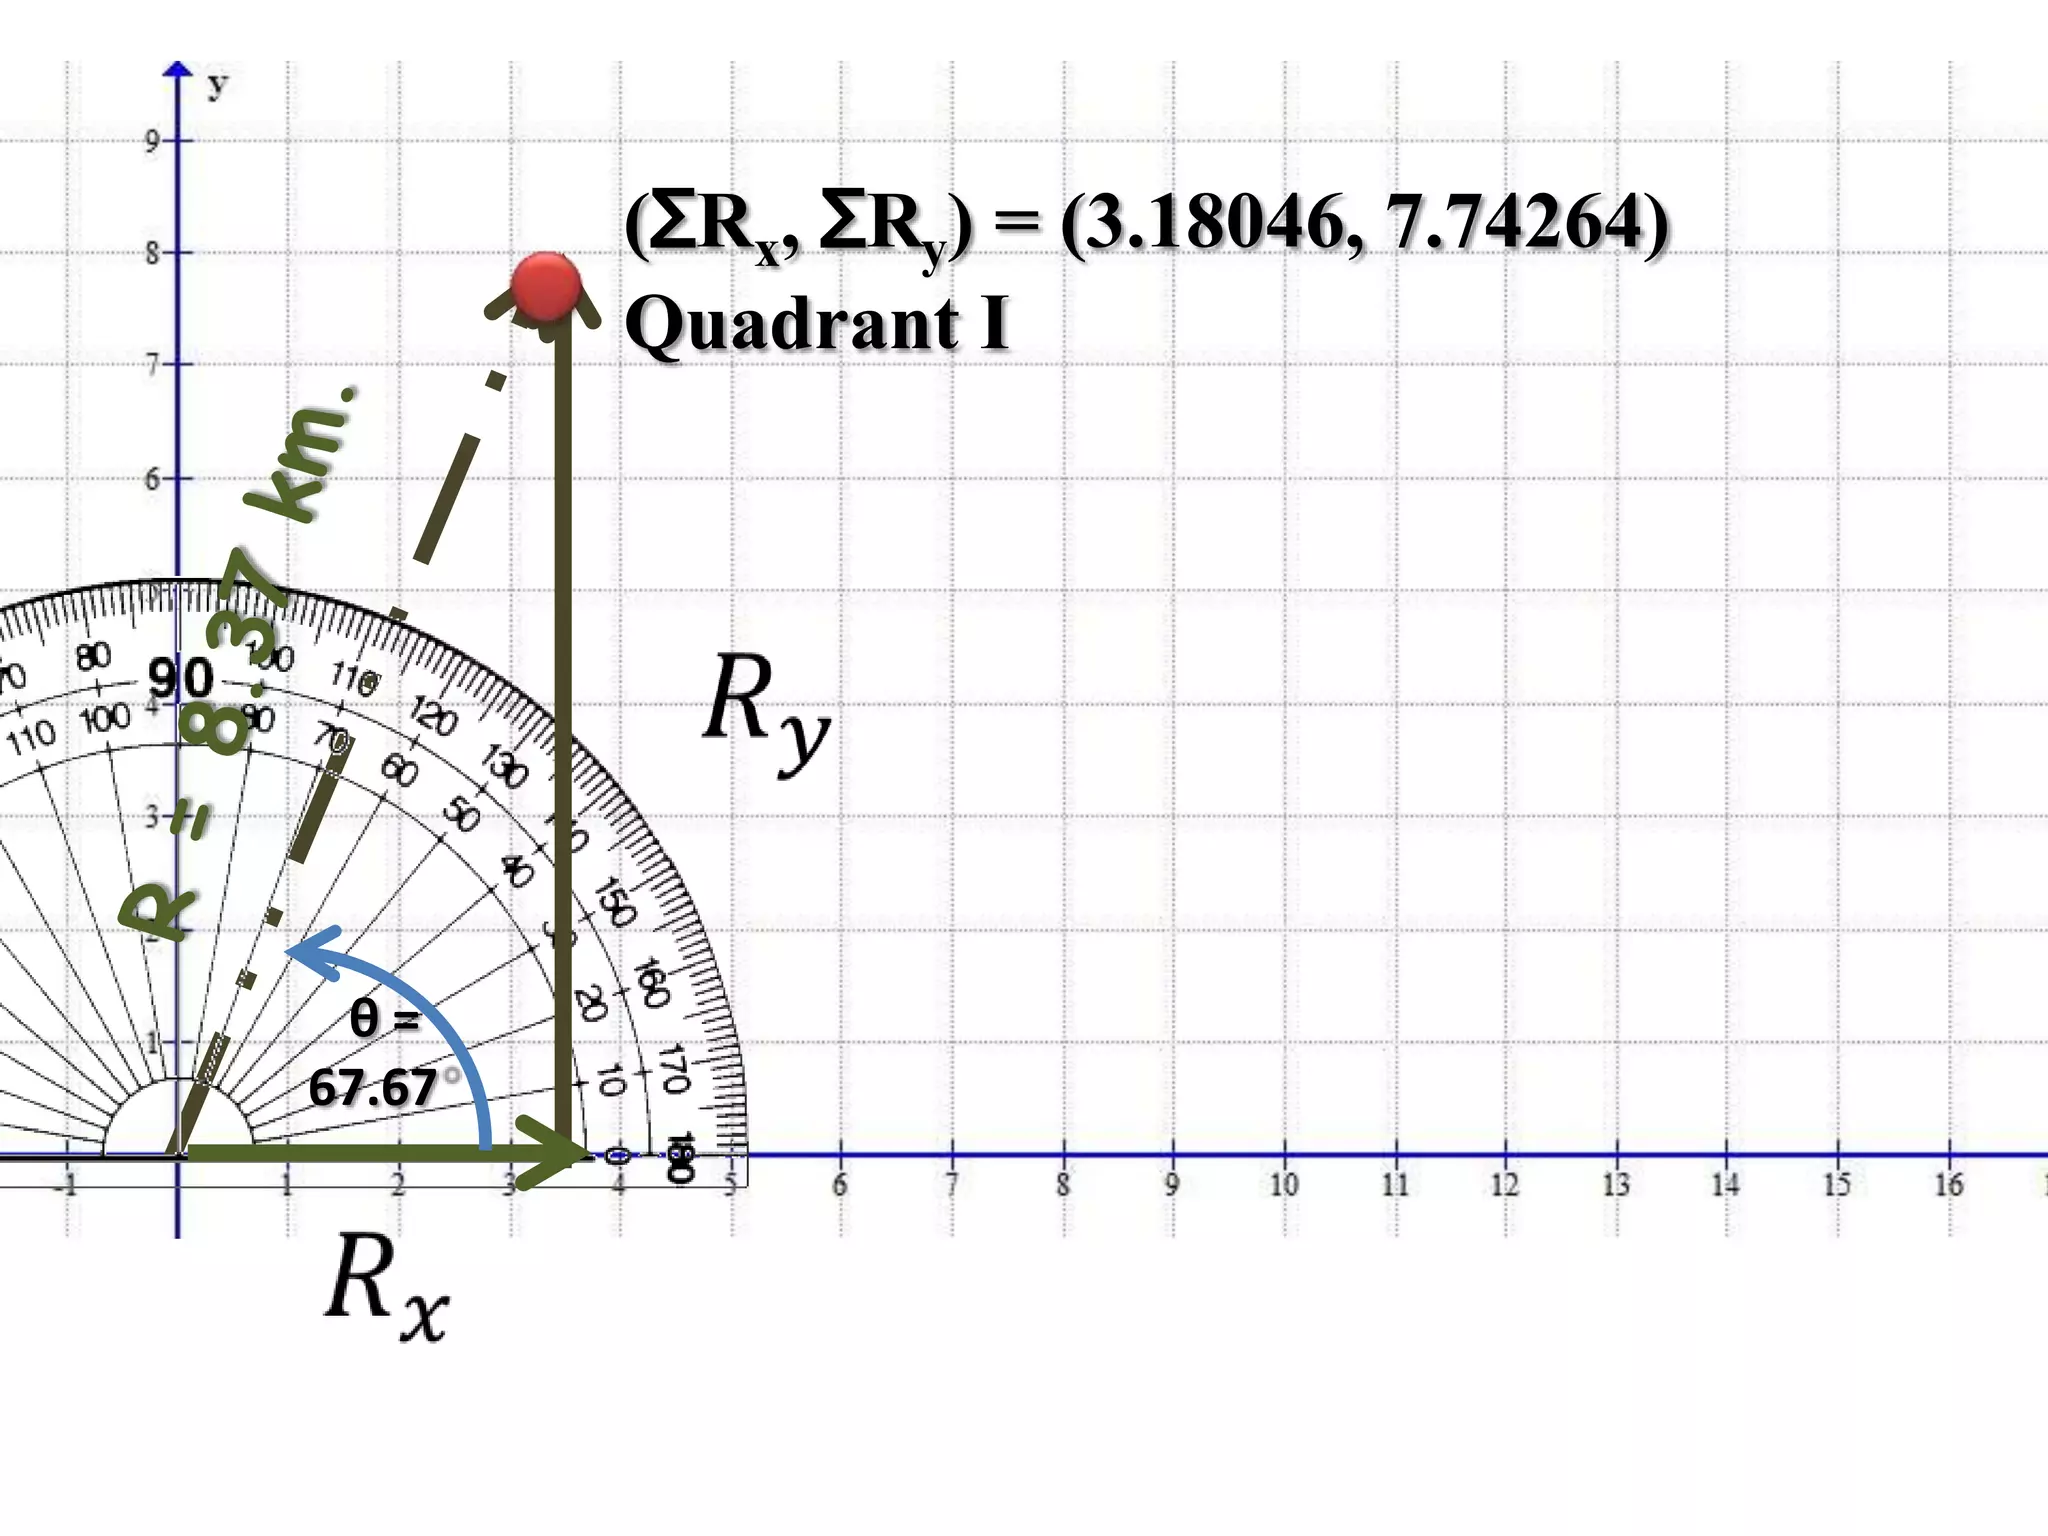
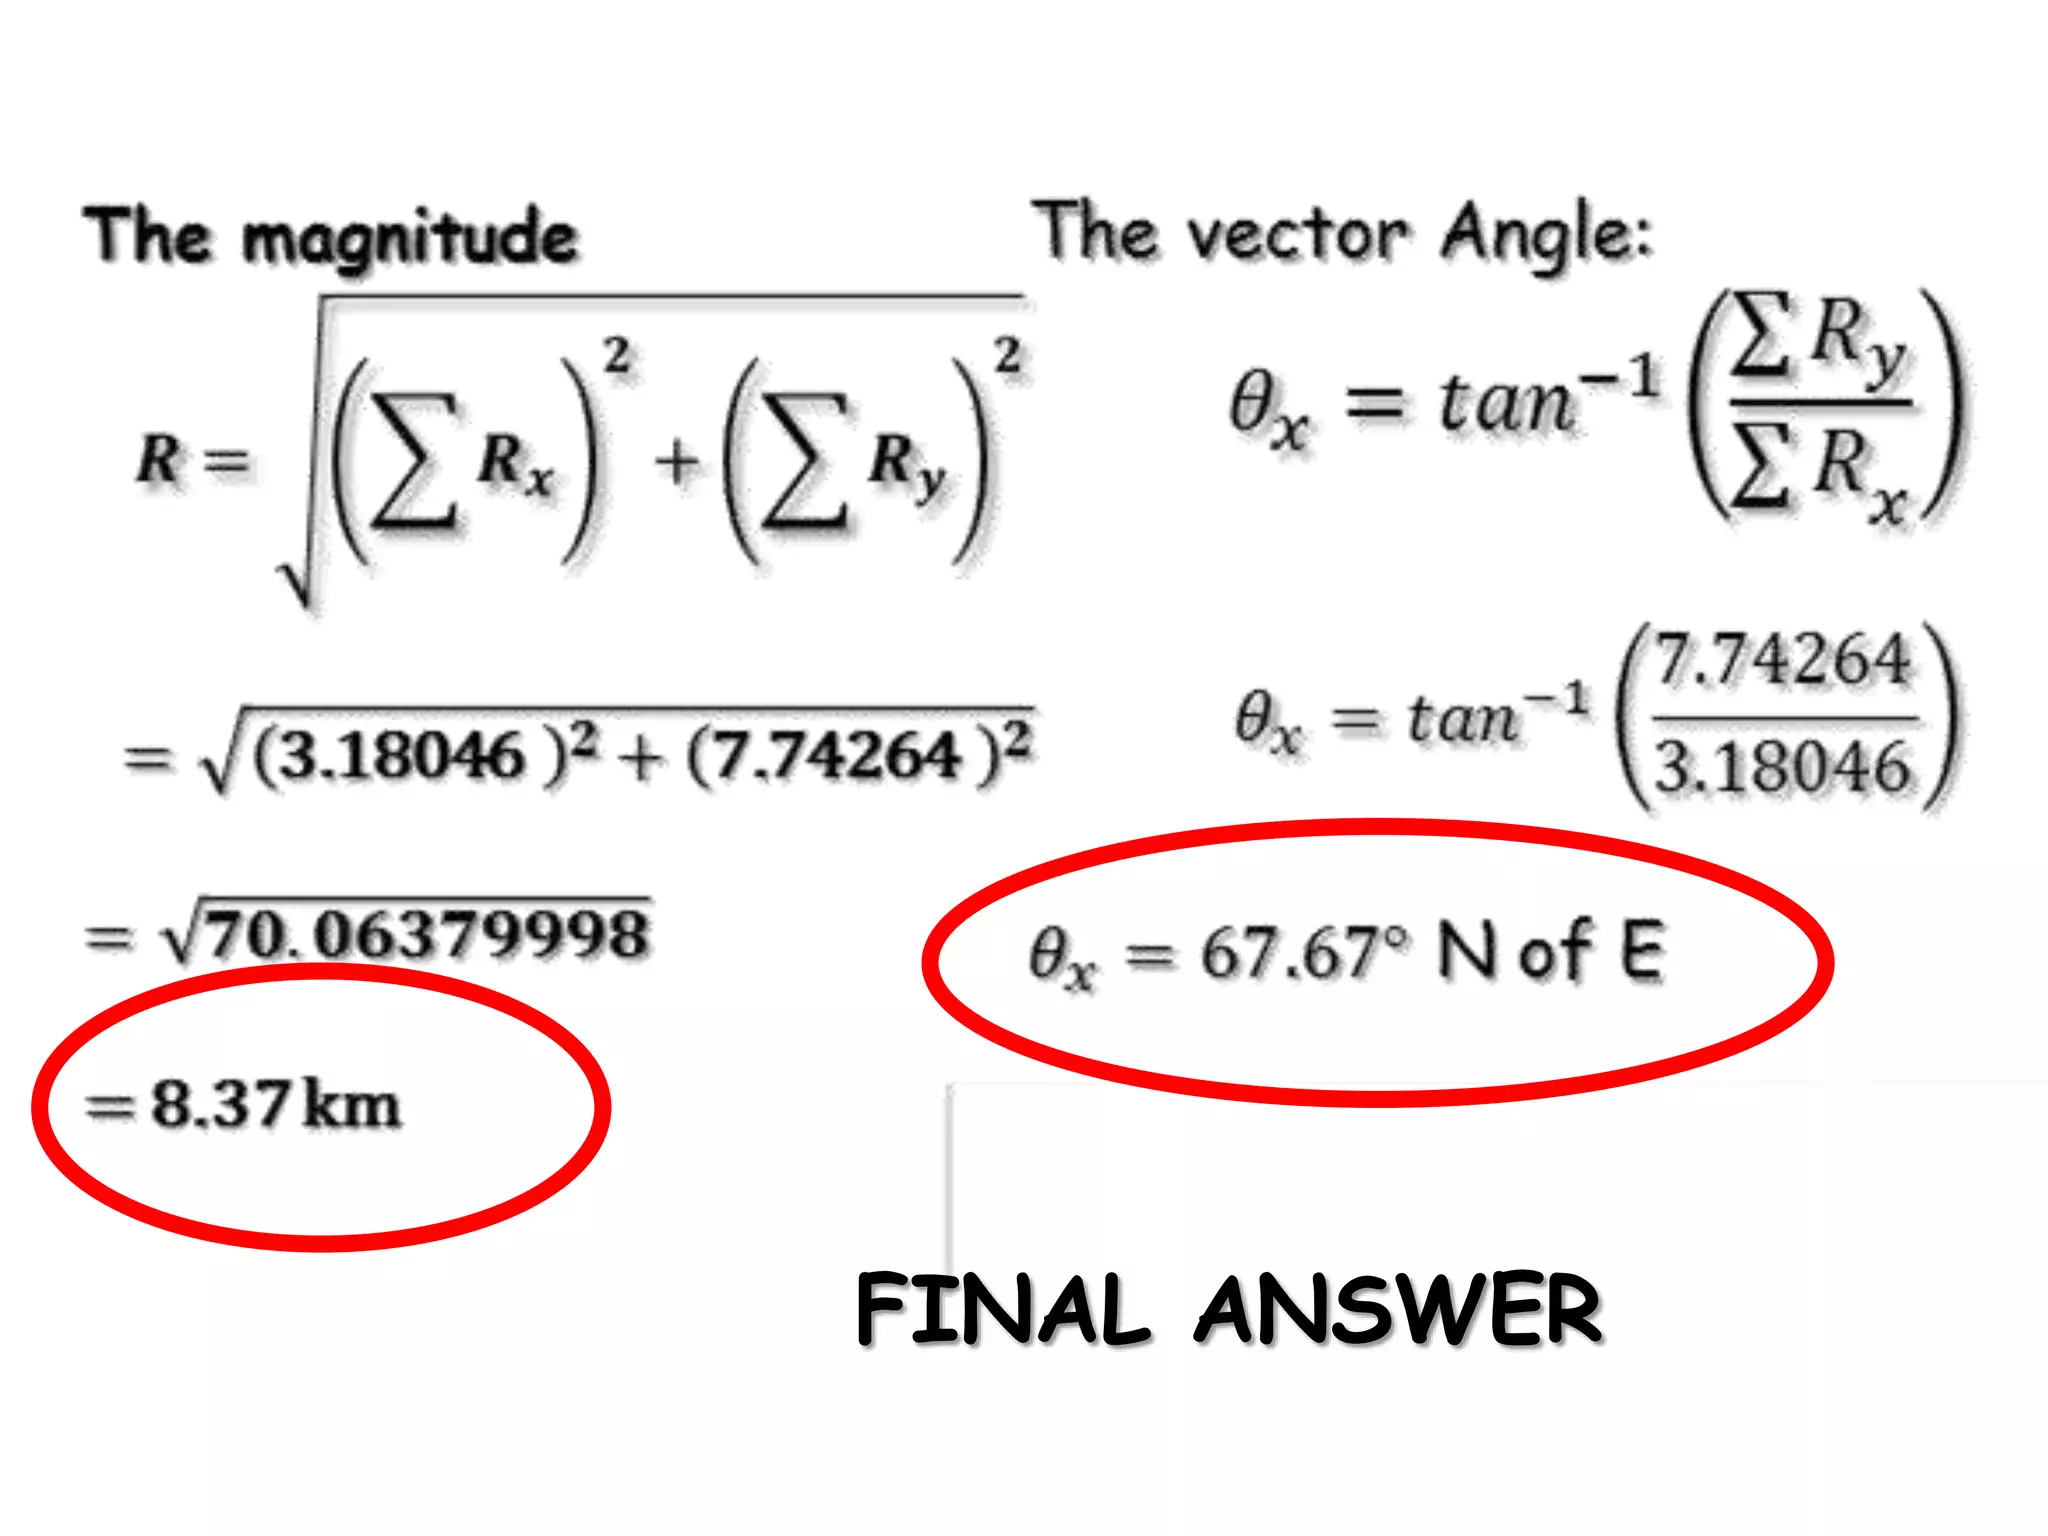
Step-by-step problem-solving for resultant vectors using analytical methods, with calculations shown.
Summary of answers for previous sample problems, reinforcing understanding of vector components.