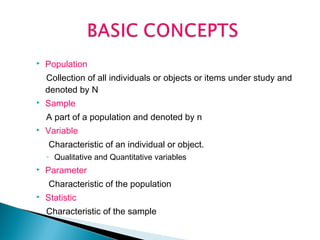
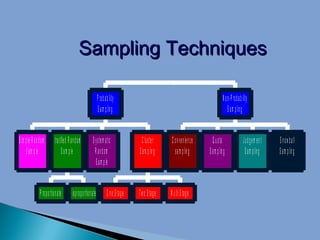
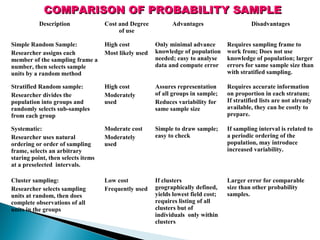
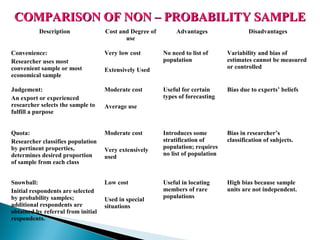
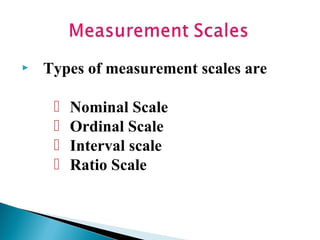
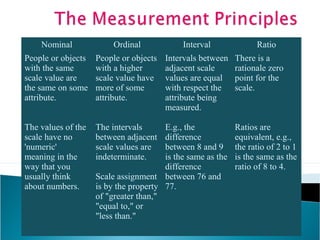
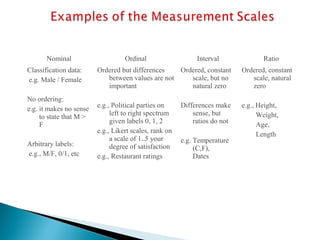


Population
Collection of all individuals or objects or items under study and
denoted by N



Sample
A part of a population and denoted by n



Variable
Characteristic of an individual or object.
◦ Qualitative and Quantitative variables



Parameter
Characteristic of the population



Statistic
Characteristic of the sample
Sampling Techniques
P ro b a b i l i t y
S a m p lin g
S i m p l e R a n d o m S tra ti f i e d R a n d o m
S a m p le
S a m p le

P ro p o rti o n a te

S y s te m a ti c
R andom
S a m p le

D i s p ro p o rti o n a te

O n e S ta g e

N o n -P ro b a b i l i t y
S a m p lin g
C l u s te r
S a m p lin g

C o n ve n i e n c e
s a m p lin g

T w o S ta g e

M u l t i S ta g e

Q u o ta
S a m p lin g

Judgem ent
S a m p lin g

S nowbal
S a m p lin g
COMPARISON OF PROBABILITY SAMPLE
Description

Cost and Degree
of use

Advantages

Disadvantages

Simple Random Sample:
Researcher assigns each
member of the sampling frame a
number, then selects sample
units by a random method

High cost
Most likely used

Only minimal advance
knowledge of population
needed; easy to analyse
data and compute error

Requires sampling frame to
work from; Does not use
knowledge of population; larger
errors for same sample size than
with stratified sampling.

Stratified Random sample:
Researcher divides the
population into groups and
randomly selects sub-samples
from each group

High cost
Moderately
used

Assures representation
of all groups in sample;
Reduces variability for
same sample size

Requires accurate information
on proportion in each stratum;
If stratified lists are not already
available, they can be costly to
prepare.

Systematic:
Researcher uses natural
ordering or order of sampling
frame, selects an arbitrary
staring point, then selects items
at a preselected intervals.

Moderate cost
Moderately
used

Simple to draw sample;
easy to check

If sampling interval is related to
a periodic ordering of the
population, may introduce
increased variability.

Cluster sampling:
Researcher selects sampling
units at random, then does
complete observations of all
units in the groups

Low cost
Frequently used

If clusters
geographically defined,
yields lowest field cost;
requires listing of all
clusters but of
individuals only within
clusters

Larger error for comparable
size than other probability
samples.
COMPARISON OF NON – PROBABILITY SAMPLE
Description

Cost and Degree of
use

Convenience:
Researcher uses most
convenient sample or most
economical sample

Very low cost

Judgement:
An export or experienced
researcher selects the sample to
fulfill a purpose

Moderate cost

Quota:
Researcher classifies population
by pertinent properties,
determines desired proportion
of sample from each class

Moderate cost

Snowball:
Initial respondents are selected
by probability samples;
additional respondents are
obtained by referral from initial
respondents.

Low cost

Advantages

Disadvantages

No need to list of
population

Variability and bias of
estimates cannot be measured
or controlled

Useful for certain
types of forecasting

Bias due to experts’ beliefs

Introduces some
stratification of
population; requires
no list of population

Bias in researcher’s
classification of subjects.

Useful in locating
members of rare
populations

High bias because sample
units are not independent.

Extensively Used

Average use

Very extensively
used

Used in special
situations


Types of measurement scales are





Nominal Scale
Ordinal Scale
Interval scale
Ratio Scale
Nominal

Ordinal

Interval

Ratio

People or objects People or objects Intervals between There is a
withNominalOrdinalIntervalRatioPeople or objects withscale scale value are the same
the same
with a higher
adjacent the same rationale zero
on some attribute. The values of the scale have no 'numeric' meaning in the way that
scale value are
scale value have values are equal point for the
you usually think about numbers.People or objects with a higher scale value have more
the same on some The intervals between adjacent scale values arescale.
with respect the
of some attribute. more of some
indeterminate. Scale
attribute.
attribute being
assignment is by attribute. of "greater than," "equal to," or "less than."Intervals
the property
between adjacent scale values are equal with respect the the attribute being measured.
measured.
E.g., the difference between 8 and 9 is the same as the difference between 76 and
The77.There ofathe The intervals the scale. Ratios are equivalent, e.g., are ratio of 2
values is rationale zero point for
E.g., the
Ratios the
to 1 is the same as the ratio of 8 to 4.

scale have no
'numeric'
meaning in the
way that you
usually think
about numbers.

between adjacent difference
scale values are
between 8 and 9
indeterminate.
is the same as the
difference
Scale assignment between 76 and
is by the property 77.
of "greater than,"
"equal to," or
"less than."

equivalent, e.g.,
the ratio of 2 to 1
is the same as the
ratio of 8 to 4.
Nominal
Classification data:
e.g. Male / Female
No ordering:
e.g. it makes no sense
to state that M >
F
Arbitrary labels:
e.g., M/F, 0/1, etc

Ordinal

Interval

Ratio

Ordered but differences
Ordered, constant
between values are not
scale, but no
important
natural zero

Ordered, constant
scale, natural
zero

e.g., Political parties on
left to right spectrum
given labels 0, 1, 2
e.g., Likert scales, rank on
a scale of 1..5 your
degree of satisfaction
e.g., Restaurant ratings

e.g., Height,
Weight,
Age,
Length

Differences make
sense, but
ratios do not
e.g. Temperature
(C,F),
Dates

Sampling techniques

  • 2.
     Population Collection of allindividuals or objects or items under study and denoted by N  Sample A part of a population and denoted by n  Variable Characteristic of an individual or object. ◦ Qualitative and Quantitative variables  Parameter Characteristic of the population  Statistic Characteristic of the sample
  • 3.
    Sampling Techniques P rob a b i l i t y S a m p lin g S i m p l e R a n d o m S tra ti f i e d R a n d o m S a m p le S a m p le P ro p o rti o n a te S y s te m a ti c R andom S a m p le D i s p ro p o rti o n a te O n e S ta g e N o n -P ro b a b i l i t y S a m p lin g C l u s te r S a m p lin g C o n ve n i e n c e s a m p lin g T w o S ta g e M u l t i S ta g e Q u o ta S a m p lin g Judgem ent S a m p lin g S nowbal S a m p lin g
  • 4.
    COMPARISON OF PROBABILITYSAMPLE Description Cost and Degree of use Advantages Disadvantages Simple Random Sample: Researcher assigns each member of the sampling frame a number, then selects sample units by a random method High cost Most likely used Only minimal advance knowledge of population needed; easy to analyse data and compute error Requires sampling frame to work from; Does not use knowledge of population; larger errors for same sample size than with stratified sampling. Stratified Random sample: Researcher divides the population into groups and randomly selects sub-samples from each group High cost Moderately used Assures representation of all groups in sample; Reduces variability for same sample size Requires accurate information on proportion in each stratum; If stratified lists are not already available, they can be costly to prepare. Systematic: Researcher uses natural ordering or order of sampling frame, selects an arbitrary staring point, then selects items at a preselected intervals. Moderate cost Moderately used Simple to draw sample; easy to check If sampling interval is related to a periodic ordering of the population, may introduce increased variability. Cluster sampling: Researcher selects sampling units at random, then does complete observations of all units in the groups Low cost Frequently used If clusters geographically defined, yields lowest field cost; requires listing of all clusters but of individuals only within clusters Larger error for comparable size than other probability samples.
  • 5.
    COMPARISON OF NON– PROBABILITY SAMPLE Description Cost and Degree of use Convenience: Researcher uses most convenient sample or most economical sample Very low cost Judgement: An export or experienced researcher selects the sample to fulfill a purpose Moderate cost Quota: Researcher classifies population by pertinent properties, determines desired proportion of sample from each class Moderate cost Snowball: Initial respondents are selected by probability samples; additional respondents are obtained by referral from initial respondents. Low cost Advantages Disadvantages No need to list of population Variability and bias of estimates cannot be measured or controlled Useful for certain types of forecasting Bias due to experts’ beliefs Introduces some stratification of population; requires no list of population Bias in researcher’s classification of subjects. Useful in locating members of rare populations High bias because sample units are not independent. Extensively Used Average use Very extensively used Used in special situations
  • 6.
     Types of measurementscales are     Nominal Scale Ordinal Scale Interval scale Ratio Scale
  • 7.
    Nominal Ordinal Interval Ratio People or objectsPeople or objects Intervals between There is a withNominalOrdinalIntervalRatioPeople or objects withscale scale value are the same the same with a higher adjacent the same rationale zero on some attribute. The values of the scale have no 'numeric' meaning in the way that scale value are scale value have values are equal point for the you usually think about numbers.People or objects with a higher scale value have more the same on some The intervals between adjacent scale values arescale. with respect the of some attribute. more of some indeterminate. Scale attribute. attribute being assignment is by attribute. of "greater than," "equal to," or "less than."Intervals the property between adjacent scale values are equal with respect the the attribute being measured. measured. E.g., the difference between 8 and 9 is the same as the difference between 76 and The77.There ofathe The intervals the scale. Ratios are equivalent, e.g., are ratio of 2 values is rationale zero point for E.g., the Ratios the to 1 is the same as the ratio of 8 to 4. scale have no 'numeric' meaning in the way that you usually think about numbers. between adjacent difference scale values are between 8 and 9 indeterminate. is the same as the difference Scale assignment between 76 and is by the property 77. of "greater than," "equal to," or "less than." equivalent, e.g., the ratio of 2 to 1 is the same as the ratio of 8 to 4.
  • 8.
    Nominal Classification data: e.g. Male/ Female No ordering: e.g. it makes no sense to state that M > F Arbitrary labels: e.g., M/F, 0/1, etc Ordinal Interval Ratio Ordered but differences Ordered, constant between values are not scale, but no important natural zero Ordered, constant scale, natural zero e.g., Political parties on left to right spectrum given labels 0, 1, 2 e.g., Likert scales, rank on a scale of 1..5 your degree of satisfaction e.g., Restaurant ratings e.g., Height, Weight, Age, Length Differences make sense, but ratios do not e.g. Temperature (C,F), Dates

Editor's Notes