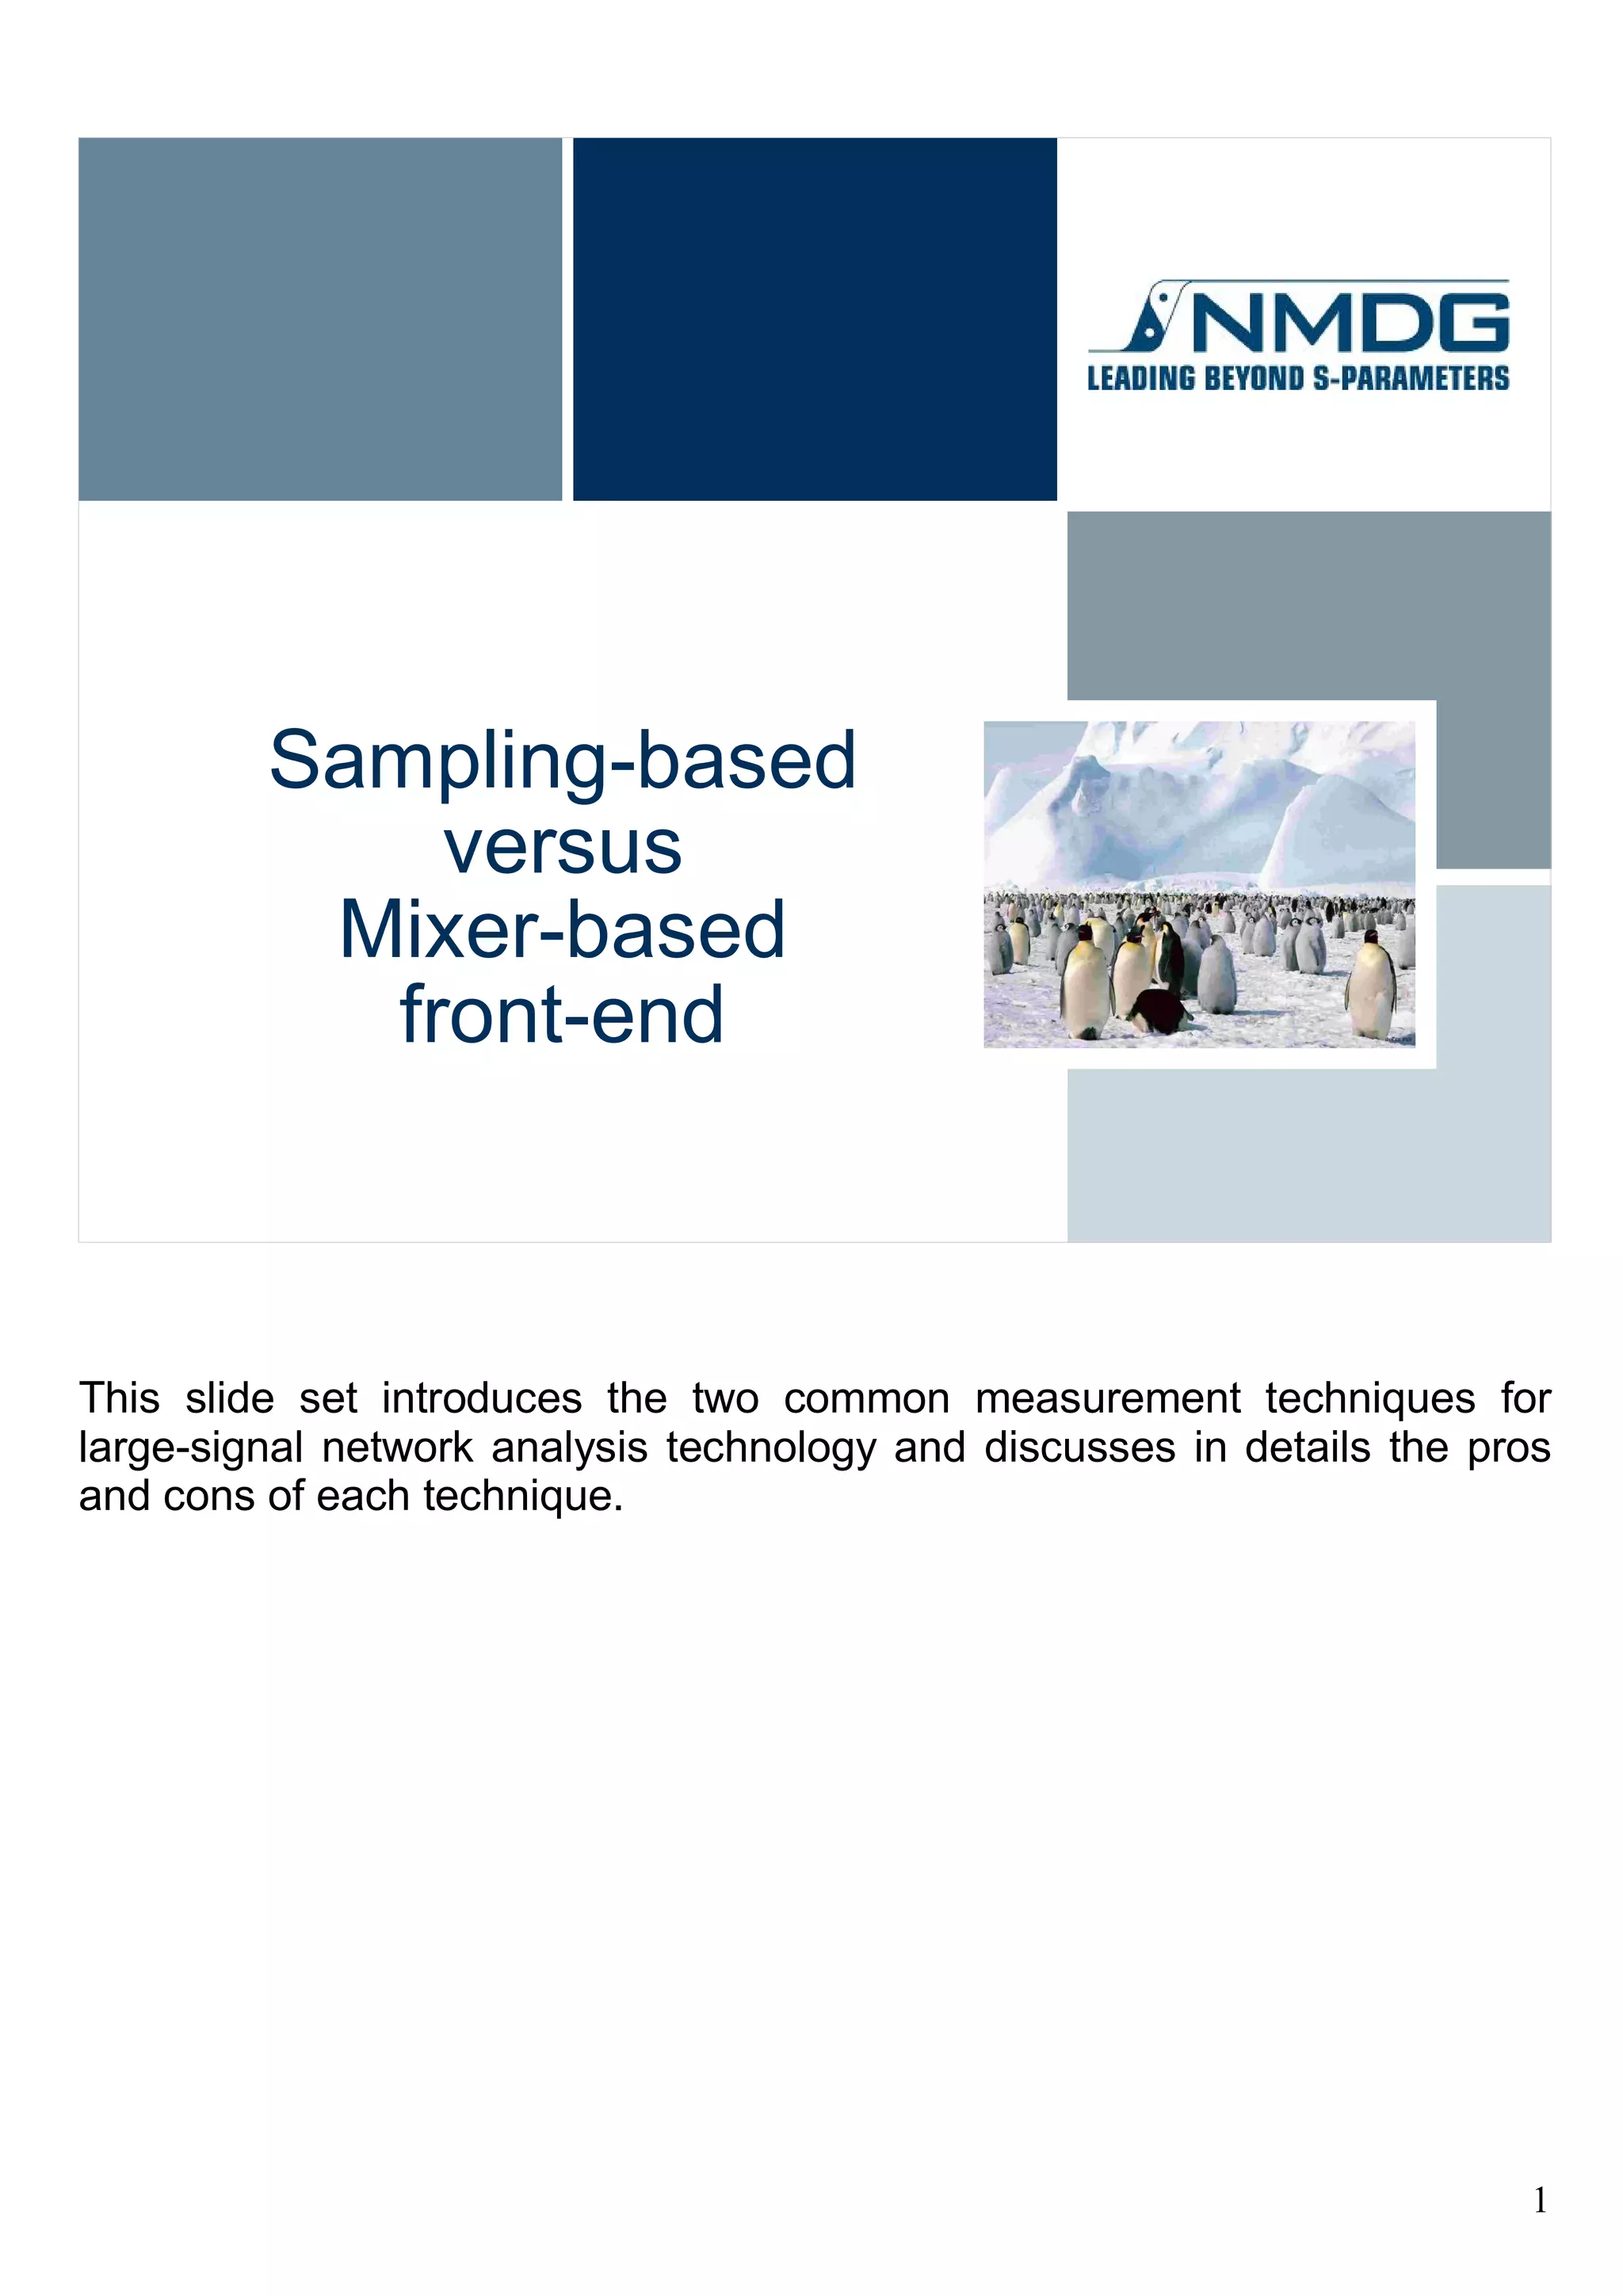
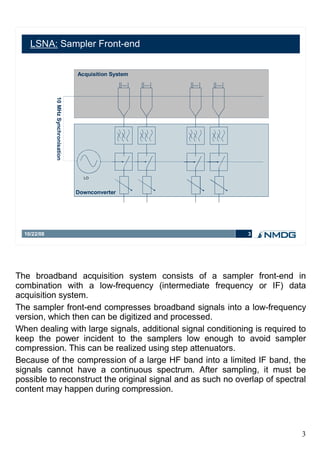
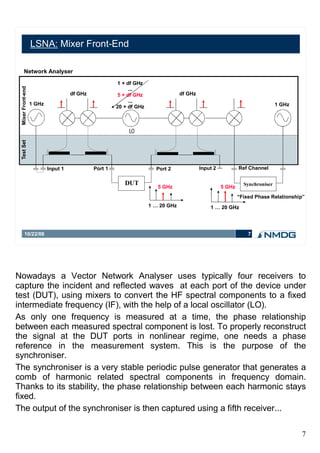
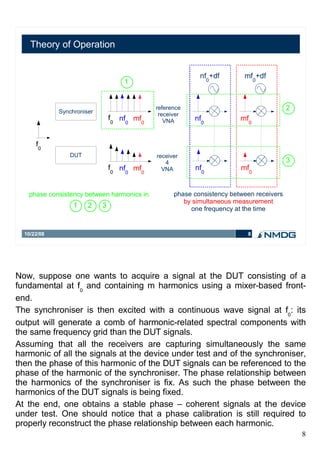
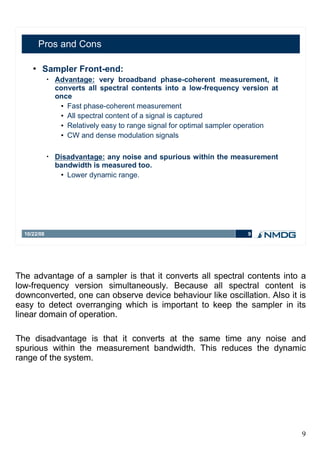
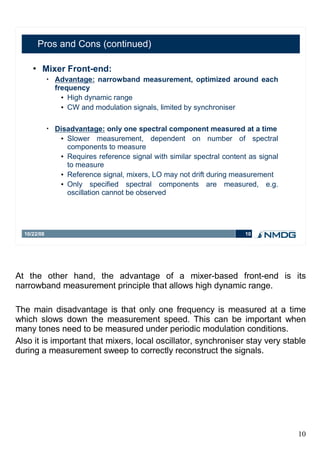
This document compares two techniques for large-signal network analysis - a sampler-based front-end and a mixer-based front-end. The sampler-based approach converts broadband signals to low frequencies simultaneously, allowing fast measurement but with lower dynamic range due to noise. The mixer-based method measures single frequencies, providing high dynamic range but slower measurement. Both can characterize nonlinear behavior in continuous wave and modulation modes.
The Building of Pulsed NQR/NMR Spectrometer IJECEIAES
NQR spectrometer designed is composed of four modules; Transmitter, Probe, Receiver and computer controlled (FPGA & Software) module containing frequency synthesizer, synchronous demodulator, pulse programmer and display. The function of the Transmitter module is to amplify the RF pulse sequence to about 200 W power level into the probe (50 Ohm) which is a parallel resonance circuit with a tapped capacitor. The probe excites the nucleus and picks-up the signal emitted from the nuclei. The nuclear signal at the same frequency as the excitation, which is typically in the range of a few microvolts is amplified, demodulated and filtered (1 kHz to 100 kHz) by receiver module. 14 N NQR, 1 H and 2 H NMR signals are observed from the spectrometer.As the SNR of NQR signal is very low, NQR signal processing based on Adaptive Line Enhancement is presented.
Join us for a LIVE WEBINAR on this topic! Wednesday, November 14, 2:00pm ET
http://bit.ly/XPgjO7
Wide bandwidth modulation is becoming more common in communications. The emergence of the 802.11ac wireless Ethernet standard has extended the modulation bandwidth to 160 MHz which requires very wide band measurement equipment to measure. This presentation illustrates the details of a measurement method that uses a real time digital down converter and post processing software that measures the performance of this signal.
As a communication engineer our princple interest is signal and their measuring instrument; Thus Spectrum Analyzer is an instrument which graphically provides the energy distribution of a signal as a function of the frequency on its CRT.
The spectrum analyzer provides information about all these things, by displaying the signal in the frequency domain.
The measurement of dominant frequencies and their responses.
The component levels and energy strength
Frequency stability
Bandwidth and Spectral purity
Modulation index and attenuation
Harmonic and intermodulation distortion
Various signal generation and so on
Which is not easy to measure at time domain
Details: https://electronicsembeddedworld.blogspot.com/2018/06/performance-management-mcq.html
FM demodulation involves changing the frequency variations in a signal into amplitude variations at baseband, e.g. audio. There are several techniques and circuits that can be used each with its own advantages and disadvantages.
In any radio that is designed to receive frequency modulated signals there is some form of FM demodulator or detector. This circuit takes in frequency modulated RF signals and takes the modulation from the signal to output only the modulation that had been applied at the transmitter.
There are several types of FM detector / demodulator that can be used. Some types were more popular in the days when radios were made from discrete devices, but nowadays the PLL based detector and quadrature / coincidence detectors are the most widely used as they lend themselves to being incorporated into integrated circuits very easily...
An Active, Tracking Microwave Notch Filter Using a Pair of Gunn Oscillators ...jmicro
In this paper, we have designed a signal tracking m
icrowave notch filter at X-band (8 GHz-12.4 GHz)
which is tunable. The experimental notch frequency
is 9.42 GHz and a 3-dB bandwidth of this filter is
105
MHz. The theoretical response agrees well with the
experimental response of this notch filter. The
frequency can be tuned by tuning the Gunn oscillato
rs. The Gunn oscillators being injection –locked to
the
input signal make the notch filter tracking in char
acter.
Embedded systems increasingly employ digital, analog and RF signals all of which are tightly synchronized in time. Debugging these systems is challenging in that one needs to measure a number of different signals in one or more domains (time, digital, frequency) and with tight time synchronization. This session will discuss how a digital oscilloscope can be used to effectively debug these systems, and some of the instrumentation considerations that go along with this.
This presentation demonstrate:
- Different RF receiver architectures.
- Basics of Multi-Standard receivers.
- How to select receiver's specifications from the selected standard.
- Subsampling basics.
Detecting and measuring AC signal's amplitude or phase buried in noise, as high sensitive AC Voltmeter with noise immunity.
This equipment is used by many customers like at the fields of physics and science including spectroscopic analysis.
https://www.n-denkei.com/singapore/inquiry/
Detection of RF with Human Brain FrequencySrinivasan T
This document provides information on how to detect RF that interact with human brain frequency. Most of data already validated and some need more time.
Stability under Large-Signal Conditions PresentationNMDG NV
This presentation demonstrates calibrated small-signal S-parameters extraction under large-signal conditions, performed in parallel with the calibrated large-signal measurements provided by the ZVxPlus nonlinear extension kits.
The extracted S-parameters allow calculating the different stability criteria as well as the stability circles over the full frequency bandwidth of the selected network analyser.
Using contactless probing techniques, this feature allows you to perform calibrated in-circuit voltage and current time-domain measurements under large-signal conditions, on printed-circuit boards (PCB) or on wafer, at locations which are normally unreachable using standard VNA techniques.
Using one or more high-impedance voltage probes (HIP), this feature allows you to perform calibrated in-circuit voltage time-domain measurements under large-signal conditions, on printed-circuit boards (PCB) or on wafer, at locations which are normally unreachable using standard VNA techniques.
This presentation demonstrates that the S-functions models can be visualized and used directly in MATLAB R2012A (and LabVIEW 2011) thanks to the support of the .NET framework in both environments.
Furthermore, the response of the component, represented by such a model, is fully accessible from within MATLAB (and LabVIEW) for a given set of large-signal operating points and small-signal excitation tones.
Taking advantage of the new extended multi-port measurement ICE feature, NMDG developed a patent-pending technique to accurately model the behaviour of mixers with access to the local oscillator (LO).
NMDG developed different examples illustrating that it is possible to interact with NMDG ICE software from within LabVIEW 2011 or MATLAB R2012A, thanks to the ICE Remoting library and the .NET Remoting technology.
State of ICS and IoT Cyber Threat Landscape Report 2024 previewPrayukth K V
The IoT and OT threat landscape report has been prepared by the Threat Research Team at Sectrio using data from Sectrio, cyber threat intelligence farming facilities spread across over 85 cities around the world. In addition, Sectrio also runs AI-based advanced threat and payload engagement facilities that serve as sinks to attract and engage sophisticated threat actors, and newer malware including new variants and latent threats that are at an earlier stage of development.
The latest edition of the OT/ICS and IoT security Threat Landscape Report 2024 also covers:
State of global ICS asset and network exposure
Sectoral targets and attacks as well as the cost of ransom
Global APT activity, AI usage, actor and tactic profiles, and implications
Rise in volumes of AI-powered cyberattacks
Major cyber events in 2024
Malware and malicious payload trends
Cyberattack types and targets
Vulnerability exploit attempts on CVEs
Attacks on counties – USA
Expansion of bot farms – how, where, and why
In-depth analysis of the cyber threat landscape across North America, South America, Europe, APAC, and the Middle East
Why are attacks on smart factories rising?
Cyber risk predictions
Axis of attacks – Europe
Systemic attacks in the Middle East
Download the full report from here:
https://sectrio.com/resources/ot-threat-landscape-reports/sectrio-releases-ot-ics-and-iot-security-threat-landscape-report-2024/
Smart TV Buyer Insights Survey 2024 by 91mobiles.pdf91mobiles
91mobiles recently conducted a Smart TV Buyer Insights Survey in which we asked over 3,000 respondents about the TV they own, aspects they look at on a new TV, and their TV buying preferences.
Dev Dives: Train smarter, not harder – active learning and UiPath LLMs for do...UiPathCommunity
💥 Speed, accuracy, and scaling – discover the superpowers of GenAI in action with UiPath Document Understanding and Communications Mining™:
See how to accelerate model training and optimize model performance with active learning
Learn about the latest enhancements to out-of-the-box document processing – with little to no training required
Get an exclusive demo of the new family of UiPath LLMs – GenAI models specialized for processing different types of documents and messages
This is a hands-on session specifically designed for automation developers and AI enthusiasts seeking to enhance their knowledge in leveraging the latest intelligent document processing capabilities offered by UiPath.
Speakers:
👨🏫 Andras Palfi, Senior Product Manager, UiPath
👩🏫 Lenka Dulovicova, Product Program Manager, UiPath
Epistemic Interaction - tuning interfaces to provide information for AI supportAlan Dix
Paper presented at SYNERGY workshop at AVI 2024, Genoa, Italy. 3rd June 2024
https://alandix.com/academic/papers/synergy2024-epistemic/
As machine learning integrates deeper into human-computer interactions, the concept of epistemic interaction emerges, aiming to refine these interactions to enhance system adaptability. This approach encourages minor, intentional adjustments in user behaviour to enrich the data available for system learning. This paper introduces epistemic interaction within the context of human-system communication, illustrating how deliberate interaction design can improve system understanding and adaptation. Through concrete examples, we demonstrate the potential of epistemic interaction to significantly advance human-computer interaction by leveraging intuitive human communication strategies to inform system design and functionality, offering a novel pathway for enriching user-system engagements.
LF Energy Webinar: Electrical Grid Modelling and Simulation Through PowSyBl -...DanBrown980551
Do you want to learn how to model and simulate an electrical network from scratch in under an hour?
Then welcome to this PowSyBl workshop, hosted by Rte, the French Transmission System Operator (TSO)!
During the webinar, you will discover the PowSyBl ecosystem as well as handle and study an electrical network through an interactive Python notebook.
PowSyBl is an open source project hosted by LF Energy, which offers a comprehensive set of features for electrical grid modelling and simulation. Among other advanced features, PowSyBl provides:
- A fully editable and extendable library for grid component modelling;
- Visualization tools to display your network;
- Grid simulation tools, such as power flows, security analyses (with or without remedial actions) and sensitivity analyses;
The framework is mostly written in Java, with a Python binding so that Python developers can access PowSyBl functionalities as well.
What you will learn during the webinar:
- For beginners: discover PowSyBl's functionalities through a quick general presentation and the notebook, without needing any expert coding skills;
- For advanced developers: master the skills to efficiently apply PowSyBl functionalities to your real-world scenarios.
Encryption in Microsoft 365 - ExpertsLive Netherlands 2024Albert Hoitingh
In this session I delve into the encryption technology used in Microsoft 365 and Microsoft Purview. Including the concepts of Customer Key and Double Key Encryption.
Securing your Kubernetes cluster_ a step-by-step guide to success !KatiaHIMEUR1
Today, after several years of existence, an extremely active community and an ultra-dynamic ecosystem, Kubernetes has established itself as the de facto standard in container orchestration. Thanks to a wide range of managed services, it has never been so easy to set up a ready-to-use Kubernetes cluster.
However, this ease of use means that the subject of security in Kubernetes is often left for later, or even neglected. This exposes companies to significant risks.
In this talk, I'll show you step-by-step how to secure your Kubernetes cluster for greater peace of mind and reliability.
GraphRAG is All You need? LLM & Knowledge GraphGuy Korland
Guy Korland, CEO and Co-founder of FalkorDB, will review two articles on the integration of language models with knowledge graphs.
1. Unifying Large Language Models and Knowledge Graphs: A Roadmap.
https://arxiv.org/abs/2306.08302
2. Microsoft Research's GraphRAG paper and a review paper on various uses of knowledge graphs:
https://www.microsoft.com/en-us/research/blog/graphrag-unlocking-llm-discovery-on-narrative-private-data/
PHP Frameworks: I want to break free (IPC Berlin 2024)Ralf Eggert
In this presentation, we examine the challenges and limitations of relying too heavily on PHP frameworks in web development. We discuss the history of PHP and its frameworks to understand how this dependence has evolved. The focus will be on providing concrete tips and strategies to reduce reliance on these frameworks, based on real-world examples and practical considerations. The goal is to equip developers with the skills and knowledge to create more flexible and future-proof web applications. We'll explore the importance of maintaining autonomy in a rapidly changing tech landscape and how to make informed decisions in PHP development.
This talk is aimed at encouraging a more independent approach to using PHP frameworks, moving towards a more flexible and future-proof approach to PHP development.
Observability Concepts EVERY Developer Should Know -- DeveloperWeek Europe.pdfPaige Cruz
Monitoring and observability aren’t traditionally found in software curriculums and many of us cobble this knowledge together from whatever vendor or ecosystem we were first introduced to and whatever is a part of your current company’s observability stack.
While the dev and ops silo continues to crumble….many organizations still relegate monitoring & observability as the purview of ops, infra and SRE teams. This is a mistake - achieving a highly observable system requires collaboration up and down the stack.
I, a former op, would like to extend an invitation to all application developers to join the observability party will share these foundational concepts to build on:
De-mystifying Zero to One: Design Informed Techniques for Greenfield Innovati...
Sampling based versus mixer-based front-end
1. Sampling-based
versus
Mixer-based
front-end
This slide set introduces the two common measurement techniques for
large-signal network analysis technology and discusses in details the pros
and cons of each technique.
1
2. Outline
LSNA based on Sampler-based Front-end
• Front-end
• Harmonic Sampling – Theory of Operation
Continuous Wave
Narrowband Modulation
Broadband Modulation
LSNA based on Mixer-based Front-end
• Front-end
• Theory of Operation
Conclusions
10/22/08 2
2
3. LSNA: Sampler Front-end
Acquisition System
10 MHz Synchronisation
LO
Downconverter
10/22/08 3
The broadband acquisition system consists of a sampler front-end in
combination with a low-frequency (intermediate frequency or IF) data
acquisition system.
The sampler front-end compresses broadband signals into a low-frequency
version, which then can be digitized and processed.
When dealing with large signals, additional signal conditioning is required to
keep the power incident to the samplers low enough to avoid sampler
compression. This can be realized using step attenuators.
Because of the compression of a large HF band into a limited IF band, the
signals cannot have a continuous spectrum. After sampling, it must be
possible to reconstruct the original signal and as such no overlap of spectral
content may happen during compression.
3
4. Harmonic Sampling - Signal Class: Continuous Wave
fLO=24.975 MHz = (1GHz-1MHz)/40
1 MHz
RF
2 MHz
40 fLO 80 fLO 120 fLO 3 MHz
Freq. (GHz)
1 2 3
IF Bandwidth
IF
1 2 3 10 Freq. (MHz)
10/22/08 4
Here, the harmonic sampling process is explained in more details. Suppose
one wants to acquire a signal consisting of a fundamental at 1 GHz and
containing 3 harmonics using a data acquisition with an IF bandwidth of 10
MHz.
If one uses a sampler driven at 25 MHz, one will sample the signal
(repetition rate of 1 ns) each 40 ns, corresponding to the repeated sampling
(once each 40 periods) of the same value. As a result the output will be DC.
If we now de-synchronise the sample rate, by changing it to a frequency
lower than 25 MHz, suddenly a beating signal becomes available at the
output of the sampler that can be digitized.
If we select a sample frequency of 24.975 MHz, the 1 GHz component will
result into a 1 MHz component because the 40th spectral component of the
applied sample frequency is 1 MHz away of 1 GHz. The second harmonic
will be brought down to 2 MHz because the sampling signal has a spectral
component which is 2 MHz away from 2 GHz, etc ….
4
5. Harmonic Sampling - Signal Class: Narrowband Modulation
fLO=24.975 MHz = (1GHz-1MHz)/40
1 MHz
RF
2 MHz
40 fLO 80 fLO 120 fLO 3 MHz
Freq. (GHz)
1 2 3
IF
1 2 3
Freq. (MHz)
10/22/08 5
Suppose now that the 1 GHz tone (and harmonics) is slowly modulated.
This results in skirts in the IF domain. As long as the skirts are limited (or
the modulation is mild) the signal can be detected properly (even using a
one-shot data-acquisition). When the modulation becomes broader, at a
certain moment the skirts will overlap and the original signal cannot be
reconstructed. The allowed modulation bandwidth depends on the IF
bandwidth and the number of harmonics of interest.
It is also important to notice that in “narrowband modulation”, the spacing of
the modulation frequencies at IF equals that of the spacing at RF.
5
6. Harmonic Sampling - Signal Class: Broadband Modulation
2BW
BW Adapted sampling process
RF
40 fLO 80 fLO 120 fLO
1 2 3 Freq. (GHz)
IF
Freq. (MHz)
BW of Periodic Broadband Modulation = 2* BW IF data acquisition
10/22/08 6
When the modulation is periodic the modulation spectrum is not continuous
but discrete. At that moment, with some intelligent selections of the
sampling frequency, it is possible to fold the spectrum around each
harmonic together into a bandwidth, which is only half of the modulation
bandwidth.
As such the maximum modulation bandwidth in “broadband modulation”
mode is twice the IF bandwidth.
6
7. LSNA: Mixer Front-End
Network Analyser
1 + df GHz
Mixer Front-end
...
df GHz 5 + df GHz df GHz
...
1 GHz 1 GHz
20 + df GHz
LO
Test Set
Input 1 Port 1 Port 2 Input 2 Ref Channel
DUT Synchroniser
5 GHz 5 GHz
“Fixed Phase Relationship”
1 … 20 GHz 1 … 20 GHz
10/22/08 7
Nowadays a Vector Network Analyser uses typically four receivers to
capture the incident and reflected waves at each port of the device under
test (DUT), using mixers to convert the HF spectral components to a fixed
intermediate frequency (IF), with the help of a local oscillator (LO).
As only one frequency is measured at a time, the phase relationship
between each measured spectral component is lost. To properly reconstruct
the signal at the DUT ports in nonlinear regime, one needs a phase
reference in the measurement system. This is the purpose of the
synchroniser.
The synchroniser is a very stable periodic pulse generator that generates a
comb of harmonic related spectral components in frequency domain.
Thanks to its stability, the phase relationship between each harmonic stays
fixed.
The output of the synchroniser is then captured using a fifth receiver...
7
8. Theory of Operation
nf0+df mf0+df
1
Synchroniser
reference 2
receiver
f nf0 mf0 VNA nf0 mf0
0
f0
DUT receiver
4 3
f nf0 mf0 VNA nf0 mf0
0
phase consistency between harmonics in phase consistency between receivers
by simultaneous measurement
1 2 3 one frequency at the time
10/22/08 8
Now, suppose one wants to acquire a signal at the DUT consisting of a
fundamental at f0 and containing m harmonics using a mixer-based front-
end.
The synchroniser is then excited with a continuous wave signal at f0: its
output will generate a comb of harmonic-related spectral components with
the same frequency grid than the DUT signals.
Assuming that all the receivers are capturing simultaneously the same
harmonic of all the signals at the device under test and of the synchroniser,
then the phase of this harmonic of the DUT signals can be referenced to the
phase of the harmonic of the synchroniser. The phase relationship between
the harmonics of the synchroniser is fix. As such the phase between the
harmonics of the DUT signals is being fixed.
At the end, one obtains a stable phase – coherent signals at the device
under test. One should notice that a phase calibration is still required to
properly reconstruct the phase relationship between each harmonic.
8
9. Pros and Cons
Sampler Front-end:
• Advantage: very broadband phase-coherent measurement, it
converts all spectral contents into a low-frequency version at
once
Fast phase-coherent measurement
All spectral content of a signal is captured
Relatively easy to range signal for optimal sampler operation
CW and dense modulation signals
• Disadvantage: any noise and spurious within the measurement
bandwidth is measured too.
Lower dynamic range.
10/22/08 9
The advantage of a sampler is that it converts all spectral contents into a
low-frequency version simultaneously. Because all spectral content is
downconverted, one can observe device behaviour like oscillation. Also it is
easy to detect overranging which is important to keep the sampler in its
linear domain of operation.
The disadvantage is that it converts at the same time any noise and
spurious within the measurement bandwidth. This reduces the dynamic
range of the system.
9
10. Pros and Cons (continued)
Mixer Front-end:
• Advantage: narrowband measurement, optimized around each
frequency
High dynamic range
CW and modulation signals, limited by synchroniser
• Disadvantage: only one spectral component measured at a time
Slower measurement, dependent on number of spectral
components to measure
Requires reference signal with similar spectral content as signal
to measure
Reference signal, mixers, LO may not drift during measurement
Only specified spectral components are measured, e.g.
oscillation cannot be observed
10/22/08 10
At the other hand, the advantage of a mixer-based front-end is its
narrowband measurement principle that allows high dynamic range.
The main disadvantage is that only one frequency is measured at a time
which slows down the measurement speed. This can be important when
many tones need to be measured under periodic modulation conditions.
Also it is important that mixers, local oscillator, synchroniser stay very stable
during a measurement sweep to correctly reconstruct the signals.
10
11. Conclusions
Large-signal network analysis provides a uniform way to
characterise the input - output behaviour of nonlinear HF
components under almost realistic conditions
Two common measurement system exist:
• The LSNA sampler-based system allows fast characterisation of
nonlinear behaviour both in continuous wave and dense modulation
modes. However, the dynamic range suffers from the use of a
broadband measurement technique.
• The LSNA mixer-based system allows to characterise nonlinear
behaviour both in continuous wave and modulation modes, on a
specified frequency grid. While the dynamic range benefits from this
narrowband measurement technique, the system can only measure
one spectral component at a time, resulting in lower measurement
speed and possibly missing information.
10/22/08 11
11