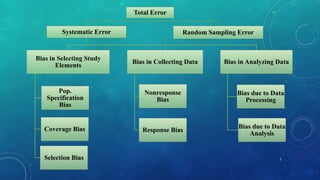
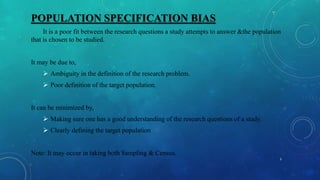
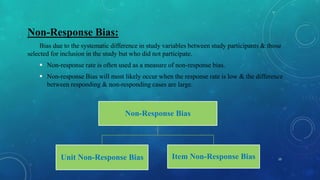
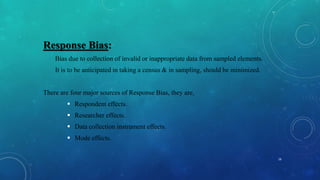
Non Sampling Error
Wahengbam Bigyananda Meitei
Mrinmoy Pratim Bharadwaz
MSc. Biostatistics & Demography 2015-17
1
INTERNATIONAL INSTITUTE FOR POPULATION SCIENCE
MUMBAI
Total Error
Systematic Error
Bias in Selecting Study
Elements
Pop.
Specification
Bias
Coverage Bias
Selection Bias
Bias in Collecting Data
Nonresponse
Bias
Response Bias
Bias in Analyzing Data
Bias due to Data
Processing
Bias due to Data
Analysis
Random Sampling Error
2
POPULATION SPECIFICATION BIAS
It is a poor fit between the research questions a study attempts to answer &the population
that is chosen to be studied.
It may be due to,
 Ambiguity in the definition of the research problem.
 Poor definition of the target population.
It can be minimized by,
 Making sure one has a good understanding of the research questions of a study.
 Clearly defining the target population
Note: It may occur in taking both Sampling & Census.
3
COVERAGE BIAS
It is the lack of one-to-one correspondence between the elements in the target population & the
elements encompassed by the respondent selection procedures used in the study.
It is often referred to as frame error.
It is divided into 4 types,
 Over Coverage Bias
 Under Coverage Bias
 Multiple Coverage Bias
 Clustered Frame Bias
Note: It may occur in taking a Census & in Sampling.
4
Over Coverage Bias:
Bias due to the use of sampling frame that includes elements that are not members of the
target population of the study.
 It will affect the incidence rate for the study.
 It is not discovered until the data collection phase of the study.
Under Coverage Bias:
Bias due to the use of sampling frame that does not include elements that are not members of
the target population of the study.
 A Census would have under coverage bias if elements of the population are inaccessible &
are excluded from the study.
 It may lead to a decrease in the sample size, thus affecting the random sampling error.
5
Multiple Coverage Bias:
Bias due to the use of a sampling frame that includes elements more than once.
 It may occur in taking both Census & Sampling.
Clustered Frame Bias:
Bias due to the use of sampling frame that includes units with more than one elements of the
target population.
 Correlated observation are produce.
 Violates the assumptions of independent selection of the sampling unit.
 Multiple Coverage makes for overrepresentation, Clustering makes for
underrepresentation.
 It is almost impossible to identify clustered elements before selection, making it difficult
to control the sample size.
6
Over Coverage Bias may be minimized by,
 Thoroughly reviewing & cleaning the sampling frame &dropping all ineligibles that are
discovered (eg, Screening before selection).
 Screening respondents during data collection to ensure membership in the population(eg,
Screening after selection).
 If the number of ineligible is large, one can use dual sampling frame.
Under Coverage Bias may be minimized by,
 To utilize dual sampling frame or multiple sampling frame.
 Comprehensive training & supervision of data collectors.
 To ignore the omission and/or redefined the target population to fit the frame.
 If resources are available, one may utilize external sources to supplement the frame.
7
Multiple Coverage Bias may be minimized by,
 Thoroughly cross-checking & cleaning the sampling frame.
 All duplicated elements may be weighted by the inverse of their chance of selection.
Clustered Frame Bias may also be controlled via weighting.
8
Selection Bias:
Bias due to systematic difference in the characteristics of population elements that are
selected to be included in the study and population elements that are not selected.
 Selection bias is very much a part of a sampling.
 Non-probability sampling is likely to have a great deal of Selection bias.
 Probability sampling, when elements are selected with unequal probabilities.
To minimize Selection Bias,
 To take Census.
 By using probability sampling with equal probability selection.
 Effective training & supervision of data collectors.
 Effective implementation of comprehensive quality control procedures.
9
Non-Response Bias:
Bias due to the systematic difference in study variables between study participants & those
selected for inclusion in the study but who did not participate.
 Non-response rate is often used as a measure of non-response bias.
 Non-response Bias will most likely occur when the response rate is low & the difference
between responding & non-responding cases are large.
10
Non-Response Bias
Unit Non-Response Bias Item Non-Response Bias
Unit Non-Response Bias:
Bias resulting from the failure of the researcher to successfully collect any data or a sufficient
amount of data from elements selected to be included in a study.
For eg, Unreturned mailed questionnaire or returned with so little data.
Item Non-Response Bias:
Bias resulting from the failure to obtain the desire information on an item for which information is
sought.
For eg, Unanswered questionnaire items.
11
Sources of Non-Response Bias:
Both Unit & Item Non-Response have overlapping causes. These overlapping causes
include,
 Mistake
 Inability to contact
 Inability to respond
 Refusal to respond
 Researcher effect
 Mode Effect
12
To minimize the mistakes,
 Improved training & supervision.
 Application of quality design principles in preparation of instrument and instructions.
 Extensive data cleaning procedures to detect & correct mistakes.
To minimize the inability to contact,
 Repeating callbacks at different times & different days.
 Improving the scheduling & protocols of data collections attempts.
 Using the most current sampling frame possible & updating where necessary.
 Using mixed-methods to contact elements.
 Replacing non-Respondents in the current study with non-respondents fro the previous study.
 Substituting non-respondents with other elements of the population.
Substitution should be carefully used. 13
To minimize the Refusal rates,
 Repeated call-backs at different times and different days.
 Pre-notification.
 Follow-up reminders.
 Assurance of confidentiality and anonymity.
 Short induction justifying the study.
 Emphasis on the study purpose and sponsor.
 Use of “cooling off period ” for call-backs with more experienced data collectors.
 Placement of dull, sensitive and threatening items at the end of the data collection instruments.
 Leaving message on voice mail, answering machines etc.
 Effective refusal conversion training of data collectors.
14
 Assigning specially trained refusal conversion data collectors to specific cases.
 Matching data collector’s observable attributes(e.g. age, gender and race) with the characteristics of
respondents.
 Appeals to altruism.
 Holding community meetings to discuss the purposes of the research.
 Use of short instrument and placing emphasis of this fact.
 Including return postage and return envelope.
 Personalization.
 Incentives, especially prepayments monetary incentives versus post-payment monetary incentives
and nonmonetary incentives.
 Improved training and supervision of the data collectors.
15
Response Bias:
Bias due to collection of invalid or inappropriate data from sampled elements.
It is to be anticipated in taking a census & in sampling, should be minimized.
There are four major sources of Response Bias, they are,
 Respondent effects.
 Researcher effects.
 Data collection instrument effects.
 Mode effects.
16
Response Bias can be minimized by,
 Designing data collection procedures & instruments via a respondent centered approach.
 Comprehensive training of data collectors.
 Incorporating a quality control system during data collection.
 Extensive data cleaning including validity & reliability checking.
 Using external data sources to detect & correct error once identified.
17
To minimize Data Processing Error,
Errors may be made during the processing of data.
 Effective training, and
 Implementing comprehensive quality control procedures.
To minimize Data Analysis Error,
 Utilizing redundant quality control procedures.
 Recheck or double checking the work of editors, coders & data entry personnel.
 Care should be taken to make sure that assumptions that relate to level of measurement,
type of sampling used, and sample size – are specified.
18
19

Non sampling error

  • 1.
    Non Sampling Error WahengbamBigyananda Meitei Mrinmoy Pratim Bharadwaz MSc. Biostatistics & Demography 2015-17 1 INTERNATIONAL INSTITUTE FOR POPULATION SCIENCE MUMBAI
  • 2.
    Total Error Systematic Error Biasin Selecting Study Elements Pop. Specification Bias Coverage Bias Selection Bias Bias in Collecting Data Nonresponse Bias Response Bias Bias in Analyzing Data Bias due to Data Processing Bias due to Data Analysis Random Sampling Error 2
  • 3.
    POPULATION SPECIFICATION BIAS Itis a poor fit between the research questions a study attempts to answer &the population that is chosen to be studied. It may be due to,  Ambiguity in the definition of the research problem.  Poor definition of the target population. It can be minimized by,  Making sure one has a good understanding of the research questions of a study.  Clearly defining the target population Note: It may occur in taking both Sampling & Census. 3
  • 4.
    COVERAGE BIAS It isthe lack of one-to-one correspondence between the elements in the target population & the elements encompassed by the respondent selection procedures used in the study. It is often referred to as frame error. It is divided into 4 types,  Over Coverage Bias  Under Coverage Bias  Multiple Coverage Bias  Clustered Frame Bias Note: It may occur in taking a Census & in Sampling. 4
  • 5.
    Over Coverage Bias: Biasdue to the use of sampling frame that includes elements that are not members of the target population of the study.  It will affect the incidence rate for the study.  It is not discovered until the data collection phase of the study. Under Coverage Bias: Bias due to the use of sampling frame that does not include elements that are not members of the target population of the study.  A Census would have under coverage bias if elements of the population are inaccessible & are excluded from the study.  It may lead to a decrease in the sample size, thus affecting the random sampling error. 5
  • 6.
    Multiple Coverage Bias: Biasdue to the use of a sampling frame that includes elements more than once.  It may occur in taking both Census & Sampling. Clustered Frame Bias: Bias due to the use of sampling frame that includes units with more than one elements of the target population.  Correlated observation are produce.  Violates the assumptions of independent selection of the sampling unit.  Multiple Coverage makes for overrepresentation, Clustering makes for underrepresentation.  It is almost impossible to identify clustered elements before selection, making it difficult to control the sample size. 6
  • 7.
    Over Coverage Biasmay be minimized by,  Thoroughly reviewing & cleaning the sampling frame &dropping all ineligibles that are discovered (eg, Screening before selection).  Screening respondents during data collection to ensure membership in the population(eg, Screening after selection).  If the number of ineligible is large, one can use dual sampling frame. Under Coverage Bias may be minimized by,  To utilize dual sampling frame or multiple sampling frame.  Comprehensive training & supervision of data collectors.  To ignore the omission and/or redefined the target population to fit the frame.  If resources are available, one may utilize external sources to supplement the frame. 7
  • 8.
    Multiple Coverage Biasmay be minimized by,  Thoroughly cross-checking & cleaning the sampling frame.  All duplicated elements may be weighted by the inverse of their chance of selection. Clustered Frame Bias may also be controlled via weighting. 8
  • 9.
    Selection Bias: Bias dueto systematic difference in the characteristics of population elements that are selected to be included in the study and population elements that are not selected.  Selection bias is very much a part of a sampling.  Non-probability sampling is likely to have a great deal of Selection bias.  Probability sampling, when elements are selected with unequal probabilities. To minimize Selection Bias,  To take Census.  By using probability sampling with equal probability selection.  Effective training & supervision of data collectors.  Effective implementation of comprehensive quality control procedures. 9
  • 10.
    Non-Response Bias: Bias dueto the systematic difference in study variables between study participants & those selected for inclusion in the study but who did not participate.  Non-response rate is often used as a measure of non-response bias.  Non-response Bias will most likely occur when the response rate is low & the difference between responding & non-responding cases are large. 10 Non-Response Bias Unit Non-Response Bias Item Non-Response Bias
  • 11.
    Unit Non-Response Bias: Biasresulting from the failure of the researcher to successfully collect any data or a sufficient amount of data from elements selected to be included in a study. For eg, Unreturned mailed questionnaire or returned with so little data. Item Non-Response Bias: Bias resulting from the failure to obtain the desire information on an item for which information is sought. For eg, Unanswered questionnaire items. 11
  • 12.
    Sources of Non-ResponseBias: Both Unit & Item Non-Response have overlapping causes. These overlapping causes include,  Mistake  Inability to contact  Inability to respond  Refusal to respond  Researcher effect  Mode Effect 12
  • 13.
    To minimize themistakes,  Improved training & supervision.  Application of quality design principles in preparation of instrument and instructions.  Extensive data cleaning procedures to detect & correct mistakes. To minimize the inability to contact,  Repeating callbacks at different times & different days.  Improving the scheduling & protocols of data collections attempts.  Using the most current sampling frame possible & updating where necessary.  Using mixed-methods to contact elements.  Replacing non-Respondents in the current study with non-respondents fro the previous study.  Substituting non-respondents with other elements of the population. Substitution should be carefully used. 13
  • 14.
    To minimize theRefusal rates,  Repeated call-backs at different times and different days.  Pre-notification.  Follow-up reminders.  Assurance of confidentiality and anonymity.  Short induction justifying the study.  Emphasis on the study purpose and sponsor.  Use of “cooling off period ” for call-backs with more experienced data collectors.  Placement of dull, sensitive and threatening items at the end of the data collection instruments.  Leaving message on voice mail, answering machines etc.  Effective refusal conversion training of data collectors. 14
  • 15.
     Assigning speciallytrained refusal conversion data collectors to specific cases.  Matching data collector’s observable attributes(e.g. age, gender and race) with the characteristics of respondents.  Appeals to altruism.  Holding community meetings to discuss the purposes of the research.  Use of short instrument and placing emphasis of this fact.  Including return postage and return envelope.  Personalization.  Incentives, especially prepayments monetary incentives versus post-payment monetary incentives and nonmonetary incentives.  Improved training and supervision of the data collectors. 15
  • 16.
    Response Bias: Bias dueto collection of invalid or inappropriate data from sampled elements. It is to be anticipated in taking a census & in sampling, should be minimized. There are four major sources of Response Bias, they are,  Respondent effects.  Researcher effects.  Data collection instrument effects.  Mode effects. 16
  • 17.
    Response Bias canbe minimized by,  Designing data collection procedures & instruments via a respondent centered approach.  Comprehensive training of data collectors.  Incorporating a quality control system during data collection.  Extensive data cleaning including validity & reliability checking.  Using external data sources to detect & correct error once identified. 17
  • 18.
    To minimize DataProcessing Error, Errors may be made during the processing of data.  Effective training, and  Implementing comprehensive quality control procedures. To minimize Data Analysis Error,  Utilizing redundant quality control procedures.  Recheck or double checking the work of editors, coders & data entry personnel.  Care should be taken to make sure that assumptions that relate to level of measurement, type of sampling used, and sample size – are specified. 18
  • 19.