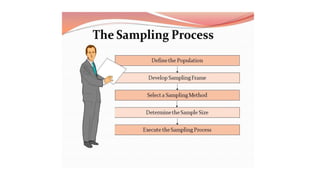
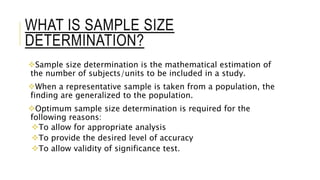
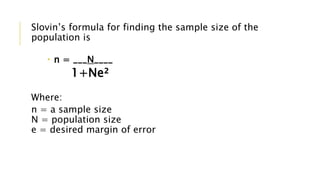
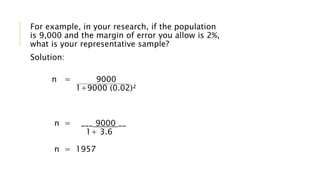
What is sampling?
Sampling is the act, process, or technique of selecting a suitable sample, or a representative part of a population for the purpose of determining parameters or characteristics of the whole population.
Characteristics of a good sample
-True representative
-Free from bias
-Accurate
-Comprehensive
-Approachable
-Good size
-Feasible
-Goal orientation
-Practical and economical
Sampling Error
A sampling error is a statistical error that occurs when an analyst does not select a sample that represents the entire population of data and the results found in the sample do not represent the results that would be obtained from the entire population.
and many more things about the sampling technique.
2. WHAT IS
SAMPLING?
NEED OF SAMPLING
Saves time, money and effort
More effective
Faster
More accurate
Gives more comprehensive information
To bring the population to a manageable number
To help in minimizing error from the despondence due to
large number in the population
Sampling is the act, process, or technique of
selecting a suitable sample, or a representative
part of a population for the purpose of
determining parameters or characteristics of the
whole population.
3. BASIC TERMINOLOGIES
• POPULATION
A population is the total group of people about who you are
researching and about which you want to draw conclusions.
• SAMPLE
A part of the population which is examined to estimate the
characteristics of the population is called a sample.
• SAMPLING FRAME
The actual set of units and a list containing every member of
the population from which a sample is drawn at random is
called a sampling frame.
• SAMPLE UNIT
Every sample is made up of several members or
components known as sampling units.
4. • SAMPLE DESIGN
Designing a plan for effectively drawing out a sample
from the sampling frame is called sample design.
• SAMPLE SIZE
The total number of elements of the population to be
included in the sample for conducting the research
study is known as sample size.
5.
6. CHARACTERISTICS OF A GOOD SAMPLE
True representative
Free from bias
Accurate
Comprehensive
Approachable
Good size
Feasible
Goal orientation
Practical and economical
7. True representative:- The true representative of the
population and matching its properties is termed as
good sample where aggregate of certain properties is
the population and sample is the sub-total of the
universe.
Free from Bias:- A good sample does not allows
prejudices , pre-conceptions ,and imaginations which
affects its choice and it is unbiased.
Accurate:- A sample is called good when it yields
accurate estimates or statistics and free from errors.
Comprehensive:- A sample that is true representative
of the population is also comprehensive in nature
which is controlled by definite purpose of
investigation.
Approachable:- The subjects of good sample is such
are easily accessible where the tools of research are
easily conducted and easy collection of data is
possible .
8. Feasible:- A good sample creates the research work
more feasible.
Goal orientation :- Any sample which is selected by the
researcher should be able to satisfy the objective of the
research. The sample should be taken in proper number
. It should be customized to fit the environment under
which the research is going to be conducted.
Practical :- It means that the concepts of sample
selection should be applied properly while conducting
the research .the researcher should be well experienced
end well instructed. The instructions which are passed
to observer should be clear ,complete and correct in all
terms so avoid errors and biasness on their part .the
sample should be selected on basis of the sample
design.
Economical :- It refers that the research should not
incur huge costs ,time or efforts. One of the objectives
of any research is to complete the research with
10. SAMPLING ERROR
A sampling error is a statistical error that occurs when an analyst does not
select a sample that represents the entire population of data and the
results found in the sample do not represent the results that would be
obtained from the entire population.
EXAMPLE-
Imagine that you want to know the average height of men on earth. This
average height exists but obviously you will never be able to know it
(unless you're able to measure several millions men...). What you can do is
measure hundreds or thousands of people and calculate the average
height of these people. The average height among these people is
probably not exactly equal to the average height of men on earth (because
they are particular men in the whole population) but, if you did a good job
(use a representative sample of the population), it should be close
enough. The difference between the quantity that you want to know
(average height of men on earth) and its estimation through your sample
11. FIVE COMMON TYPES OF SAMPLING
ERRORS
Population Specification Error—This error occurs when the researcher
does not understand who they should survey. For example, imagine a
survey about breakfast cereal consumption. Who to survey? It might be
the entire family, the mother, or the children. The mother might make
the purchase decision, but the children influence her choice.
Sample Frame Error—A frame error occurs when the wrong sub-
population is used to select a sample. A classic frame error occurred in
the 1936 presidential election between Roosevelt and Landon. The
sample frame was from car registrations and telephone directories. In
1936, many Americans did not own cars or telephones, and those who
did were largely Republicans. The results wrongly predicted a
Republican victory.
12. Selection Error—This occurs when respondents self-select their
participation in the study – only those that are interested respond.
Selection error can be controlled by going extra lengths to get
participation. A typical survey process includes initiating pre-survey
contact requesting cooperation, actual surveying, and post-survey follow-
up. If a response is not received, a second survey request follows, and
perhaps interviews using alternate modes such as telephone or person-
to-person.
Non-Response—Non-response errors occur when respondents are
different than those who do not respond. This may occur because either
the potential respondent was not contacted or they refused to respond.
The extent of this non-response error can be checked through follow-up
surveys using alternate modes.
Sampling Errors—These errors occur because of variation in the number
or representativeness of the sample that responds. Sampling errors can
be controlled by
(1) careful sample designs,
(2) large samples, and
(3) multiple contacts to assure representative response.
14. NON SAMPLING ERROR
Non -sampling error is the error that arises in data
collection process as a result of factors other than
taking a sample.
Non- sampling errors have the potential to cause bias
in polls, surveys or samples.
15. TYPE OF NON SAMPLING ERROR
Coverage Error
Response Error
Non Response Error
Measurement Error
Data Processing Error
Data Analysis Error
16. COVERAGE ERROR
Coverage errors are non sampling errors and result in
bias, affecting the representativity of the data.
Coverage errors may occur in data collected through
both censuses and sample surveys.
In censuses, errors of coverage comprise the under
enumeration or (less commonly) the over enumeration of
individuals in the population.
17. RESPONSE ERROR
Sometimes respondent do not provide pertinent
information during the survey.
Response errors may be accidental.
They may arise due to self- interest or prestige bias of the
respondents or due to the bias of the interviewer.
Due to these factors respondents furnish wrong
information.
18. NON –RESPONSE ERROR
Non response errors occur when the respondent is not
available at home or the researcher is not in a position to
contact him due to some other reason.
Non response errors also occur when respondents refuse to
answer certain questions which are important from the
researchers point of view.
As a result, it becomes difficult to obtain complete
information. Due to this very important part of the sample
do not provide relevant and required information and this
leads to non sampling errors.
19. MEASUREMENT ERROR
The measurement error is defined as the difference
between the true or actual value and the measured value.
The true value is the average of the infinite number of
measurements, and the measured value is the precise
value.
20. DATA PROCESSING ERROR
Data processing refers to the process of systematic
categorization of data to make the process of analysis
easier and more accurate.
However, errors may occur at the time of categorizing data
such as, drawing up of tables, coding response etc.
21. DATA ANALYSIS ERROR
Data analysis errors may be defined as those errors that
arise due to the application of incorrect statistical
techniques or formulae that give the wrong result.
These errors may be simple as well as complex.
23. Reducing Sampling Errors
1.Increasing the size of the sample: The sampling error can be
reduced by increasing the sample size. If the sample size n is equal
to the population size , then the sampling error is zero.
2.Stratification: When the population contains homogeneous units,
a simple random sample is likely to be representative of the
population. But if the population contains dissimilar units, a simple
random sample may fail to be representative of all kinds of units in
the population. To improve the result of the sample, the sample
design is modified. The population is divided into different groups
containing similar units, and these groups are called strata. From
each group (stratum), a sub-sample is selected in a random
manner. Thus all groups are represented in the sample and the
sampling error is reduced. This method is called stratified-random
sampling. The size of the sub-sample from each stratum is
frequently in proportion to the size of the stratum.
METHODS TO REDUCE THE
ERRORS
24. Stratum
#
Size of stratum
Size of sample from
each stratum
1 N1=600N1=600
n1=n×N1N=100×600
1000=60n1=n×N1N
=100×6001000=6
0
2 N2=400N2=400
n2=n×N2N=100×400
1000=40n2=n×N2N
=100×4001000=4
0
N1+N2=N=1000N
1+N2=N=1000
n1+n2=n=100n1+n2
=n=100
1. Suppose a population consists of 1000 students, out of
which 600 are intelligent and 400 are unintelligent. We are
assuming here that we do have much information about the
population. A stratified sample of size n=100 is to be
selected the size of stratum is denoted by N1 and N2
respectively and the size of sample from each stratum is
denoted by n1 and n2 . It is written as : n=
25. - Introducing consistency checks
- Performing sample check
- Carrying out post-census and post-survey checks
- Performing external record check
-Introducing the scheme of interpenetrating sub-
samples
- Providing detailed guidelines for data collection and
data processing
- Imparting proper training to the field workers and
data processing personnel
REDUCING NON SAMPLING ERRORS
27. PROBABILITY SAMPLING
Probability Sampling is a sampling technique in which
sample from a larger population are chosen using a
method based on the theory of probability. For a
participant to be considered as a probability sample,
he/she must be selected using a random selection.
The most important requirement of probability sampling is
that everyone in your population has a known and an equal
chance of getting selected.
28. Let us take an example to understand this
sampling technique. The population of the US
alone is 330 million, it is practically impossible
to send a survey to every individual to gather
information but you can use probability sampling
to get data which is as good even if it is collected
from a smaller population.
29. TYPES OF PROBABILITY SAMPLING
SIMPLE
RANDOM
SYSTEMATI
C
CLUSTER
AREA
STRATIFIED
RANDOM
30. SIMPLE RANDOM SAMPLING:-
Simple random sampling is the easiest form of probability
sampling . All the researcher needs to do is assure that all
the members of the population are included in the list and
then randomly select the desired number of subjects.
SYSTEMATIC SAMPLING:-
Systematic random sampling can be likened to an
arithmetic progression wherein the difference between any
two consecutive numbers is the same. Say for example you
are in a clinic and you have 100 patients.
31. The first thing you do is pick an integer that is less than
the total number of the population; this will be your first
subject e.g. (3). Select another integer which will be the
number of individuals between subjects e.g. (5). You
subjects will be patients 3, 8, 13, 18, 23, and so on.
CLUSTER SAMPLING:-
Cluster random sampling is a way to randomly select
participants when they are geographically spread out. For
example, if you wanted to choose 100 participants from
the entire population of the U.S., it is likely impossible to
get a complete list of everyone. Instead, the researcher
randomly selects areas (i.e. cities or counties) and
randomly selects from within those boundaries.
32. AREA SAMPLING
A method in which an area to be sampled is sub-divided
into smaller blocks that are then selected at random and
then again sub-sampled or fully surveyed. This method is
typically used when a complete frame of reference is not
available to be used.
STRATIFIED RANDOM:-
Stratified random sampling is a method of sampling that
involves the division of a population into smaller sub-
groups known as strata. In stratified random sampling or
stratification, the strata are formed based on members'
shared attributes or characteristics such as income or
educational attainment.
Stratified random sampling is also called proportional
random sampling or quota random sampling.
34. NON-PROBABILITY SAMPLING
Non –probability sampling is the sampling procedure which
does not have any ground for estimating the probability that
whether or not each item in the population has been
included in the sample.
In simples words, non-probability sampling is a sampling
technique where the samples are gathered in a process that
does not give all the individuals in the population equal
chances of being selected
Types:
1. Convenience Sampling
2. Purposive Sampling
3. Panel Sampling
35. CONVENIENCE
SAMPLING
Advantage:-
1. Economical
2. Proper Representation
3. Avoid Irrelevant Items
4. Accurate Results
Disadvantage:-
1. Personal Bias
2. No Equal Chance
3. No Degree of Accuracy
4. No Possibility of Sample
Error
A statistical method of drawing representative data by selecting
people because of the ease of their volunteering or selecting units
because of their availability or easy access.
36. PURPOSIVE SAMPLING
Advantage :-
Suitable for Small Sampling
Units.
Studying Unknown Traits of
Population.
Solving Everyday Business
Problems.
Disadvantage:-
Non-Scientific.
No Method To Calculate
Sampling Error.
A non-probability sampling which follows certain norms. It is of two
types:
Judgment Sampling:-
Judgmental sampling is a non-probability sampling
technique where the researcher selects units to be sampled
based on their knowledge and professional judgment.
37. Quota Sampling:-
Quota sampling is a non-probability
sampling technique wherein the assembled sample has the same
proportions of individuals as the entire population with respect to
known characteristics, traits or focused phenomenon.
Advantages:-
Economical.
Administratively Convenient.
Minimum Memory Errors.
Independent.
Disadvantages:-
Difficulty in Calculating Standard
Error.
Difficulty in Obtaining Representative
Sample.
Hampers Quality of Work.
38. SNOWBALL SAMPLING
Snowball sampling is a popular business study
method. The snowball sampling method is extensively used
where a population is unknown and rare and it is tough to
choose subjects to assemble them as samples for research
Types of Snowball Sampling:-
Linear Snowball Sampling: The formation of a sample group starts with
one individual subject providing information about just one other
subject and then the chain continues with only one referral from one
subject. This pattern is continued until enough number of subjects are
available for the sample.
Exponential Non-Discriminative Snowball Sampling: In this type, the
first subject is recruited and then he/she provides multiple referrals.
Each new referral then provides with more data for referral and so on,
until there is enough number of subjects for the sample.
Exponential Discriminative Snowball Sampling: In this technique, each
subject gives multiple referrals, however, only one subject is recruited
from each referral. The choice of a new subject depends on the nature
39. ADVANTAGES:-
Identifying and selecting prospective respondents.
Useful in qualitative research.
Needs little planning.
Less costly.
Disadvantage:-
Biased.
Limited Data Structure.
Limited Control.
Researcher has no Idea of
Distribution.
40. PANEL SAMPLING
In panel sampling a group of participants are selected
initially by random sampling method and the same group is
asked for the same information repeated no. of times
during that period of time . This sample is semi-permanent
where members are included repeatedly for iterative
studies.
Advantages:-
Saves Cost and Time.
Helps in Measuring Changes.
Helps In Tracing Shift in Behavior.
Disadvantages:-
Not Representative.
Members become Conditioned.
Difficult to Preserve Representative
Character of Panel.
42. WHAT IS SAMPLE SIZE?
This is the sub-population to be studied in order to make an
inference to a reference population(A broader population to
which the findings from a study are to be generalized)
In census, the sample size is equal to the population size.
However, in research, because of time constraint and budget, a
representative sample are normally used.
The larger the sample size the more accurate the findings from
a study.
Availability of resources sets the upper limit of the sample size.
While the required accuracy sets the lower limit of sample size
Therefore, an optimum sample size is an essential component
of any research.
43. WHAT IS SAMPLE SIZE
DETERMINATION?
Sample size determination is the mathematical estimation of
the number of subjects/units to be included in a study.
When a representative sample is taken from a population, the
finding are generalized to the population.
Optimum sample size determination is required for the
following reasons:
To allow for appropriate analysis
To provide the desired level of accuracy
To allow validity of significance test.
44. Slovin’s formula for finding the sample size of the
population is
n = ___N____
1+Ne²
Where:
n = a sample size
N = population size
e = desired margin of error
45. For example, in your research, if the population
is 9,000 and the margin of error you allow is 2%,
what is your representative sample?
Solution:
n = 9000
1+9000 (0.02)²
n = ___ 9000 __
1+ 3.6
n = 1957