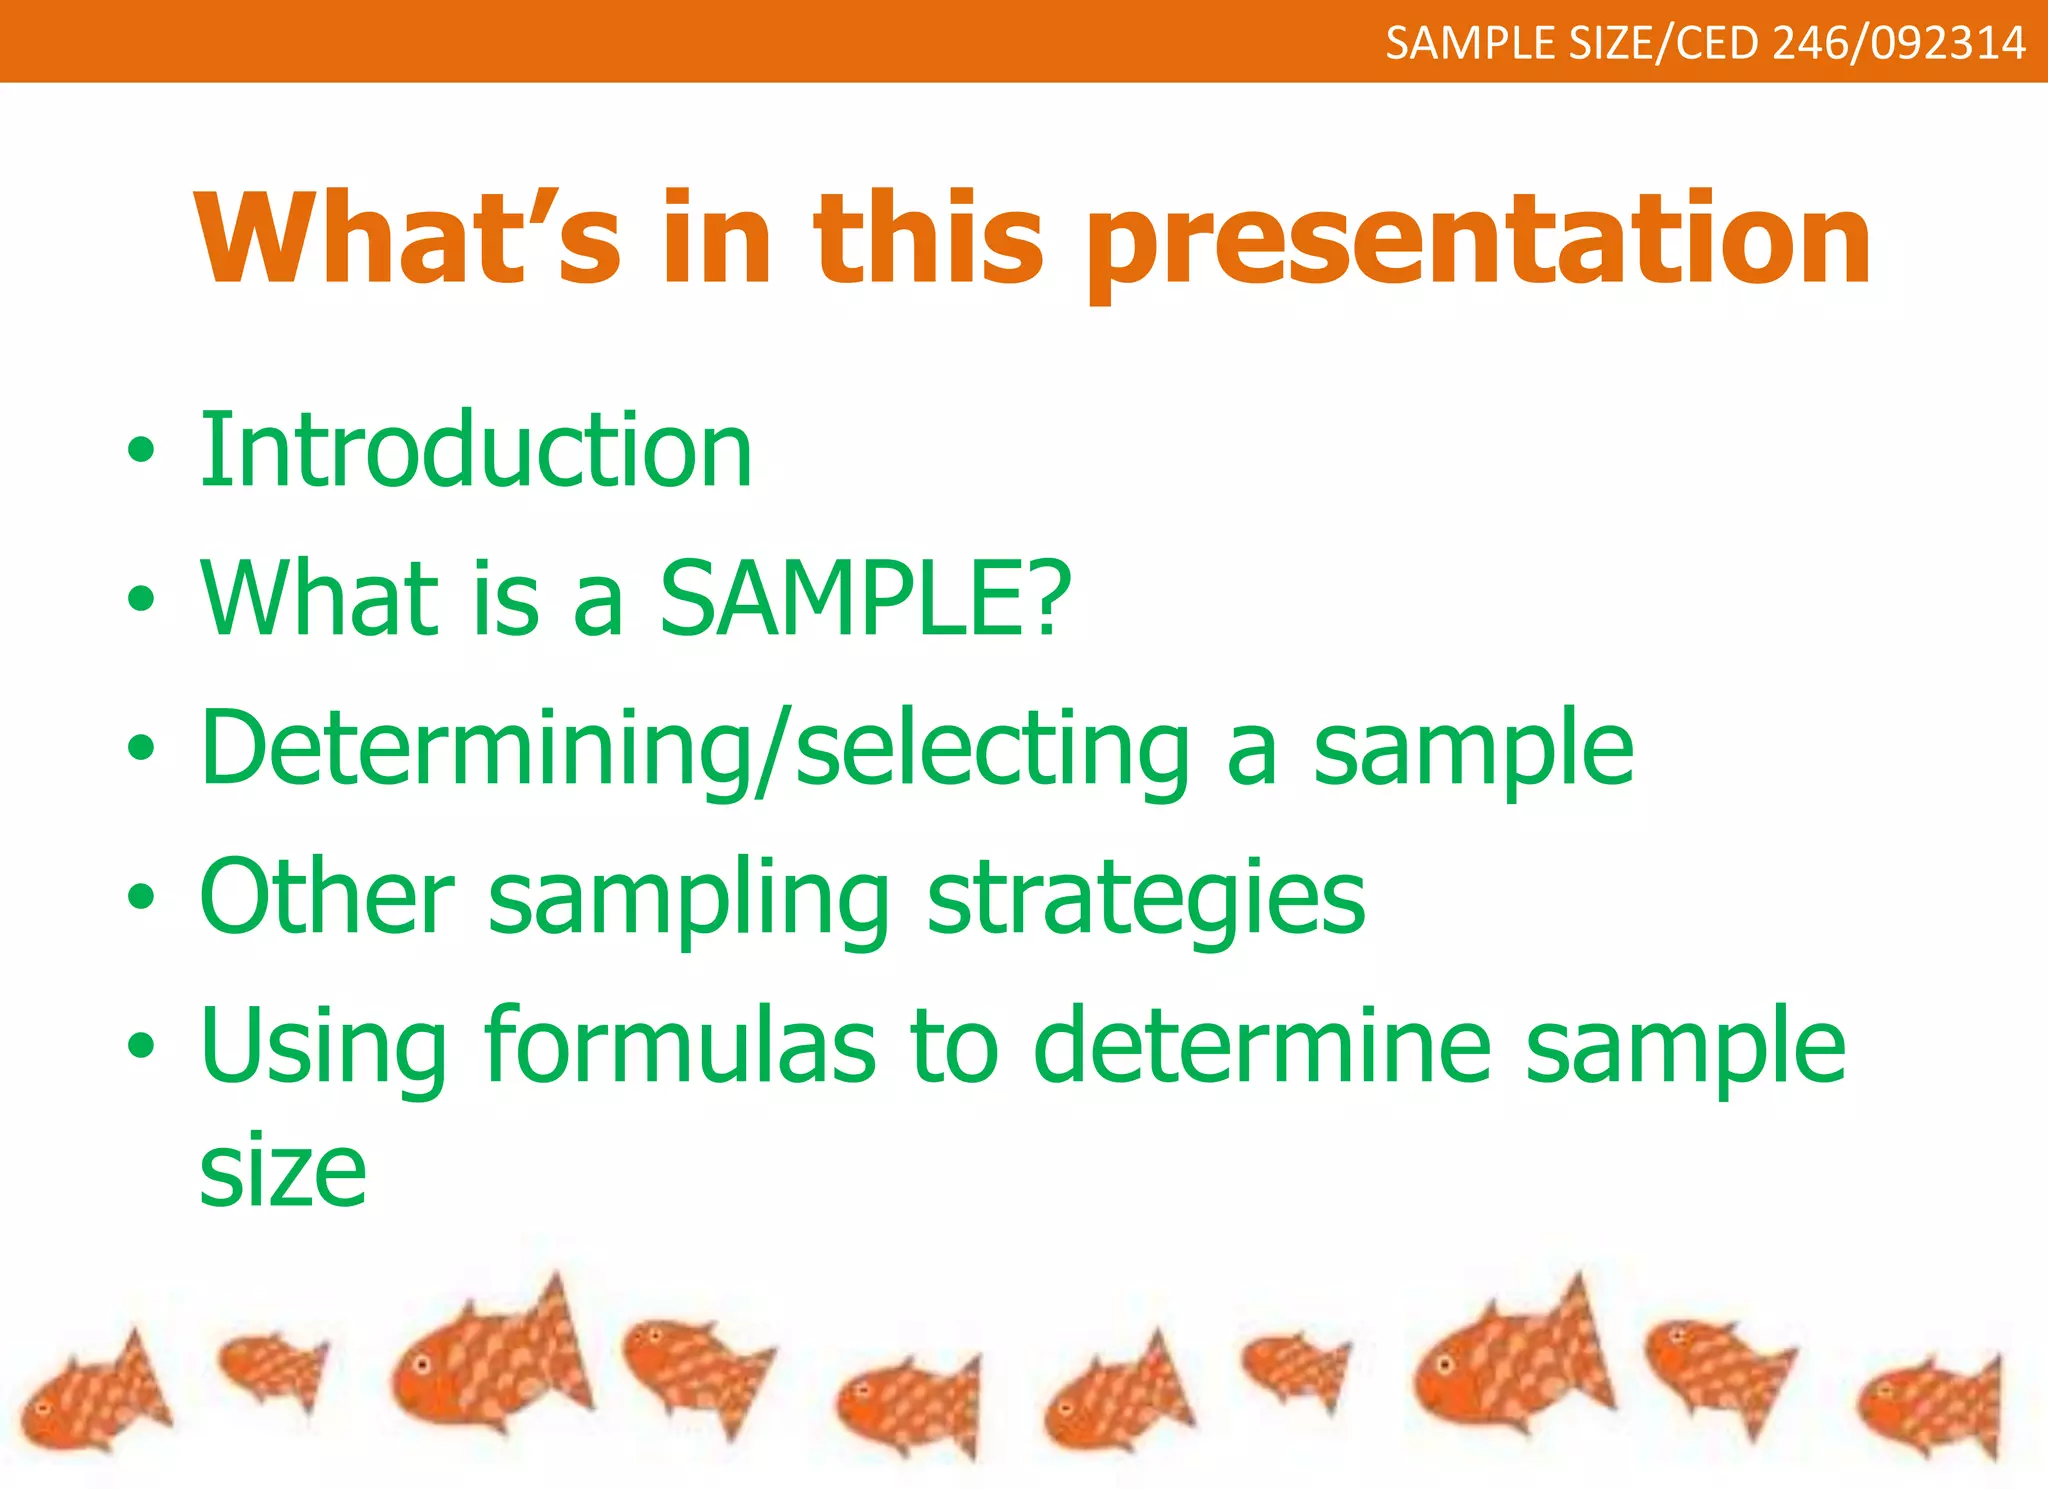
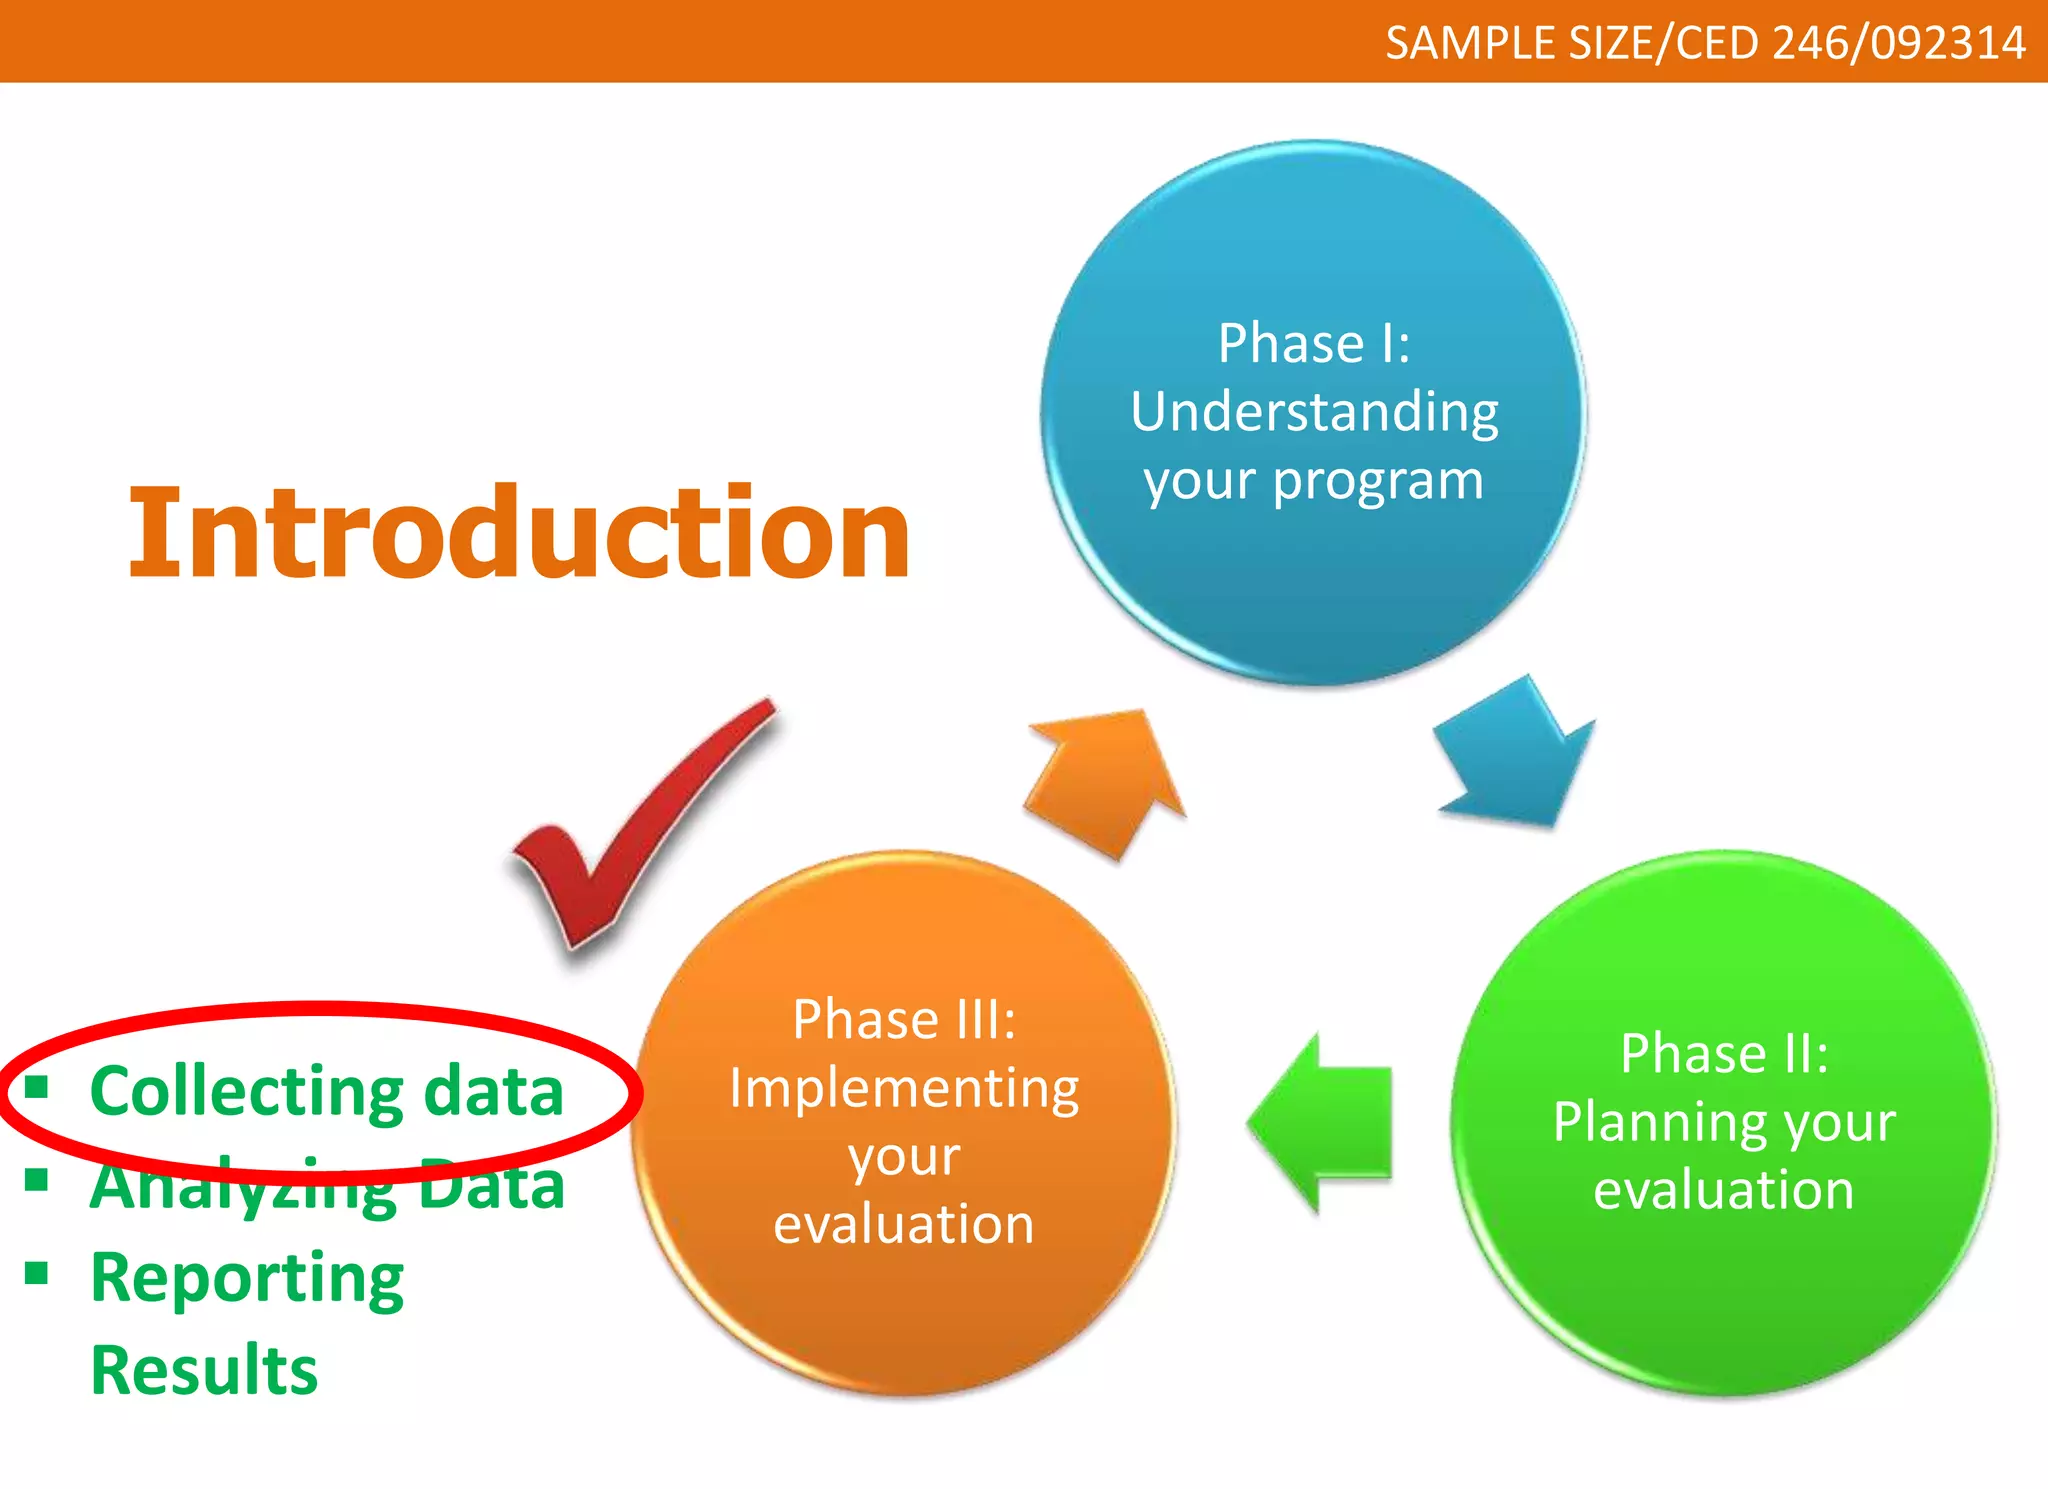
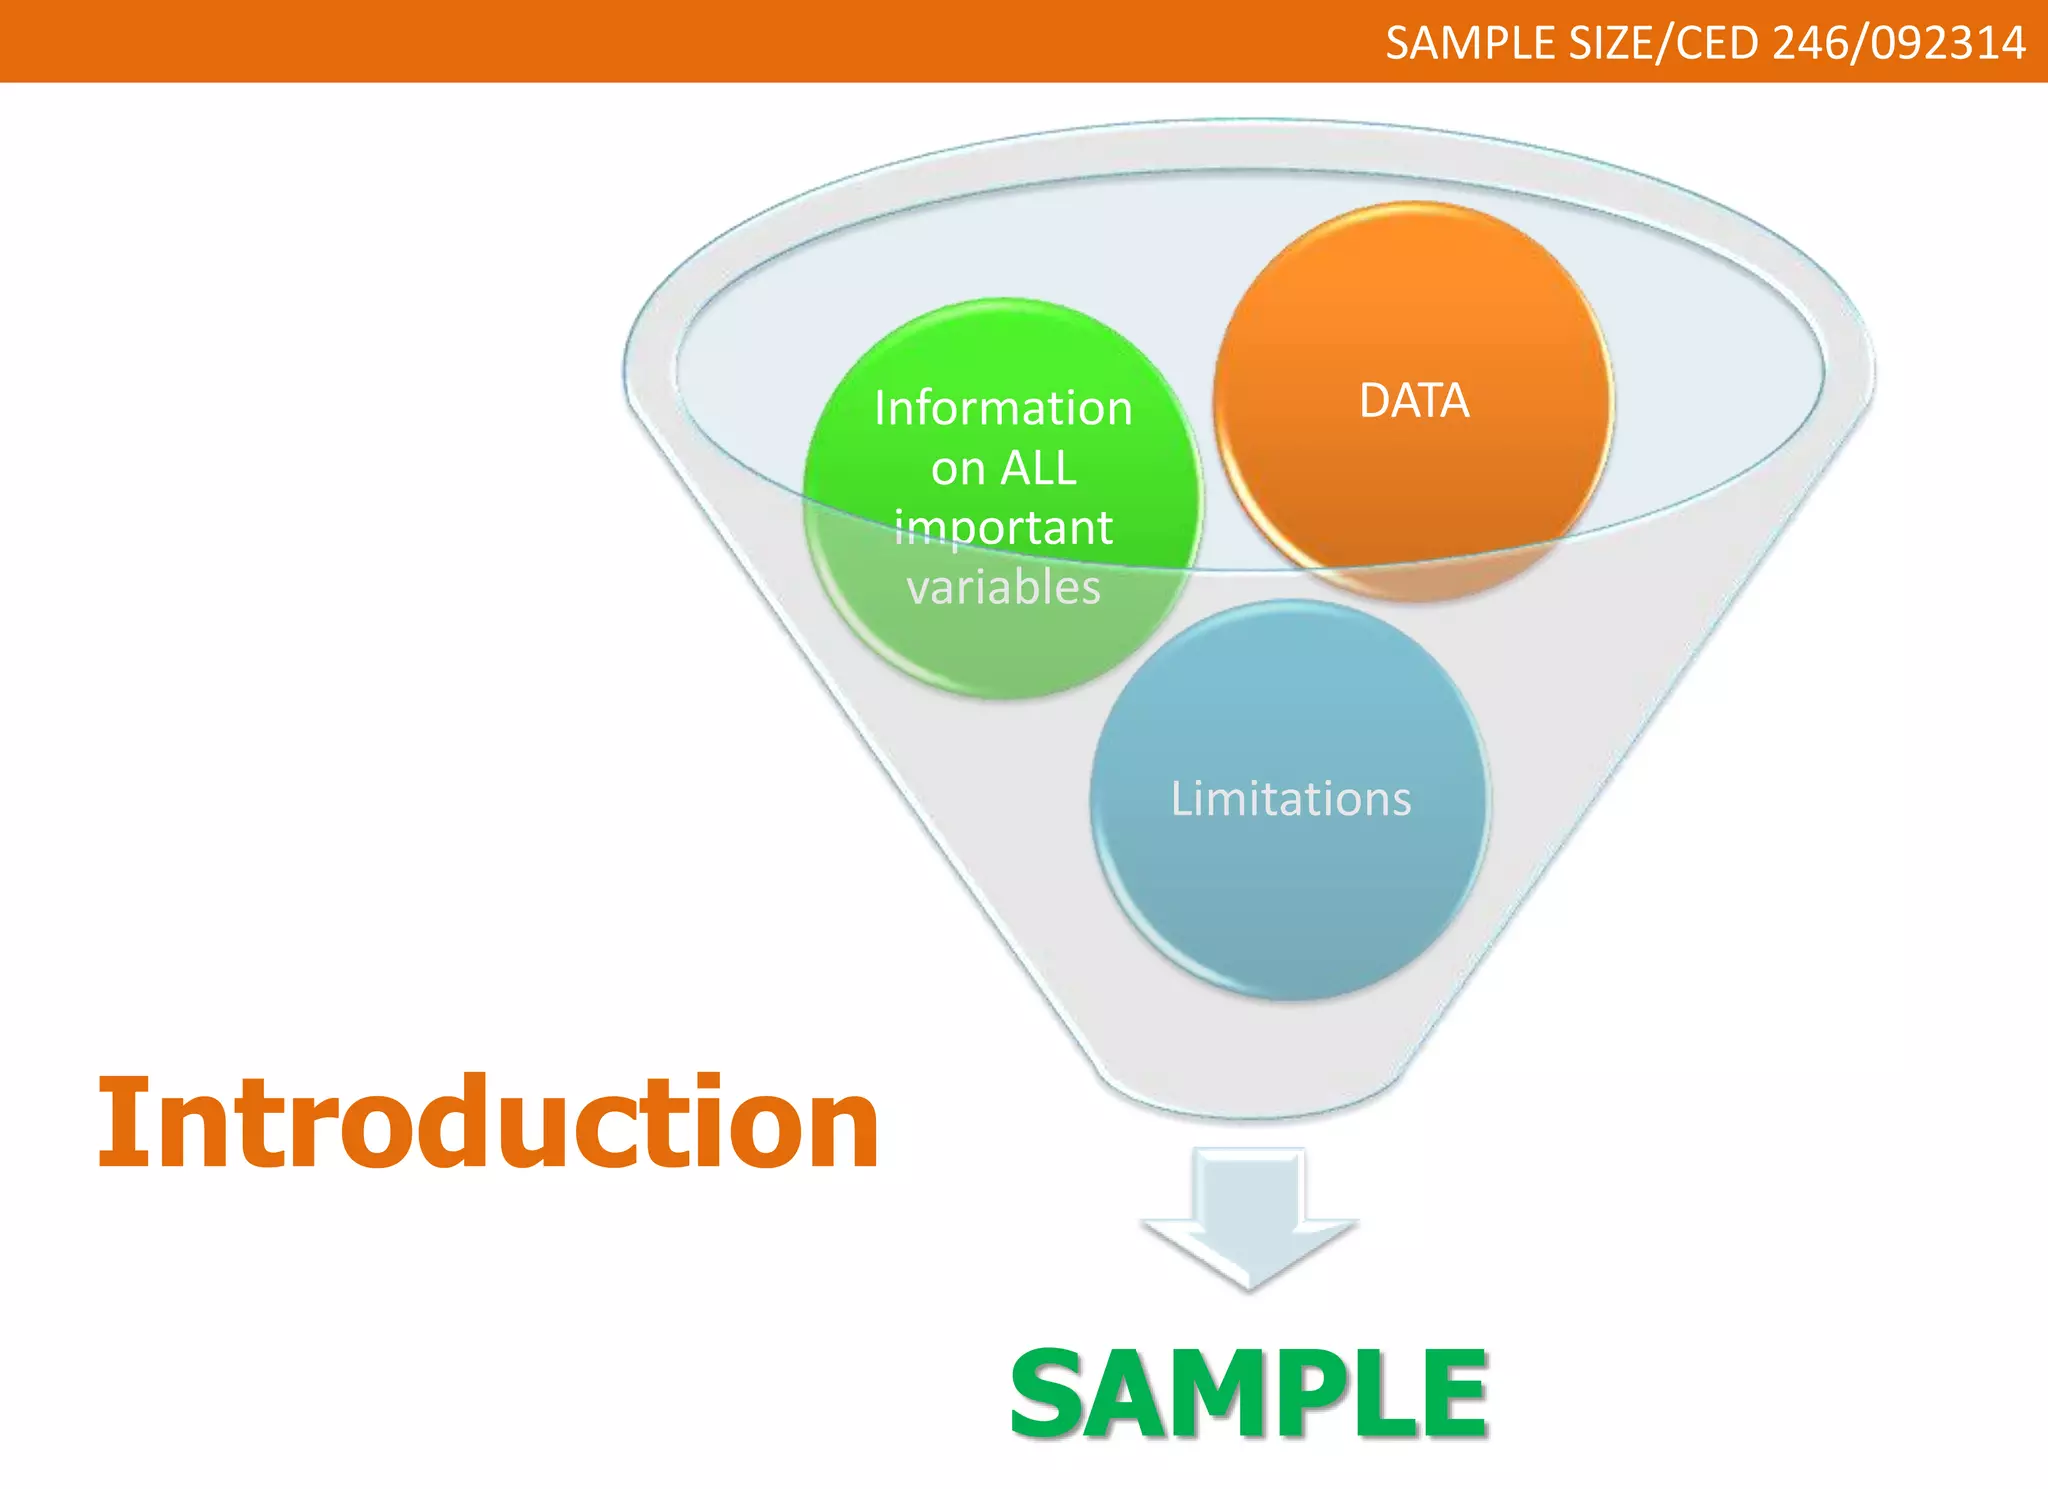
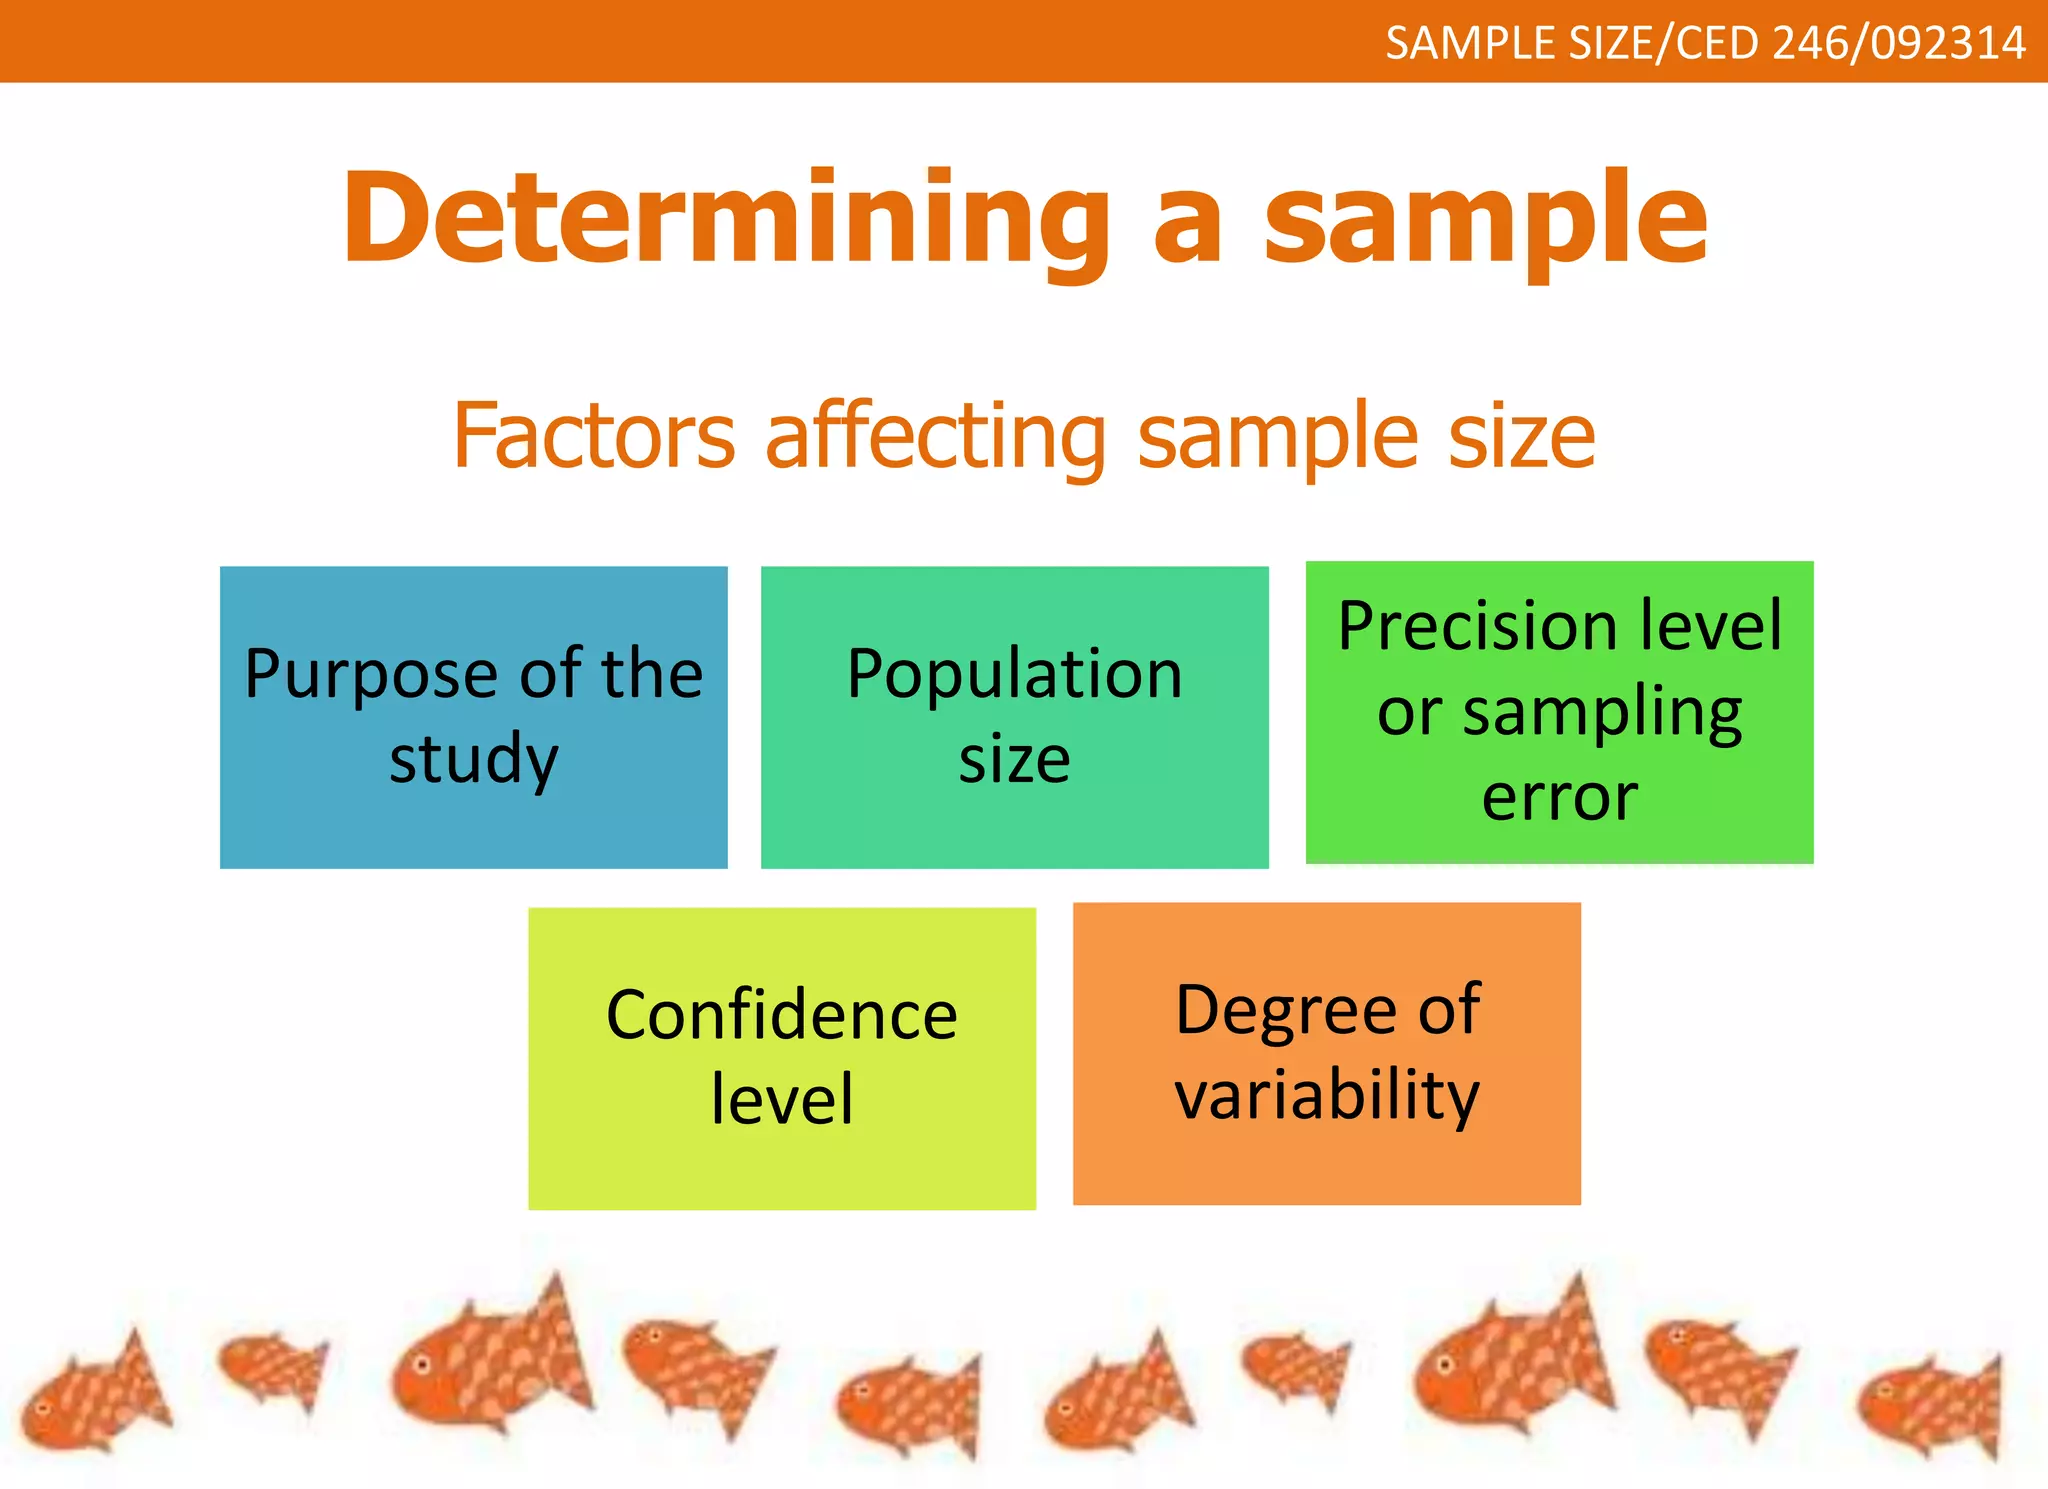
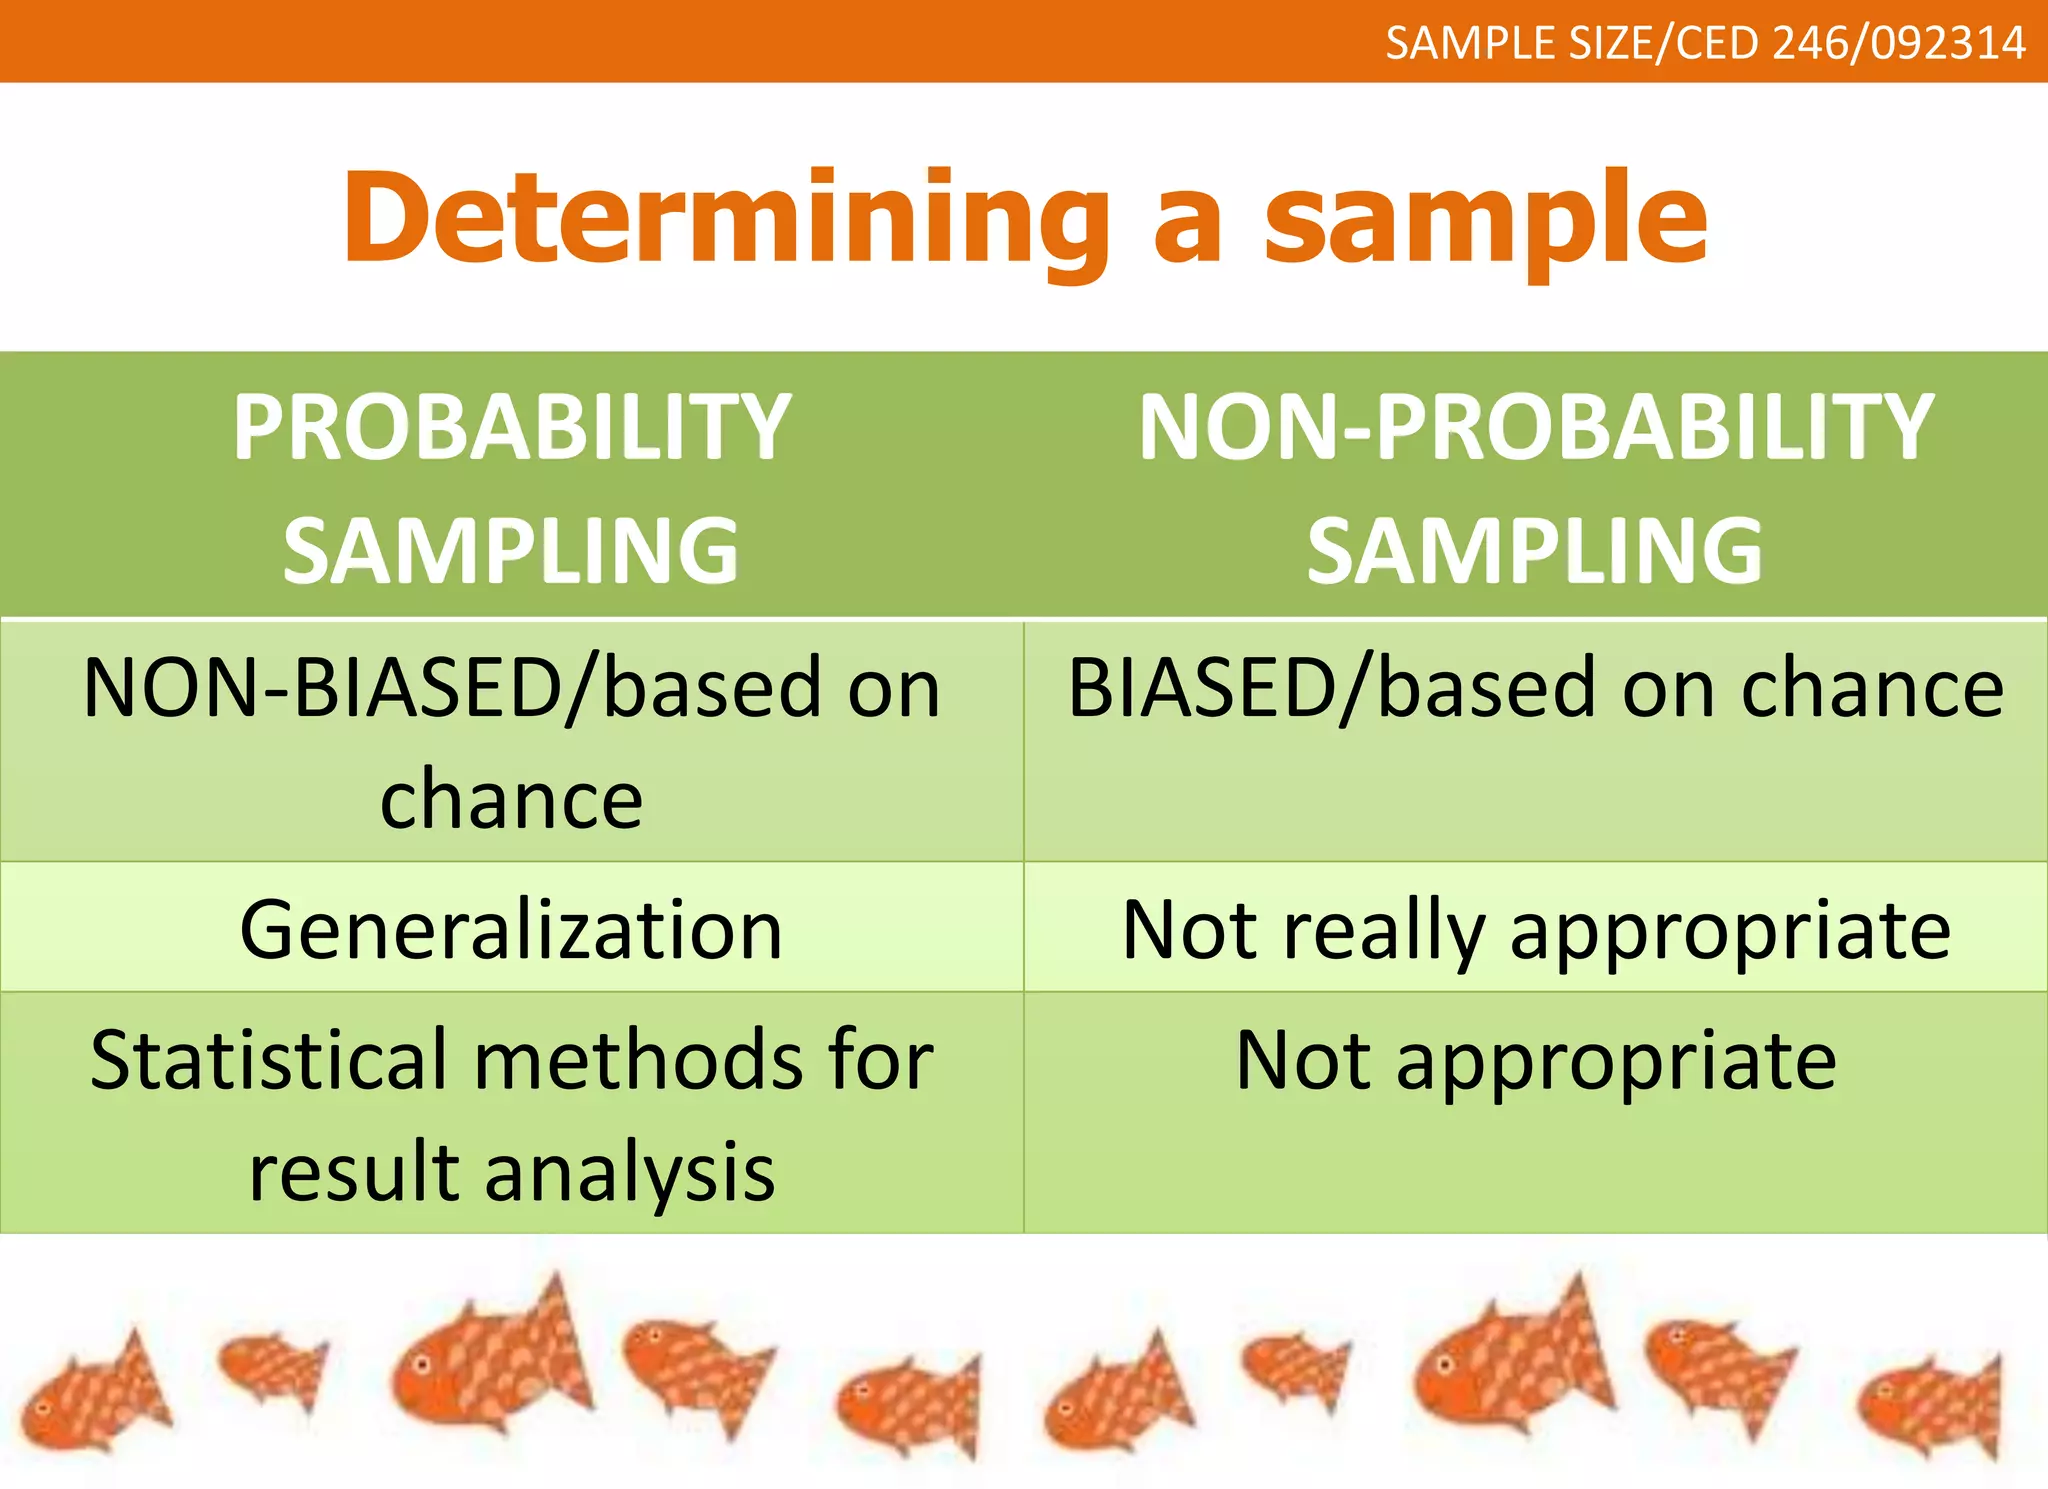
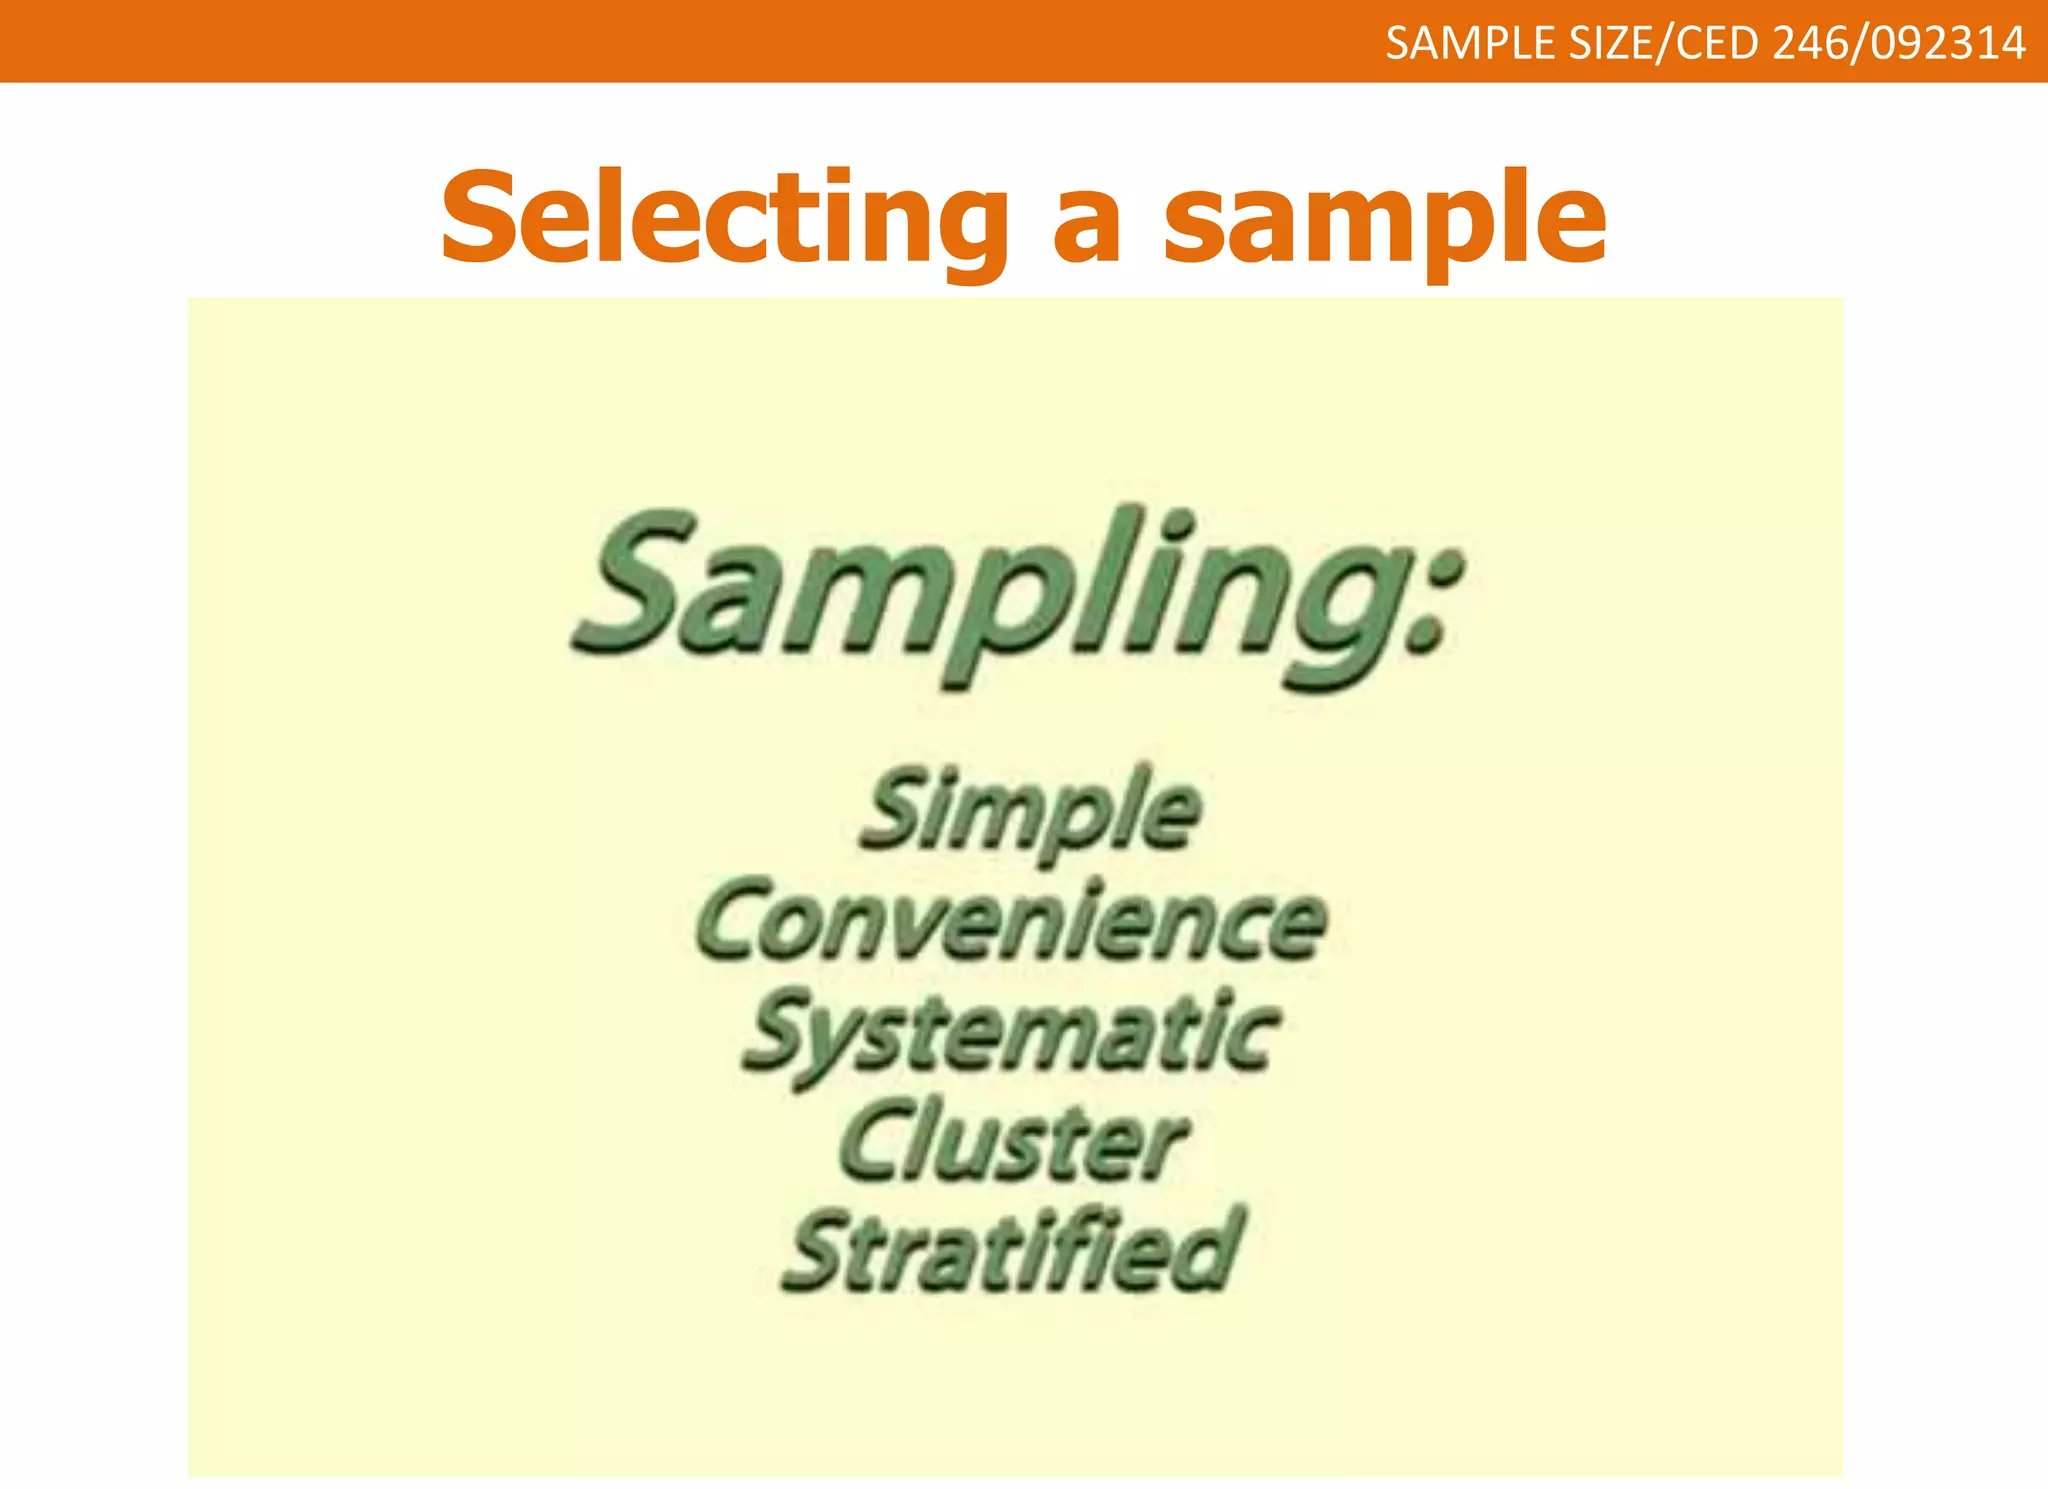
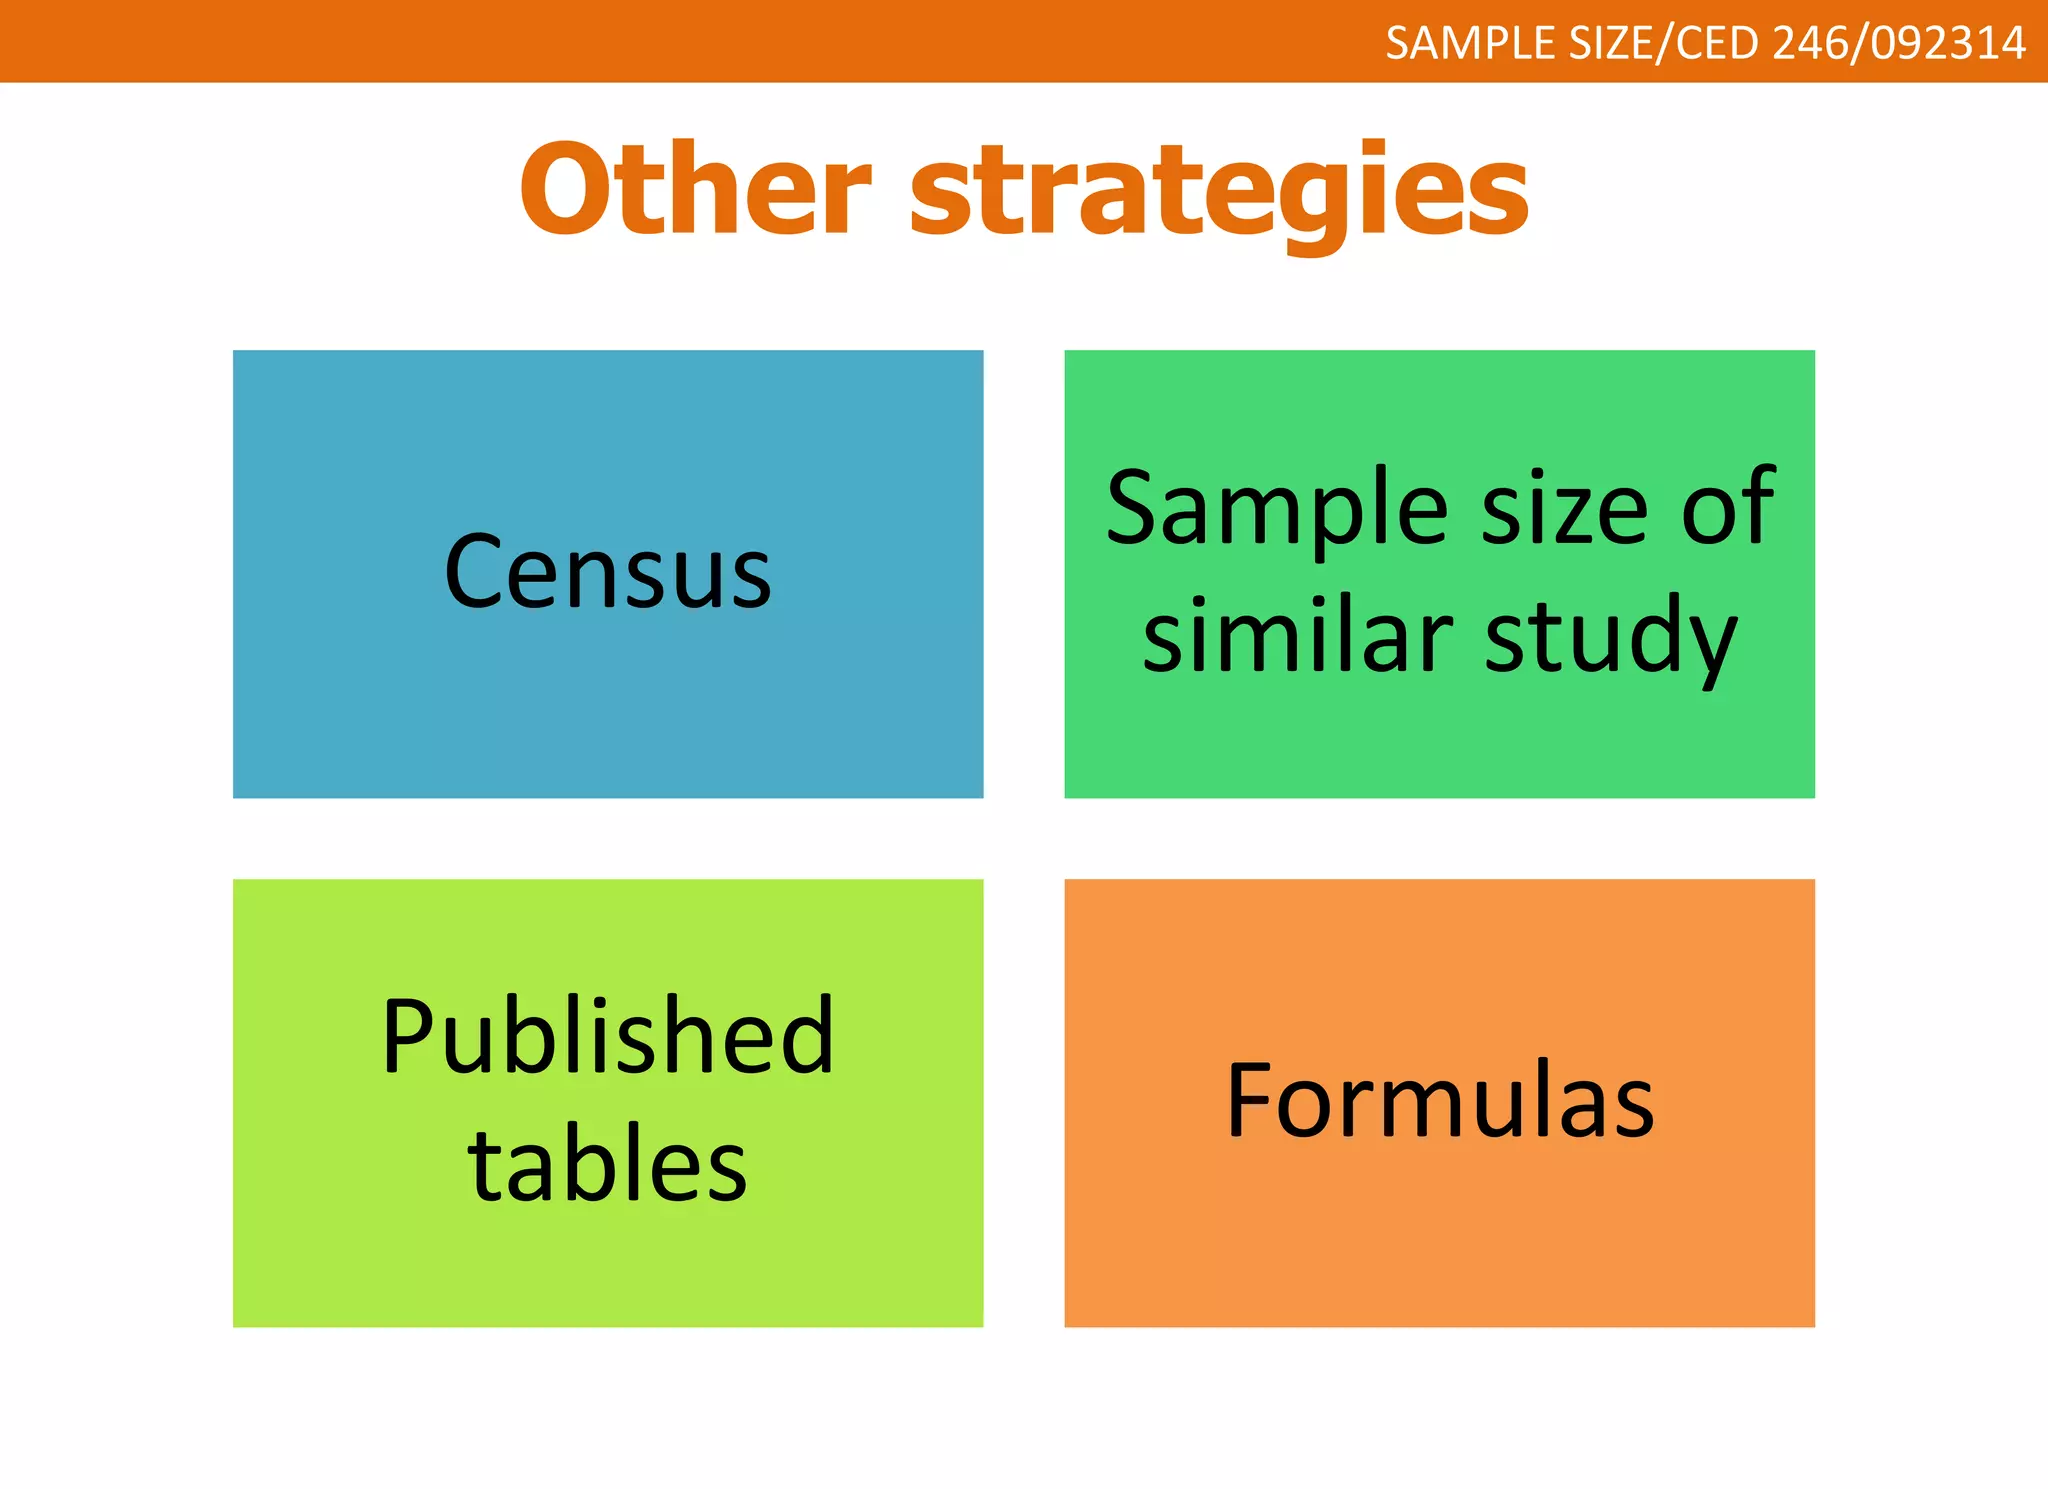
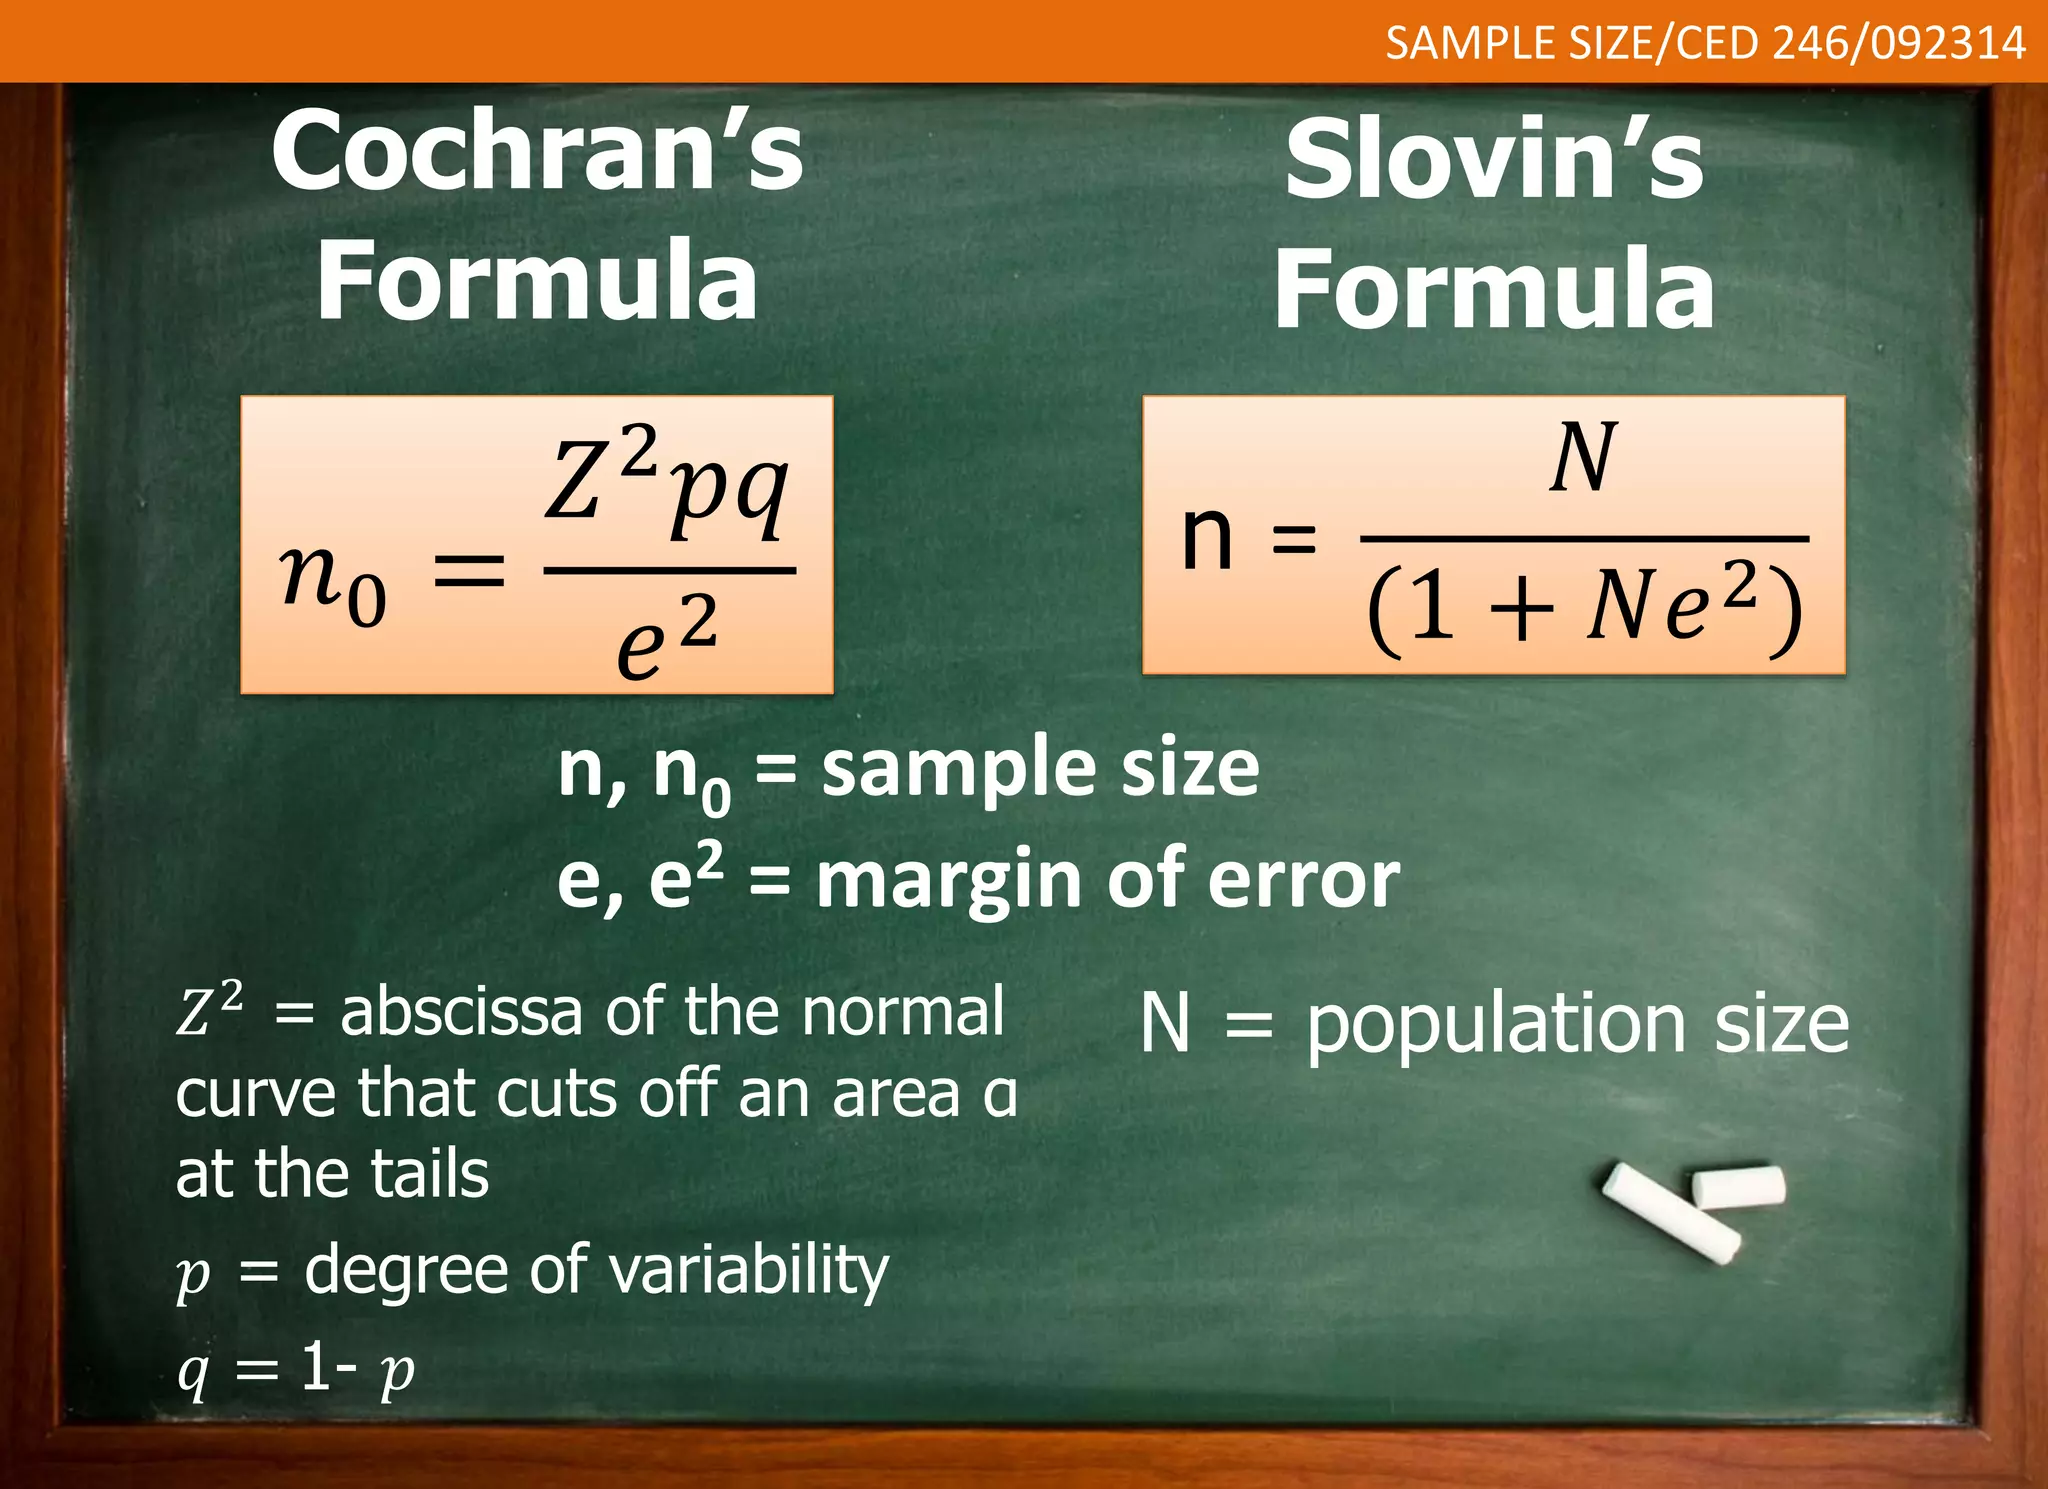
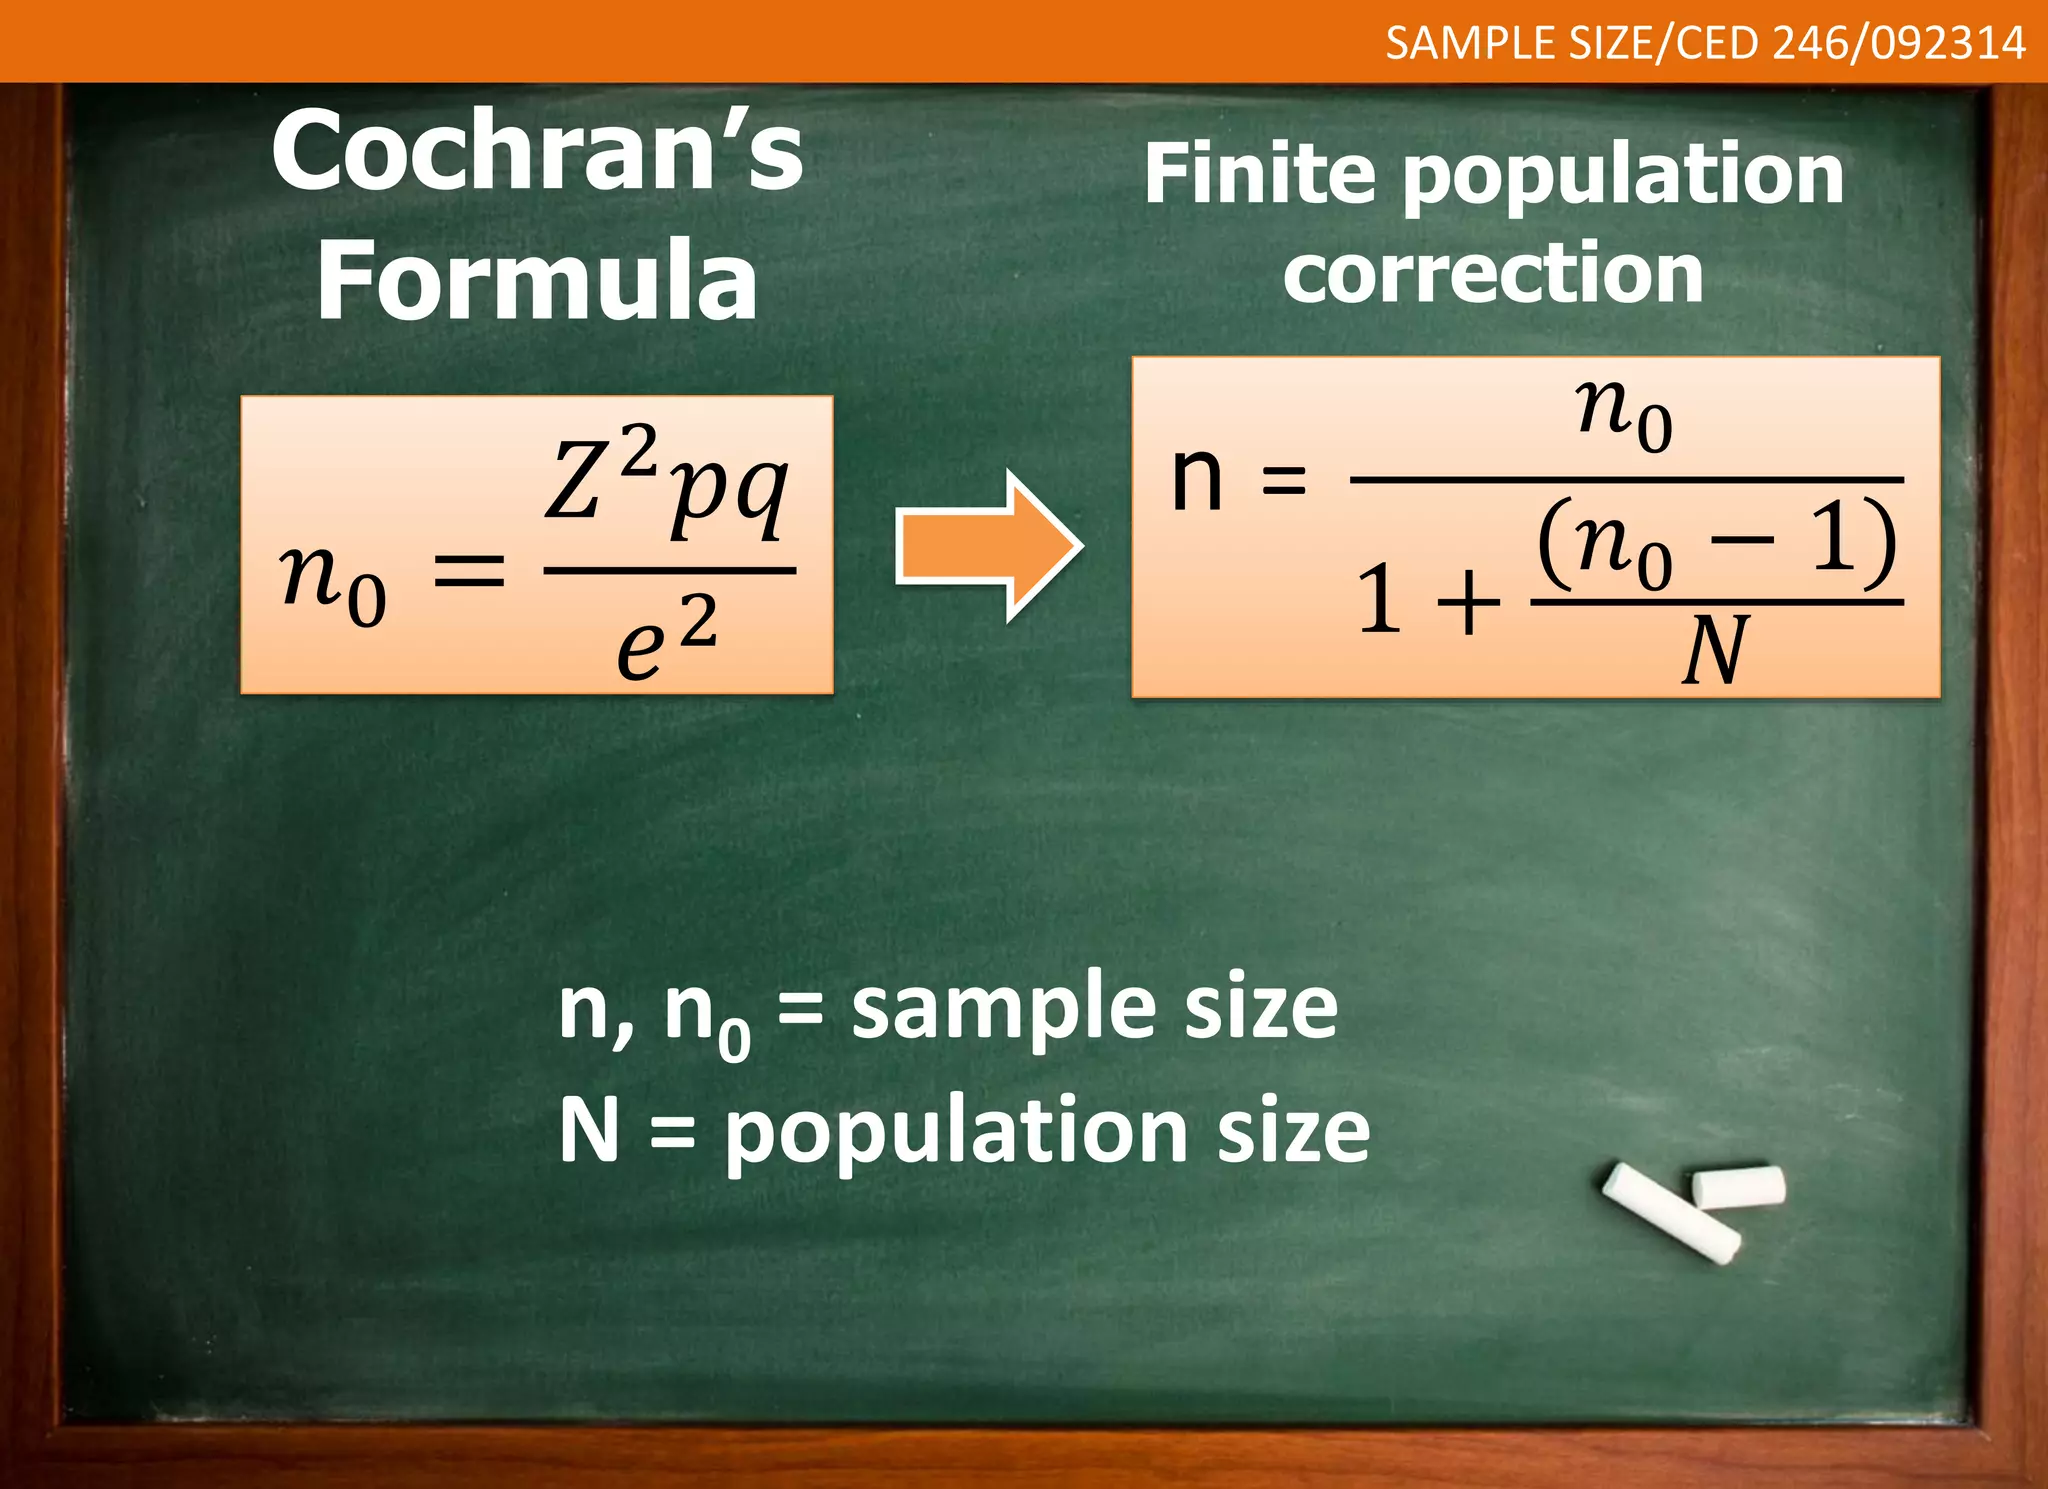
This document discusses sample size and determining an appropriate sample size for evaluation purposes. It introduces the concepts of a sample, population size, precision level, confidence level, and variability in determining sample size. Several sampling strategies are presented, including probability and non-probability sampling. Formulas are provided for calculating sample size, such as Slovin's formula and Cochran's formula which take into account factors like margin of error, population size, and degree of variability. Guidelines are given for selecting an appropriate sample size based on the purpose of the study and available population.
SAMPLING ; SAMPLING TECHNIQUES – RANDOM SAMPLING (SIMPLE RANDOM SAMPLING)Navya Jayakumar
SAMPLING ; SAMPLING TECHNIQUES – RANDOM SAMPLING
(SIMPLE RANDOM SAMPLING)
Sampling means the process of selecting a part of the population
A population is a group people that is studied in a research. These are the members of a town, a city, or a country.
It is difficult for a researcher to study the whole population due to limited resources
E.G.. Time, cost and energy
Hence the researcher selects a part of the population for his study, rather than selecting the whole population. This process is known as sampling
Also known as Random Sampling
A type of sampling where each member of the population has a known probability of being selected in the sample
When a population is highly homogeneous, its each member has a known chance of being selected in the sample
The extend of homogeneity of a population usually depends upon the nature of the research. E.g.: who are the target respondents of the research
Data collection is a one of the major important topic in research study, It should be clear and understandable to all students, especially in graduate studies
how to determine your sample size using Slovin's formula.
please click subscribe to get notifications when new materials are uploaded.
also kindly hit the like and share button so others may easily find this material.
thanks.
As continuation of Lesson 2 (where we contextualize data) in this lesson we define basic terms in statistics as we continue to explore data. These basic terms include the universe, variable, population and sample. In detail we will discuss other concepts in relation to a variable.
ARTX 360: CONSUMER RESEARCH FINAL PROJECT
Professor
12/1/19
Table of Contents
· Statement …………………………………………………………………. Page 3
· Structure of Questions…………………………………………………… Page 4
· Description of Sample……………………………………………………. Page 5
· Raw Data…………………………………………………………………. Page 6
· Analyze of Data…………………………………………………………... Page 7
· Relationship between Variables…………………………………………. Page 8
· Summery…………………………………………………………………... Page
· Conclusion………………………………………………………………… Page
1. Statement
It is important to investigate this topic due to were the internet is taking consumers in fashion in today’s market. I connect to this survey because of my interest in fashion has well has my career path and one day owning my own online business. fashion industry and business and careers such has Public relationships, which I’m involved in now, can all benefit in the knowledge of this study. The new media outlooks effecting the consumers buys decisions. This result would be publishing on a fashion blog to help the fashion businesses build consumers via social media.
ll. Structure of Questions
Question title: level of impact social media platforms have on consumers buying decisions.
Q1. How old are you? ( Independent)
1. 18-23
2. 24-29
3. 30-35
4. 36 or more
Q2. What is your gender? (Independent)
1. Female
2. Male
Q3. How often do u use social media? (Independent)
1. Daily
2. Few times a week
3. Few times a month
Q4. Rate the level of influence social media has on fashion buying decisions. (Dependent)
1. High
2. Moderation
3. Low
4. None
Ill. Description of Sample
I used a sample of 15 working individuals from different ages and different career paths to answer 4 questions regarding consumer research. All of my survey participants were more then happy to complete this survey due to the short time it takes to complete and the easy accessible access via email/message. With the help of my survey participant I am able to complete my study.
IV. Raw Data
Respondent
Age
Gender
Time on social media
Positive/ negative use of social media
1
18-23
F
Daily
Yes
2
18-23
F
Daily
Yes
3
24-29
M
Daily
Yes
4
18-23
M
Daily
No
5
18-23
F
Daily
Yes
6
18-23
F
Daily
Yes
7
18-23
F
Daily
Yes
8
24-29
F
Daily
Yes
9
24-29
F
Daily
Yes
10
24-29
M
Daily
No
12
36 or more
M
Few times a week
Yes
13
18-23
F
Daily
Yes
14
18-23
F
Few times a week
No
15
36 or more
F
Few times a week
Yes
V. Analyses of Data
Influenced Purchased by social platforms
Frequency
Yes
12
No
3
Mode:Yes
Yes
No
12
3
Median: This is non- applicable because the median cannot be applied to a nominal set of data.
Mean:This is non- applicable because the mean cannot be applied to a nominal set of data.
Range: This is non-applicable as well because variance cannot be applied to a nominal set of data.
Variance: This is non-applicable as well because vari ...
Lecture to Master of Business Management Students (MBM) at the Moshi Cooperative University, Moshi Tanzania. The Objective was that at the end of the lecture students should be able to determine sample size scientifically.
Embracing GenAI - A Strategic ImperativePeter Windle
Artificial Intelligence (AI) technologies such as Generative AI, Image Generators and Large Language Models have had a dramatic impact on teaching, learning and assessment over the past 18 months. The most immediate threat AI posed was to Academic Integrity with Higher Education Institutes (HEIs) focusing their efforts on combating the use of GenAI in assessment. Guidelines were developed for staff and students, policies put in place too. Innovative educators have forged paths in the use of Generative AI for teaching, learning and assessments leading to pockets of transformation springing up across HEIs, often with little or no top-down guidance, support or direction.
This Gasta posits a strategic approach to integrating AI into HEIs to prepare staff, students and the curriculum for an evolving world and workplace. We will highlight the advantages of working with these technologies beyond the realm of teaching, learning and assessment by considering prompt engineering skills, industry impact, curriculum changes, and the need for staff upskilling. In contrast, not engaging strategically with Generative AI poses risks, including falling behind peers, missed opportunities and failing to ensure our graduates remain employable. The rapid evolution of AI technologies necessitates a proactive and strategic approach if we are to remain relevant.
2024.06.01 Introducing a competency framework for languag learning materials ...Sandy Millin
http://sandymillin.wordpress.com/iateflwebinar2024
Published classroom materials form the basis of syllabuses, drive teacher professional development, and have a potentially huge influence on learners, teachers and education systems. All teachers also create their own materials, whether a few sentences on a blackboard, a highly-structured fully-realised online course, or anything in between. Despite this, the knowledge and skills needed to create effective language learning materials are rarely part of teacher training, and are mostly learnt by trial and error.
Knowledge and skills frameworks, generally called competency frameworks, for ELT teachers, trainers and managers have existed for a few years now. However, until I created one for my MA dissertation, there wasn’t one drawing together what we need to know and do to be able to effectively produce language learning materials.
This webinar will introduce you to my framework, highlighting the key competencies I identified from my research. It will also show how anybody involved in language teaching (any language, not just English!), teacher training, managing schools or developing language learning materials can benefit from using the framework.
Welcome to TechSoup New Member Orientation and Q&A (May 2024).pdfTechSoup
In this webinar you will learn how your organization can access TechSoup's wide variety of product discount and donation programs. From hardware to software, we'll give you a tour of the tools available to help your nonprofit with productivity, collaboration, financial management, donor tracking, security, and more.
Model Attribute Check Company Auto PropertyCeline George
In Odoo, the multi-company feature allows you to manage multiple companies within a single Odoo database instance. Each company can have its own configurations while still sharing common resources such as products, customers, and suppliers.
The Roman Empire A Historical Colossus.pdfkaushalkr1407
The Roman Empire, a vast and enduring power, stands as one of history's most remarkable civilizations, leaving an indelible imprint on the world. It emerged from the Roman Republic, transitioning into an imperial powerhouse under the leadership of Augustus Caesar in 27 BCE. This transformation marked the beginning of an era defined by unprecedented territorial expansion, architectural marvels, and profound cultural influence.
The empire's roots lie in the city of Rome, founded, according to legend, by Romulus in 753 BCE. Over centuries, Rome evolved from a small settlement to a formidable republic, characterized by a complex political system with elected officials and checks on power. However, internal strife, class conflicts, and military ambitions paved the way for the end of the Republic. Julius Caesar’s dictatorship and subsequent assassination in 44 BCE created a power vacuum, leading to a civil war. Octavian, later Augustus, emerged victorious, heralding the Roman Empire’s birth.
Under Augustus, the empire experienced the Pax Romana, a 200-year period of relative peace and stability. Augustus reformed the military, established efficient administrative systems, and initiated grand construction projects. The empire's borders expanded, encompassing territories from Britain to Egypt and from Spain to the Euphrates. Roman legions, renowned for their discipline and engineering prowess, secured and maintained these vast territories, building roads, fortifications, and cities that facilitated control and integration.
The Roman Empire’s society was hierarchical, with a rigid class system. At the top were the patricians, wealthy elites who held significant political power. Below them were the plebeians, free citizens with limited political influence, and the vast numbers of slaves who formed the backbone of the economy. The family unit was central, governed by the paterfamilias, the male head who held absolute authority.
Culturally, the Romans were eclectic, absorbing and adapting elements from the civilizations they encountered, particularly the Greeks. Roman art, literature, and philosophy reflected this synthesis, creating a rich cultural tapestry. Latin, the Roman language, became the lingua franca of the Western world, influencing numerous modern languages.
Roman architecture and engineering achievements were monumental. They perfected the arch, vault, and dome, constructing enduring structures like the Colosseum, Pantheon, and aqueducts. These engineering marvels not only showcased Roman ingenuity but also served practical purposes, from public entertainment to water supply.
Read| The latest issue of The Challenger is here! We are thrilled to announce that our school paper has qualified for the NATIONAL SCHOOLS PRESS CONFERENCE (NSPC) 2024. Thank you for your unwavering support and trust. Dive into the stories that made us stand out!
Palestine last event orientationfvgnh .pptxRaedMohamed3
An EFL lesson about the current events in Palestine. It is intended to be for intermediate students who wish to increase their listening skills through a short lesson in power point.
How to Make a Field invisible in Odoo 17Celine George
It is possible to hide or invisible some fields in odoo. Commonly using “invisible” attribute in the field definition to invisible the fields. This slide will show how to make a field invisible in odoo 17.
1. SAMPLE SIZE/CED 246/092314
SAMPLE SIZE
CED 246-Evaluation in Rural
Development
ANNA MERLINNA T. FONTANILLA
MS DEVCOM, 1998-38359
2. SAMPLE SIZE/CED 246/092314
What’s in this presentation
• Introduction
• What is a SAMPLE?
• Determining/selecting a sample
• Other sampling strategies
• Using formulas to determine sample
size
3. SAMPLE SIZE/CED 246/092314
Introduction
Phase I:
Understanding
your program
Phase II:
Planning your
evaluation
Phase III:
Implementing
your
evaluation
Collecting data
Analyzing Data
Reporting
Results
6. SAMPLE SIZE/CED 246/092314
Determining a sample
Factors affecting sample size
Purpose of the
study
Population
size
Precision level
or sampling
error
Confidence
level
Degree of
variability
7. SAMPLE SIZE/CED 246/092314
Determining a sample
PROBABILITY
SAMPLING
NON-PROBABILITY
SAMPLING
NON-BIASED/based on
chance
BIASED/based on chance
Generalization Not really appropriate
Statistical methods for
result analysis
Not appropriate
9. SAMPLE SIZE/CED 246/092314
Other strategies
Census
Sample size of
similar study
Published
tables
Formulas
10. SAMPLE SIZE/CED 246/092314
Slovin’s
Formula
n =
푁
(1 + 푁푒2)
n, n0 = sample size
e, e2 = margin of error
N = population size
Cochran’s
Formula
푛0 =
푍2푝푞
푒2
푍2 = abscissa of the normal
curve that cuts off an area α
at the tails
푝 = degree of variability
푞 = 1- 푝
11. SAMPLE SIZE/CED 246/092314
Finite population
correction
n =
푛0
1 +
(푛0 − 1)
푁
Cochran’s
Formula
푛0 =
푍2푝푞
푒2
n, n0 = sample size
N = population size
Before I start with my report, let’s take a look where we are now in our evaluation process.
So per MEERA’s model, we’re done with the reports for Phases I and II.
And we are now in Phase III, where we are implementing our evaluation.
In this phase, we have three steps according to Nou Yang.
And my report is one aspect of collecting data.
According to Grace, we need data for our evaluation to arrive at a result and we can get these data from various sources.
What we will be more concerned with is the primary data we will get from the program participants.
According to Stufflebeam, evaluators should obtain data and information on all the important variables of the program. Our criteria and indicators which Ate Tess discussed during our previous meeting, will guide us on what data and information we have to obtain.
Stufflebeam also said that for each source of information, evaluators cannot collect all of the potentially relevant information since evaluation is mainly a time-constrained enterprise or business that functions under real-world complexities.
In other words, the evaluation is faced with many limitations particularly time, money, manpower and other resources.
For example if we will look at the growth of fish in the ocean and how it relates to climate change, we cannot observe every fish in the sea. There are millions of fishes in the sea and we cannot for the life of us, take each fish and observe it. Other examples: Family Planning Program, Newspaper Readership, Happiness Index, etc.
So this is why evaluators or researchers often collect information from only a sample of all the elements or objects of the evaluation or study. In our example, a sample of fishes, a sample of families, a sample of newspapers, etc.
In other words, we take samples to save time, money, labor and other resources when doing our evaluation or any study.
And also, there are less errors from handling the data (e.g. encoding) because there are fewer opportunities to make mistakes (Israel, 2013).
So what is a sample?
In very simple terms, a sample means a smaller quantity taken from much larger group to represent the whole group.
Technically, according to MathIsFun.com, a sample is a selection taken from a larger group or the "population", so that you can examine it to find out something about the population.
The key words to remember about samples are population and representativeness- the sample should be enough to sufficiently represent the population where it was taken.
So we need to be careful about identifying the population and finding out the sample size so we can get reliable evaluation results.
A good problem statement is necessary to identify the population relevant to evaluating program impacts (Israel, 2013). We have to be specific about our problem statement. What do we really wanna know? E.g. happiness index, fish, family planning, aerobics
The population can be defined in many ways, geographically, demographic, economic, social characteristics, or content of the survey (Israel, 2013).
So after defining the population, we can now go to determining our sample.
There are cases when all the elements or sampling units in a population are included in the evaluation or study. Sometimes because the population is small e.g. evaluating CED 246 class and sometimes, because the evaluation calls for it.
The sample size is influenced by (Israel, 2013):
Purpose of the study – what do we really wanna know?
Population size – if small, all elements can be included as sample; if big, sample size have to be determined
Risk of selecting a "bad" sample or the confidence level – e.g. if we use a 95% confidence level, we assume that 95 out of 100 samples will have the true population value within the range of precision
Allowable sampling error or level of precision – the range in which the true value of population is estimated to be e.g. if a researcher finds that 60% of the sample adopted a technology within a ±5% precision rate, then he can conclude that between 55% or 65% of the whole population adopted the technology.
Degree of variability in the attributes being measured – distribution of attributes in the population; the more heterogeneous or variable the population is, the larger the sample size is required to obtain a given level of precision and vv. 50% is the maximum variability and often used in determining a conservative sample size, 80% means majority has the attribute being measured, 20% means majority do not have the attribute
These factors are particularly seen when using mathematical formulas.
Two categories of doing sampling: non-probability and probability.
Nonprobability – use procedures for selection that are not based on chance. There is no way to accurately estimate the chance of any element being selected. The quality of the sample depends on the knowledge, judgement and expertise of the researcher. Convenient and economical.
Probability – every element in the population has a known, non-zero probability of selection. Because the probability is known, the sample statistics can be generalized to the population at large (in a given level of precision).
Probability samples are generally preferred because the risk of incorrectly generalizing the population is known. You are aware of the error.
An important benefit of simple random sampling is that it allows researchers to use statistical methods to analyze sample results. For example, given a simple random sample, researchers can use statistical methods to define a confidence interval around a sample mean. Statistical analysis is not appropriate when non-random sampling methods are used.
00:33
The choice of a sample design will be largely determined by the amount of information that is available for the population.
If characteristics of the population are known, then a stratified sample can be used to obtain more precise data.
If little is known about the population, then a less complex design such as simple random or systematic samples can be used.
When a list is unavailable or incomplete, a cluster sample may be the most efficient choice.
But methods can be combined.
Using a census for small populations – small is 200 or less; eliminates sampling error and provides data on all the individuals in the population
Using a sample size of a similar study – published studies
Using published tables – provides the sample size for a given set of criteria; sample sizes reflect the number of obtained responses not the number of surveys mailed or interviews planned; Table 2 presumes that the attributes being measured are distributed normally or nearly so
Using formulas – when different combination of levels of precision, confidence, and variability are used
Assumptions for 3 and 4: simple random sample is used
Israel, 2013
Both are used to calculate a sample for proportions
Cochran’s formula is used for large populations, finite population
Value of Z is found in statistical tables.
When Slovin’s formula is used: If you have no idea about a population’s behavior.
Using Slovin’s formula restricts the confidence coefficient to 95%.
If the population is small, the sample size can be reduced slightly
Israel (2013) notes that the above approaches have assumed that a simple random sample is the sampling design.
More complex designs such as stratified, clustering would require other considerations in the computation.
If descriptive statistics are to be used, e.g. mean, frequencies, then nearly any sample size will suffice.
A good sample size, e.g. 200-500 is needed for multiple regression, analysis of co-variance or log-linear analysis.
The sample size should be appropriate for the analysis that is planned.