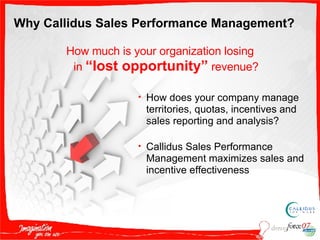
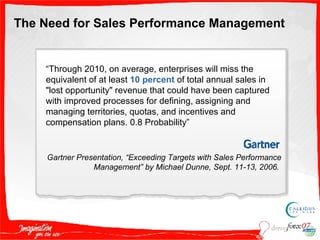
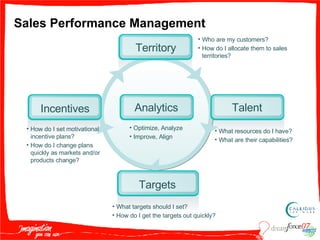
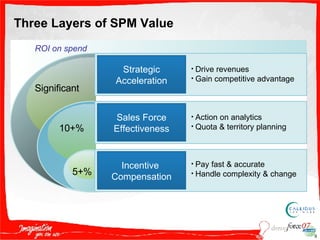
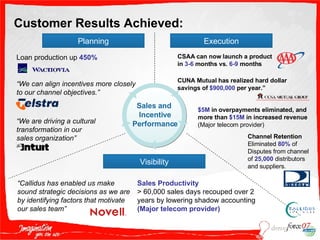
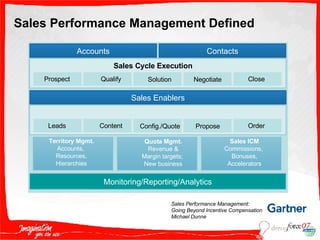
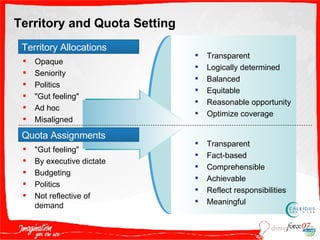
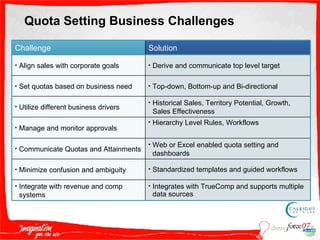
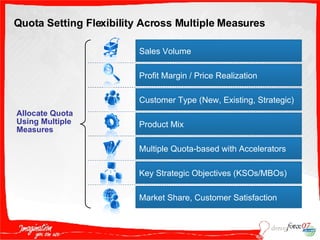
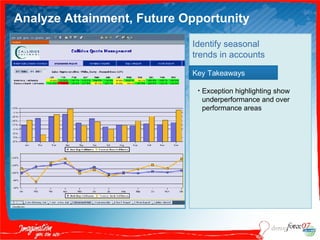
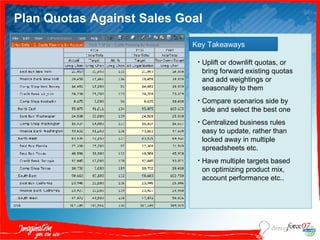
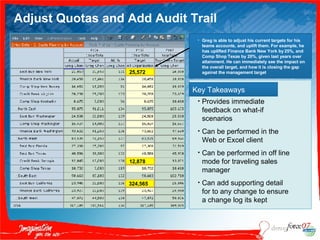
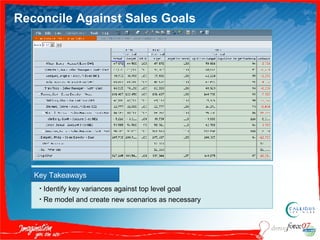
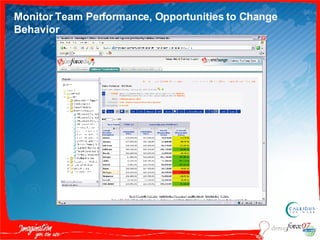
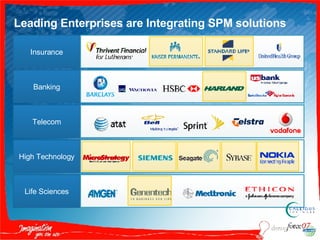
Supercharge Sales Results by Optimizing Quotas, Territories, and Incentives Robert Youngjohns, CEO Paul Turner, Product Marketing Sales: Million Dollar Producer
Safe Harbor Statement “ Safe harbor” statement under the Private Securities Litigation Reform Act of 1995: This presentation may contain forward-looking statements including but not limited to statements concerning the potential market for our existing service offerings and future offerings. All of our forward looking statements involve risks, uncertainties and assumptions. If any such risks or uncertainties materialize or if any of the assumptions proves incorrect, our results could differ materially from the results expressed or implied by the forward-looking statements we make. The risks and uncertainties referred to above include - but are not limited to - risks associated with possible fluctuations in our operating results and cash flows, rate of growth and anticipated revenue run rate, errors, interruptions or delays in our service or our Web hosting, our new business model, our history of operating losses, the possibility that we will not remain profitable, breach of our security measures, the emerging market in which we operate, our relatively limited operating history, our ability to hire, retain and motivate our employees and manage our growth, competition, our ability to continue to release and gain customer acceptance of new and improved versions of our service, customer and partner acceptance of the AppExchange, successful customer deployment and utilization of our services, unanticipated changes in our effective tax rate, fluctuations in the number of shares outstanding, the price of such shares, foreign currency exchange rates and interest rates.  Further information on these and other factors that could affect our financial results is included in the reports on Forms 10-K, 10-Q and 8-K and in other filings we make with the Securities and Exchange Commission from time to time. These documents are available on the SEC Filings section of the Investor Information section of our website at  www.salesforce.com/investor . Salesforce.com, inc. assumes no obligation and does not intend to update these forward-looking statements, except as required by law.
All About Callidus Software Callidus Software, Inc. provides sales  performance management (SPM) and  enterprise incentive management (EIM)  software systems worldwide INDUSTRY : Software EMPLOYEES : 350+ GEOGRAPHY : Global #   USERS : 1.7million PRODUCT(S) USED BY : Sales operations, Finance, Sales team
Agenda The need for Sales Performance Management Business challenges Effective quota setting Territory optimization Incentive management Wrap up Q&A
How much is your organization losing in  “lost opportunity”  revenue? How does your company manage territories, quotas, incentives and sales reporting and analysis? Callidus Sales Performance Management maximizes sales and incentive effectiveness Why Callidus Sales Performance Management?
The Need for Sales Performance Management “ Through 2010, on average, enterprises will miss the equivalent of at least  10 percent   of total annual sales in "lost opportunity" revenue that could have been captured with improved processes for defining, assigning and managing territories, quotas, and incentives and compensation plans. 0.8 Probability” Gartner Presentation, “Exceeding Targets with Sales Performance Management” by Michael Dunne, Sept. 11-13, 2006.
40 Million Salespeople, $1.5 trillion in spend Nearly  zero  visibility for managing the investment What is your organization’s sales spend? Is it getting its money’s worth for that investment? Are your sales incentives and programs producing the desired results? Do you know when you’ve taken the right action?
Sales Performance Management Optimize, Analyze Improve, Align Who are my customers? How do I allocate them to sales territories? What resources do I have? What are their capabilities? What targets should I set? How do I get the targets out quickly? How do I set motivational incentive plans? How do I change plans  quickly as markets and/or products change? Territory Talent Analytics Incentives Targets
ROI on spend Three Layers of SPM Value Significant 10+% 5+% Strategic Acceleration Drive revenues Gain competitive advantage Sales Force Effectiveness Action on analytics Quota & territory planning Incentive  Compensation Pay fast & accurate Handle complexity & change
Customer Results Achieved: Visibility Planning Execution Sales and  Incentive Performance CSAA can now launch a product  in  3-6  months vs.  6-9  months $5M  in overpayments eliminated, and more than  $15M  in increased revenue (Major telecom provider) Channel Retention Eliminated  80%  of  Disputes from channel  of  25,000  distributors  and suppliers. CUNA Mutual has realized hard dollar savings of  $900,000  per year.” Sales Productivity > 60,000 sales days recouped over 2 years by lowering shadow accounting  (Major telecom provider) “ Callidus has enabled us make sound strategic decisions as we are by identifying factors that motivate our sales team” “ We are driving a cultural transformation in our  sales organization” Loan production up  450% “ We can align incentives more closely  to our channel objectives.”
Sales Performance Management Defined Sales Performance Management:  Going Beyond Incentive Compensation Michael Dunne Accounts Contacts Sales Cycle Execution Prospect Qualify Solution Close Negotiate Sales Enablers Leads Content Config./Quote Order Propose Monitoring/Reporting/Analytics Territory Mgmt. Accounts,  Resources, Hierarchies Quota Mgmt. Revenue & Margin targets;  New business Sales ICM Commissions,  Bonuses, Accelerators
Territory and Quota Setting Opaque Seniority Politics "Gut feeling" Ad hoc Misaligned "Gut feeling" By executive dictate Budgeting Politics Not reflective of demand Territory Allocations Quota Assignments Transparent Fact-based Comprehensible Achievable Reflect responsibilities Meaningful Transparent Logically determined Balanced Equitable Reasonable opportunity Optimize coverage
Quota Setting Business Challenges Challenge Solution Align sales with corporate goals Derive and communicate top level target Set quotas based on business need Top-down, Bottom-up and Bi-directional Utilize different business drivers Historical Sales, Territory Potential, Growth, Sales Effectiveness Manage and monitor approvals Hierarchy Level Rules, Workflows Communicate Quotas and Attainments  Web or Excel enabled quota setting and dashboards Minimize confusion and ambiguity Standardized templates and guided workflows Integrate with revenue and comp systems Integrates with TrueComp and supports multiple data sources
Quota Setting Flexibility Across Multiple Measures Allocate Quota Using Multiple Measures Customer Type (New, Existing, Strategic) Sales Volume Profit Margin / Price Realization Product Mix Multiple Quota-based with Accelerators Key Strategic Objectives (KSOs/MBOs) Market Share, Customer Satisfaction
Analyze Attainment, Future Opportunity Key Takeaways Exception highlighting show underperformance and over performance areas Identify seasonal  trends in accounts
Plan Quotas Against Sales Goal Key Takeaways Uplift or downlift quotas, or bring forward existing quotas and add weightings or seasonality to them Compare scenarios side by side and select the best one Centralized business rules  easy to update, rather than locked away in multiple spreadsheets etc. Have multiple targets based on optimizing product mix, account performance etc..
Adjust Quotas and Add Audit Trail 25,572 324,565 12,878 Key Takeaways Provides immediate feedback on what-if scenarios Can be performed in the Web or Excel client Can be performed in off line mode for traveling sales manager Can add supporting detail for to any change to ensure a change log its kept Greg is able to adjust his current targets for his teams accounts, and uplift them. For example, he has uplifted Finance Bank New York by 25%, and Comp Shop Texas by 20%, given last years over attainment. He can immediately see the impact on the overall target, and how it is closing the gap against the management target
Reconcile Against Sales Goals Key Takeaways Identify key variances against top level goal Re model and create new scenarios as necessary
Major realignments Creation, expansion or reduction of sales force New product mix, new target, new indication New competition Mergers, consolidations On-going maintenance Align to new business conditions as reflected in data updates New customer acquisition Personnel situations Territory management “ What-if” analyses Different strategy Plan variations Situations that Require Territory Realignment
Efficient Territory Optimization Key Takeaways Leverage any metric or attribute to create balanced territories Territories can be account based or area based, a combination of both; i.e..  Rep A has all the ‘red’ zip codes with the exception of  one named account Users can view accounts, territories centers, values of areas, highways, etc… to design the most effective territories
Key Takeaways “ What-if” modeling – Users can simultaneously view several possible solutions for comparison Model and Balance Territories Based on Key Drivers Users have the ability to dial-in the relative  importance of territory balance, geographic  compactness and level of disruption when  evaluating optimized scenarios.
Incentives Drive Financial Performance Brand Management Motivating and  Rewarding People Customer Service Turning Customer Info into Insight Attracting and Retaining People Building Selling and Service Skills Strong Value Propositions Partner and Alliance Management eCRM Sales Planning Key Account Management Advertising Customer Retention and Acquisition Managing Product and Service Mix Promotion Ability to Change the organization New Products and Services Segmentation Building Service Culture Channel Management ¹   Accenture CRM Research Potential Dollar Impact in $M on Pre-tax Profit of Moving from Average to High Performance for $1Bn Business Unit - Accenture CRM research 1.5 13.0 13.0 12.0 10.0 9.5 9.0 9.0 8.0 7.5 6.0 5.5 5.0 3.5 2.5 2.0 3.0 5.0 5.0
Pay for Performance from Everyday Dashboard
Detail to Reduce Shadow Accounting
Gain Summary View of Sales Performance, Incentive Opportunities
Monitor Key Metrics
Monitor Team Performance, Opportunities to Change Behavior
Leading Enterprises are Integrating SPM solutions Insurance Banking Telecom High Technology Life Sciences
Continued Integration with salesforce.com to Drive Customer Value “ As a customer of both Callidus Software and salesforce.com, we are pleased that the two solutions are becoming more fully integrated. With this integration, our sales representatives and sales executives will be able to view strategic sales force automation and sales performance management information together .” John Graham  Executive Vice President Global Sales and Services at UGS PLM Software, a division of Siemens Automation and Drives .
Summary:  Why Callidus On-Demand SPM? Flexible <60 days to go live Make changes any time Scalable Proven multi-tenant grid processing for scalable performance Reliable 99.5+% availability exceeds industry standard SLA’s Safe Type II SAS 70 certified Safe Harbor certified
Sales Performance Management Leadership Most deployed solution Used by over 1.7 million sales professionals globally Unmatched breadth Plan  spend, quotas, and territories Execute  timely and cost effective incentives Deliver clear  visibility  through reporting and analytics to sales and finance Seamless access from Salesforce Deploy to sales organization through everyday Salesforce application
Session Feedback Let us know how we’re doing! Please score the session from 5 to 1 (5=excellent,1=needs improvement) in the following categories: Overall rating of the session Quality of content Strength of presentation delivery Relevance of the session to your organization We strive to improve, t hank you for filling out our survey. Additionally, please score each individual speaker on: Overall delivery of session
 

S D M001 Sechrist 091707

  • 1.
    Supercharge Sales Resultsby Optimizing Quotas, Territories, and Incentives Robert Youngjohns, CEO Paul Turner, Product Marketing Sales: Million Dollar Producer
  • 2.
    Safe Harbor Statement“ Safe harbor” statement under the Private Securities Litigation Reform Act of 1995: This presentation may contain forward-looking statements including but not limited to statements concerning the potential market for our existing service offerings and future offerings. All of our forward looking statements involve risks, uncertainties and assumptions. If any such risks or uncertainties materialize or if any of the assumptions proves incorrect, our results could differ materially from the results expressed or implied by the forward-looking statements we make. The risks and uncertainties referred to above include - but are not limited to - risks associated with possible fluctuations in our operating results and cash flows, rate of growth and anticipated revenue run rate, errors, interruptions or delays in our service or our Web hosting, our new business model, our history of operating losses, the possibility that we will not remain profitable, breach of our security measures, the emerging market in which we operate, our relatively limited operating history, our ability to hire, retain and motivate our employees and manage our growth, competition, our ability to continue to release and gain customer acceptance of new and improved versions of our service, customer and partner acceptance of the AppExchange, successful customer deployment and utilization of our services, unanticipated changes in our effective tax rate, fluctuations in the number of shares outstanding, the price of such shares, foreign currency exchange rates and interest rates. Further information on these and other factors that could affect our financial results is included in the reports on Forms 10-K, 10-Q and 8-K and in other filings we make with the Securities and Exchange Commission from time to time. These documents are available on the SEC Filings section of the Investor Information section of our website at www.salesforce.com/investor . Salesforce.com, inc. assumes no obligation and does not intend to update these forward-looking statements, except as required by law.
  • 3.
    All About CallidusSoftware Callidus Software, Inc. provides sales performance management (SPM) and enterprise incentive management (EIM) software systems worldwide INDUSTRY : Software EMPLOYEES : 350+ GEOGRAPHY : Global # USERS : 1.7million PRODUCT(S) USED BY : Sales operations, Finance, Sales team
  • 4.
    Agenda The needfor Sales Performance Management Business challenges Effective quota setting Territory optimization Incentive management Wrap up Q&A
  • 5.
    How much isyour organization losing in “lost opportunity” revenue? How does your company manage territories, quotas, incentives and sales reporting and analysis? Callidus Sales Performance Management maximizes sales and incentive effectiveness Why Callidus Sales Performance Management?
  • 6.
    The Need forSales Performance Management “ Through 2010, on average, enterprises will miss the equivalent of at least 10 percent of total annual sales in &quot;lost opportunity&quot; revenue that could have been captured with improved processes for defining, assigning and managing territories, quotas, and incentives and compensation plans. 0.8 Probability” Gartner Presentation, “Exceeding Targets with Sales Performance Management” by Michael Dunne, Sept. 11-13, 2006.
  • 7.
    40 Million Salespeople,$1.5 trillion in spend Nearly zero visibility for managing the investment What is your organization’s sales spend? Is it getting its money’s worth for that investment? Are your sales incentives and programs producing the desired results? Do you know when you’ve taken the right action?
  • 8.
    Sales Performance ManagementOptimize, Analyze Improve, Align Who are my customers? How do I allocate them to sales territories? What resources do I have? What are their capabilities? What targets should I set? How do I get the targets out quickly? How do I set motivational incentive plans? How do I change plans quickly as markets and/or products change? Territory Talent Analytics Incentives Targets
  • 9.
    ROI on spendThree Layers of SPM Value Significant 10+% 5+% Strategic Acceleration Drive revenues Gain competitive advantage Sales Force Effectiveness Action on analytics Quota & territory planning Incentive Compensation Pay fast & accurate Handle complexity & change
  • 10.
    Customer Results Achieved:Visibility Planning Execution Sales and Incentive Performance CSAA can now launch a product in 3-6 months vs. 6-9 months $5M in overpayments eliminated, and more than $15M in increased revenue (Major telecom provider) Channel Retention Eliminated 80% of Disputes from channel of 25,000 distributors and suppliers. CUNA Mutual has realized hard dollar savings of $900,000 per year.” Sales Productivity > 60,000 sales days recouped over 2 years by lowering shadow accounting (Major telecom provider) “ Callidus has enabled us make sound strategic decisions as we are by identifying factors that motivate our sales team” “ We are driving a cultural transformation in our sales organization” Loan production up 450% “ We can align incentives more closely to our channel objectives.”
  • 11.
    Sales Performance ManagementDefined Sales Performance Management: Going Beyond Incentive Compensation Michael Dunne Accounts Contacts Sales Cycle Execution Prospect Qualify Solution Close Negotiate Sales Enablers Leads Content Config./Quote Order Propose Monitoring/Reporting/Analytics Territory Mgmt. Accounts, Resources, Hierarchies Quota Mgmt. Revenue & Margin targets; New business Sales ICM Commissions, Bonuses, Accelerators
  • 12.
    Territory and QuotaSetting Opaque Seniority Politics &quot;Gut feeling&quot; Ad hoc Misaligned &quot;Gut feeling&quot; By executive dictate Budgeting Politics Not reflective of demand Territory Allocations Quota Assignments Transparent Fact-based Comprehensible Achievable Reflect responsibilities Meaningful Transparent Logically determined Balanced Equitable Reasonable opportunity Optimize coverage
  • 13.
    Quota Setting BusinessChallenges Challenge Solution Align sales with corporate goals Derive and communicate top level target Set quotas based on business need Top-down, Bottom-up and Bi-directional Utilize different business drivers Historical Sales, Territory Potential, Growth, Sales Effectiveness Manage and monitor approvals Hierarchy Level Rules, Workflows Communicate Quotas and Attainments Web or Excel enabled quota setting and dashboards Minimize confusion and ambiguity Standardized templates and guided workflows Integrate with revenue and comp systems Integrates with TrueComp and supports multiple data sources
  • 14.
    Quota Setting FlexibilityAcross Multiple Measures Allocate Quota Using Multiple Measures Customer Type (New, Existing, Strategic) Sales Volume Profit Margin / Price Realization Product Mix Multiple Quota-based with Accelerators Key Strategic Objectives (KSOs/MBOs) Market Share, Customer Satisfaction
  • 15.
    Analyze Attainment, FutureOpportunity Key Takeaways Exception highlighting show underperformance and over performance areas Identify seasonal trends in accounts
  • 16.
    Plan Quotas AgainstSales Goal Key Takeaways Uplift or downlift quotas, or bring forward existing quotas and add weightings or seasonality to them Compare scenarios side by side and select the best one Centralized business rules easy to update, rather than locked away in multiple spreadsheets etc. Have multiple targets based on optimizing product mix, account performance etc..
  • 17.
    Adjust Quotas andAdd Audit Trail 25,572 324,565 12,878 Key Takeaways Provides immediate feedback on what-if scenarios Can be performed in the Web or Excel client Can be performed in off line mode for traveling sales manager Can add supporting detail for to any change to ensure a change log its kept Greg is able to adjust his current targets for his teams accounts, and uplift them. For example, he has uplifted Finance Bank New York by 25%, and Comp Shop Texas by 20%, given last years over attainment. He can immediately see the impact on the overall target, and how it is closing the gap against the management target
  • 18.
    Reconcile Against SalesGoals Key Takeaways Identify key variances against top level goal Re model and create new scenarios as necessary
  • 19.
    Major realignments Creation,expansion or reduction of sales force New product mix, new target, new indication New competition Mergers, consolidations On-going maintenance Align to new business conditions as reflected in data updates New customer acquisition Personnel situations Territory management “ What-if” analyses Different strategy Plan variations Situations that Require Territory Realignment
  • 20.
    Efficient Territory OptimizationKey Takeaways Leverage any metric or attribute to create balanced territories Territories can be account based or area based, a combination of both; i.e.. Rep A has all the ‘red’ zip codes with the exception of one named account Users can view accounts, territories centers, values of areas, highways, etc… to design the most effective territories
  • 21.
    Key Takeaways “What-if” modeling – Users can simultaneously view several possible solutions for comparison Model and Balance Territories Based on Key Drivers Users have the ability to dial-in the relative importance of territory balance, geographic compactness and level of disruption when evaluating optimized scenarios.
  • 22.
    Incentives Drive FinancialPerformance Brand Management Motivating and Rewarding People Customer Service Turning Customer Info into Insight Attracting and Retaining People Building Selling and Service Skills Strong Value Propositions Partner and Alliance Management eCRM Sales Planning Key Account Management Advertising Customer Retention and Acquisition Managing Product and Service Mix Promotion Ability to Change the organization New Products and Services Segmentation Building Service Culture Channel Management ¹ Accenture CRM Research Potential Dollar Impact in $M on Pre-tax Profit of Moving from Average to High Performance for $1Bn Business Unit - Accenture CRM research 1.5 13.0 13.0 12.0 10.0 9.5 9.0 9.0 8.0 7.5 6.0 5.5 5.0 3.5 2.5 2.0 3.0 5.0 5.0
  • 23.
    Pay for Performancefrom Everyday Dashboard
  • 24.
    Detail to ReduceShadow Accounting
  • 25.
    Gain Summary Viewof Sales Performance, Incentive Opportunities
  • 26.
  • 27.
    Monitor Team Performance,Opportunities to Change Behavior
  • 28.
    Leading Enterprises areIntegrating SPM solutions Insurance Banking Telecom High Technology Life Sciences
  • 29.
    Continued Integration withsalesforce.com to Drive Customer Value “ As a customer of both Callidus Software and salesforce.com, we are pleased that the two solutions are becoming more fully integrated. With this integration, our sales representatives and sales executives will be able to view strategic sales force automation and sales performance management information together .” John Graham Executive Vice President Global Sales and Services at UGS PLM Software, a division of Siemens Automation and Drives .
  • 30.
    Summary: WhyCallidus On-Demand SPM? Flexible <60 days to go live Make changes any time Scalable Proven multi-tenant grid processing for scalable performance Reliable 99.5+% availability exceeds industry standard SLA’s Safe Type II SAS 70 certified Safe Harbor certified
  • 31.
    Sales Performance ManagementLeadership Most deployed solution Used by over 1.7 million sales professionals globally Unmatched breadth Plan spend, quotas, and territories Execute timely and cost effective incentives Deliver clear visibility through reporting and analytics to sales and finance Seamless access from Salesforce Deploy to sales organization through everyday Salesforce application
  • 32.
    Session Feedback Letus know how we’re doing! Please score the session from 5 to 1 (5=excellent,1=needs improvement) in the following categories: Overall rating of the session Quality of content Strength of presentation delivery Relevance of the session to your organization We strive to improve, t hank you for filling out our survey. Additionally, please score each individual speaker on: Overall delivery of session
  • 33.