


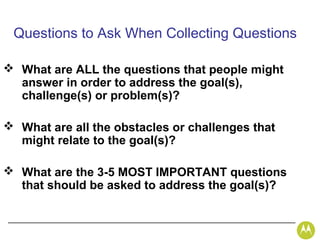


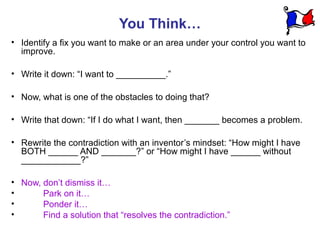
![“Even though one was correct at each stage, the situation may still have to be
restructured to proceed.” Edward de Bono [http://www.edwdebono.com/]
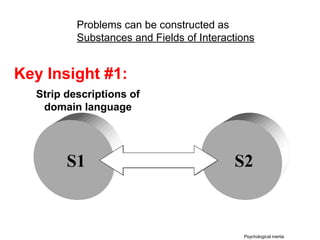
Key Insight #2:
Be willing to rearrange
what you know
(overcome psychological inertia!)
contradictions](https://image.slidesharecdn.com/ldssvsdiupdatedforwic2012-13542743753129-phpapp01-121130052149-phpapp02/85/Digital-Six-Sigma-vs-Directed-Innovation-95-320.jpg)

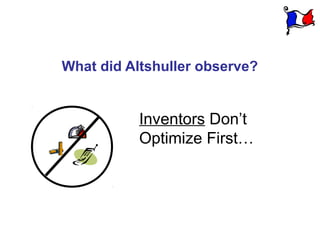
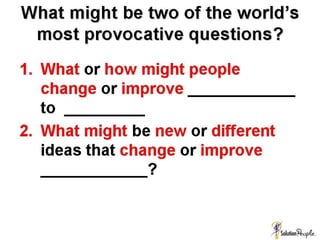
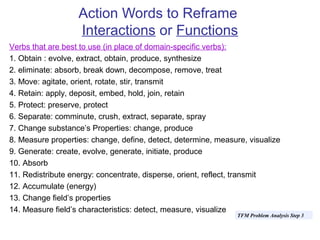
![400,000 Inventions Studied by Altshuller –
The Most Clever Solved Contradictions
Key Insight #3:
If you find yourself trading off features, reframe
your desire into, “I want BOTH [feature 1] AND
[feature 2].”
Then stay in this
creative space!](https://image.slidesharecdn.com/ldssvsdiupdatedforwic2012-13542743753129-phpapp01-121130052149-phpapp02/85/Digital-Six-Sigma-vs-Directed-Innovation-101-320.jpg)


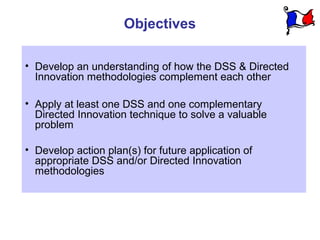
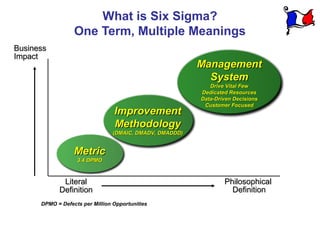
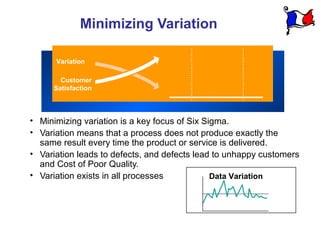
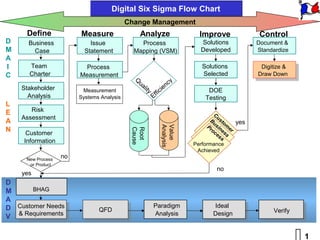
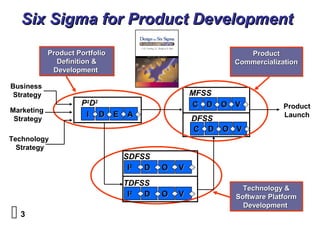
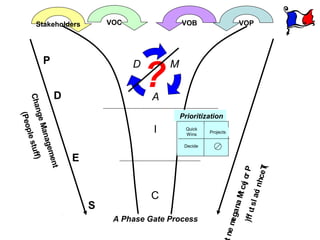
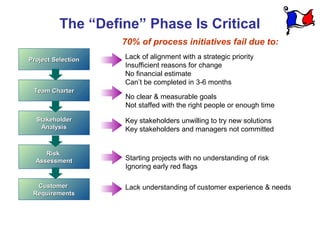
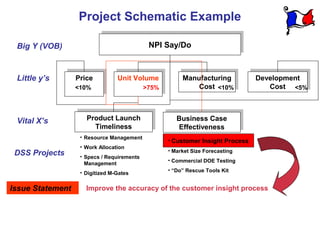
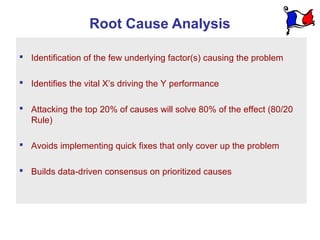
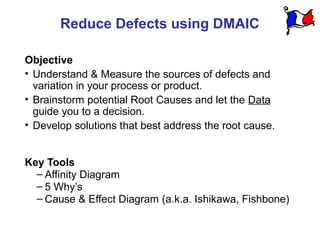
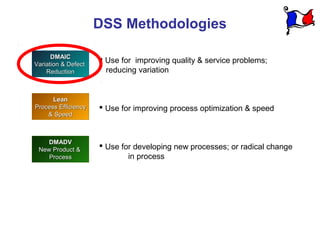
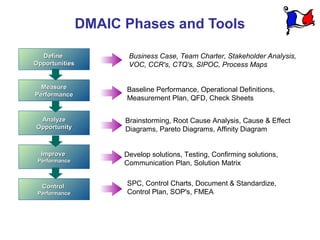
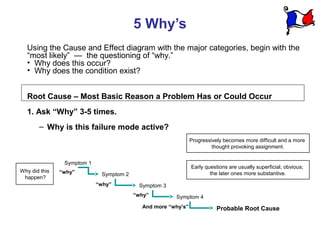
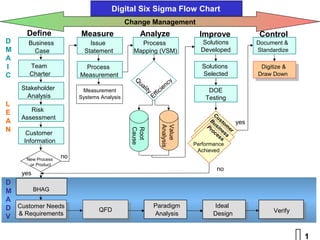
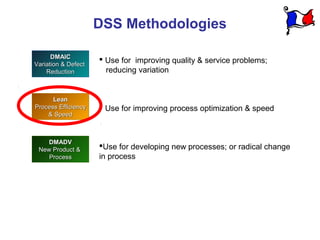
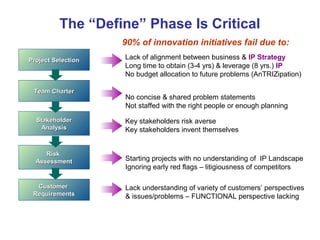
The document discusses how digital Six Sigma and directed innovation methodologies can complement each other to solve problems. It provides an overview of key Six Sigma concepts like the DMAIC process, variation, and root cause analysis tools. The presentation also examines factors that can cause Six Sigma projects to fail if not properly addressed, such as lack of stakeholder commitment or an unclear problem statement.