Download as PDF, PPTX
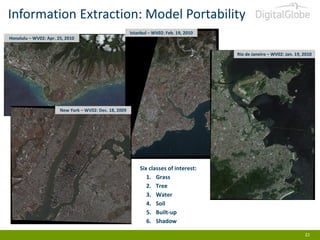
![NDVI from Surface Reflectance
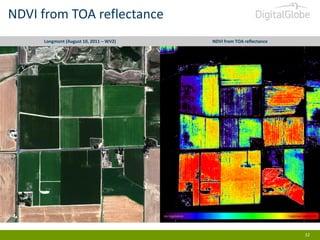
Longmont (August 10, 2011 – WV2)
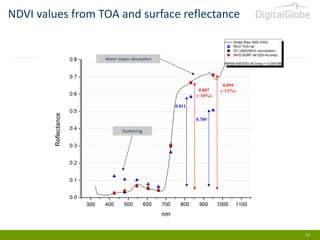
NDVI from surface reflectance
LAI: 0.56 [m2 /m2]
LAI: 4.53 [m2 /m2]
LAI: 3.72 [m2 /m2]
LAI: 4.45 [m2 /m2]
no vegetation
vigorous vegetation
13](https://image.slidesharecdn.com/rsmeetingmexicodec2013-digitalglobeoverviewkumarnavulur-140107145854-phpapp02/85/DigitalGlobe-Overview-13-320.jpg)
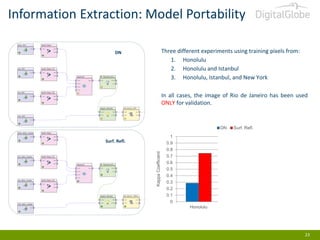
![Calibrated Tarps
The tarps were manufactured to guarantee a flat spectral response between
400 nm and 1050 nm, with a peek-to-peek variation in reflectance less than
10% between 10° and 60° off-nadir [3][4].
[3] M. Pagnutti, K. Holekamp, R.E. Ryan, R.D. Vaughan, J.A. Russell, D. Prados, and T. Stanley, “Atmospheric
correction of high spatial resolution commercial satellite imagery products using modis atmospheric products”,
in Analysis of Multi-Temporal Remote Sensing Images, May 2005, pp. 115 – 119.
[4] K. Holekamp, “NASA radiometric characterization”, in High spatial resolution commercial imagery workshop,
Reston, VA, Nov. 2004
18](https://image.slidesharecdn.com/rsmeetingmexicodec2013-digitalglobeoverviewkumarnavulur-140107145854-phpapp02/85/DigitalGlobe-Overview-18-320.jpg)


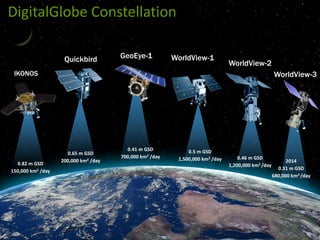
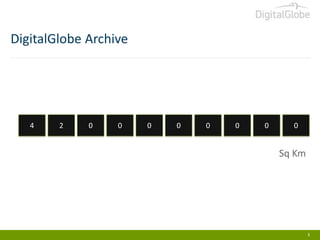
The document provides a comprehensive overview of DigitalGlobe's satellite constellation, including details about various satellite missions and their capabilities in capturing high-resolution imagery. It discusses the technological advancements in spectral bands for different applications, such as reflectance imagery and atmospheric correction, as well as time-series datasets for change detection in urban environments. The document also outlines future directions for automated information extraction and monitoring of environmental changes.


