Download to read offline
![Signal & Image Processing : An International Journal (SIPIJ) Vol.7, No.2, April 2016
DOI : 10.5121/sipij.2016.7202 23
ROUTING IN ALL-OPTICAL NETWORKS USING
RECURSIVE STATE SPACE TECHNIQUE
Mohan Kumar S1
and Jagadeesha S N2
1
Ph.D, Research Center, Jawaharalal Nehru National College of Engineering,
shimoga, Karnataka, India.
2
Department of Computer Science and Engineering,
Jawaharalal Nehru National College of Engineering, shimoga.
ABSTRACT
In this papr, we have minimized the effects of failures on network performace, by using suitable Routing
and Wavelenghth Assignment(RWA) method without disturbing other performance criteria such as blocking
probability(BP) and network management(NM). The computation complexity is reduced by using Kalaman
Filter(KF) techniques. The minimum reconfiguration probability routing (MRPR) algorithm must be
able to select most reliable routes and assign wavelengths to connections in a manner that utilizes the light
path(LP) established efficiently considering all possible requests.
KEYWORDS
Routing Wavelength Assignment (RWA), Blocking Probability(BP) Network Management(NM), Kalaman
Filter(KF),Wavelength interchange(WI), Light Path(LP), Process Noise(PN), Least Loaded Routing(LLR),
Minimum Reconfiguration Probability Routing (MRPR), Max-Sum Routing(MR), Adaptive
Unconstrained Routing(AUR)
1. INTRODUCTION
In this paper, we have considered a suitable algorithm for Routing and Wavelength
Assignment(RWA) for wide area networks, such as Wavelength routing network (WRN) which
has scalable architecture. WRN has mesh like structure consisting of links having one or more
fibers at each input port to output port in the optical domain. The challenging problem in these
networks are RWA and controlling problems. In these problems, provision of connections, called
lightpaths in a scalable architecture usually span multiple links. Hence, light path may be
assigned to different links along the route. This process is called Routing and Wavelength
Assignment. In this process, lightpaths share one or more fibers links and different wavelengths.
To establish a lightpath, a route should be discovered between source and destination and suitable
wavelength need to be assigned to that route. Some of the commonly used performance criteria
for Routing and Wavelength Assignment are throughput and blocking probability[10]. There are
many algorithms proposed for this purpose with optimal solutions[10]. The main assumption of
these algorithms are that, traffic volume is static for a long time period and these networks are
reconfigured only to reflect changes in the long term traffic demand[1]. Although static demand
has been reasonable assumption for voice data communication, in current trends and future, data
intensive networks are rapidly changing. Therefore dynamic RWA algorithms which support
request arrivals and lightpath terminations at stochastic/randaom times are needed. Hence
predefined set of routes are searched in a predefined order to accommodate the request. Then the](https://image.slidesharecdn.com/2-160512125217/85/Routing-in-All-Optical-Networks-Using-Recursive-State-Space-Technique-1-320.jpg)
![Signal & Image Processing : An International Journal (SIPIJ) Vol.7, No.2, April 2016
24
smallest index randomly selects a wavelength available on the route. If not, request is blocked.
Usually one or more minimum hop routes are used and fixed order search is carried out without
taking into account the congestion on the link. It will not further improve blocking performance.
An adaptive RWA algorithm makes use of the network state information at the time of routing to
find the optimum path using filter approach. Least loaded routing(LLR), Max-sum routing (MR)
and Adaptive unconstrained routing(AUR) are the examples for adaptive RWA process[3].
An Optical switch has ability to minimize the effects of failures on network performance by using
a suitable routing and wavelength assignment method without disturbing other performance
criteria such as network management and blocking probability[4]. The main challenge in the
Wavelength Routing Network (WRN) is the provision of connections called lightpaths between
the users of network. This method is called Routing and Wavelength Assignment scheme
(RWA)[2][10]. Here, one of the efficient Routing Wavelength Assignment method known as
statistically predictive dynamic RWA algorithm[3] is implemented using the kalman filter. This
algorithm makes use of the network state information at the time of routing to find the optimum
path according to an objective function for the request. By choosing as much reliable router/links
as possible in the RWA process, it is possible to minimize the mean number of light paths broken
due to failure. However, considering only reliability characteristics, lightpaths may have to be
routed on longer routes and blocking performance may be deteriorated. For this reason, this
algorithm is based on the joint optimization of the probability of reconfiguration due to
router/link failures and probability of blocking for the future requests. Therefore effect of
potential router/link failures is minimized without disturbing blocking probability
performance[7]. For this purpose lightpath arrival/holding time and failure arrival statistics
collected for each link and router, as well as the network state information at the time of request
arrival are used in routing decisions. That is, the behavior of the network is predicted by current
state information and statistics of the past, to assign the most reliable path to the lightpath
requests[9].
In the following section Minimum Reconfiguration Probability Routing (MRPR) algorithm is
presented, then the cost function is derived to process RWA in WRN networks. Finally
simulations studies are presented and analyzed in section 5.0. The concluding remarks and
directions for future work are presented in section 6.0.
2. MINIMUM COST PATH FOR A LIGHTPATH
In Wavelength Interchange networks, the wavelength routers have wavelength converters at the
output ports and are able to change the wavelength of all lightpath passing through it. Hence the
blocking of requests due to wavelength conflicts can be avoided and the blocking probability can
be significantly reduced[7]. Wavelength routers can also switch the wavelength of lightpaths, the
RWA problem in WI networks reduce to the light path routing problem. The routing problem is
solved, wavelengths on the links along the route can be assigned randomly. In order to find the
route with minimum reconfiguration probability for a lightpath request, a simple auxiliary graph
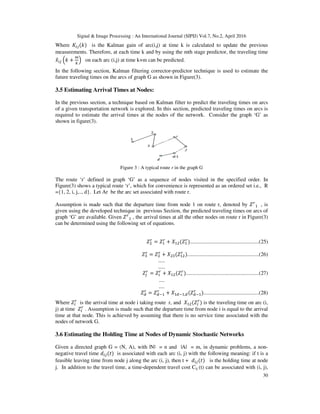
G= (N,E),where nodes N represent the routers and each directed edge(i,j), E represents the link
(i,j) from router i to router j, is constructed. Then, cost of each edge(i,j) is set to:
ܥ = ൜
∞
− ln൫1 − ܨ൯ − ln൫1 − ܴ൯ − ln൫1 − ܨ൯ ,
ௗ ௧ ௨௦ௗ
௧ ௪௦
....................(1)
Where, Fij is the probability of reconfiguration due to failure and Rij is the probability of
reconfiguration due to repacking on the link from router i to router j and Fj is the probability of
reconfiguration due to failure on router j for the lightpath to be routed [3]. In equation(1), Edge
cannot be used' means that the link (i,j) has no free wavelength channel at the time of routing.](https://image.slidesharecdn.com/2-160512125217/85/Routing-in-All-Optical-Networks-Using-Recursive-State-Space-Technique-2-320.jpg)
![Signal & Image Processing : An International Journal (SIPIJ) Vol.7, No.2, April 2016
25
2.1 Reconfiguration Due to Failure
In this paper, we present an efficient routing algorithm based on Kalman Filtering techniques to
predict a future state of the router in order to determine the accurate state of router to reconfigure
due to link or route failure. we propose the usage of Kalman Filters in routing. First, Kalman
Filter is employed for estimating the system based on several unknown parameters such as
processes and measurement noises at routing device.The probability of reconfiguration due to
failure for a lightpath on a resource (link or router) can be predicted in terms of mean of inter-
arrival times on that resource and mean of holding time for the lightpaths between the source and
destination routers. Probability of configuration due to failure, F, for a lightpath on a resource is
equal to the probability of a failure on that resource during the lifetime of the lightpath[3]. F can
be found as:
ܨ = ( ݂(ݔሻ݀ݔሻℎ(ݕሻ ݀ݕ
௬
௫ୀ
∞
௬ୀ
.............................................(2)
Where x is random variable representing failure inter-arrival times on the resource, f(x) is the
probability distribution function (pdf) of random variable x, y is a random variable representing
the lightpath holding times between the source and destination routers, h(y) is the pdf of random
variable y.
To determine F, knowledge of f(x) and h(y) are required. A straightforward way to evaluate
equation(2) is to approximate distribution function with mean and variance equal to the
corresponding values obtained from the statistics. Lightpath holding times are usually
approximated by an exponential distribution function and failure inter-arrival times are usually
approximated by an exponential or a Weibull distribution function, which will closely
approximate the observed phenomena. This calculation is done using Kalman equations(11) in
order to reduce the computational complexity. In particular, if both failures inter arrival-time and
lightpath holding times are approximated by exponential distribution functions, F can be found
as:
ܨ = න (න
1
݉
݁
ି
௫
ೕ ௗ௫
ሻ
1
݉
݁
ି
௬
௧ఏ
݀ݕ =
݉
݉ + ݉
௬
௫ୀ
∞
௬ୀ
… … … … . . . . . (3ሻ
Where, mh and mf are the mean holding time and mean failure inter arrival time, respectively.
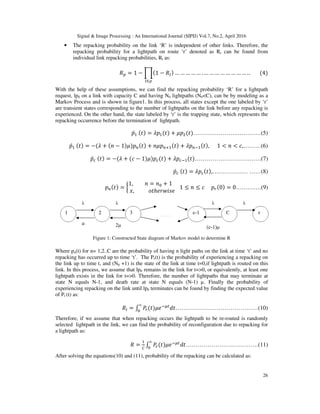
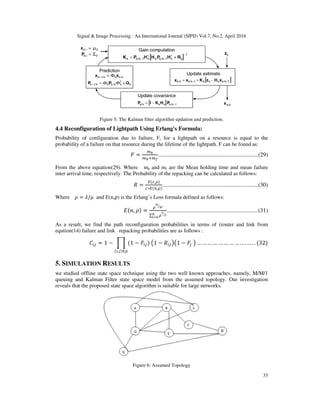
2.2 Reconfiguration Due to Repacking
The probability of reconfiguration due to repacking, R, for a lightpath on a link in the network
can be predicted in terms of the number of lightpaths currently passing through the link, arrival
rate and service time statistics for the lightpaths on the link[3]. To find R, we need to find the
probability of a call blocked due to lack of free capacity on that link during the lifetime of the
lightpath.
In order to evaluate the approximate repacking probabilities, we make following assumptions:
• Links in the network are independent of each other. That is, lightpath arrivals on each
link are independent processes and a lightpath on an ‘n’ link route behaves like ‘n’
independent lightpaths.
• Poisson arrivals and exponential holding times: lightpaths arrive on alink under
consideration according to a Poisson process with rate λ and lightpath holding times are
exponentially distributed with mean 1/µ.](https://image.slidesharecdn.com/2-160512125217/85/Routing-in-All-Optical-Networks-Using-Recursive-State-Space-Technique-3-320.jpg)
![Signal & Image Processing : An International Journal (SIPIJ) Vol.7, No.2, April 2016
27
ܴ =
ா(,ఘሻ
∗ா(,ఘሻ
..............................................................(12)
Where ρ =λ/µ and E (n, ρ) is the Erlang Loss Formula defined as:
,݊(ܧ ߩሻ =
ρ
!ൗ
∑ ρ
!ൗ
సబ
................................................................(13)
As a result, we find the path reconfiguration probabilities in terms of router or link failure and
link repacking probabilities as:
ܥ = 1 − ෑ (1 − ܨ
(,ሻ∈ఘ
ሻ ൫1 − ܴ൯൫1 − ܨ ൯ … … … … … … … … … … … (14ሻ
Where Cij is the cost of lightpath between nodes i and j. Fij is the probability of reconfiguration
due to failure in the link between node i and j. Rij is the probability of repacking between the
nodes i and j and Fj is the pro bability of reconfiguration due to the failure in the router located
at node j [8][9].
3. KALMAN FILTER TECHNIQUE
Kalman filter can be employed as a alternative to the Markov model to estimate the arrival and
holding times in an WRN and WI networks and solve the RWA problem are to be estimated.
3.1 Estimating the Arrival Time at Nodes of Stochastic and Dynamic Networks
Using Kalman Filter Technique
To estimate the arrival times at the nodes of a stochastic and dynamic network[5][7] a step prior
to route planning. A algorithm is developed to predict the traveling times along the arcs and
estimate the arrival times at the nodes of the network in real-time. It is shown that, under fairly
mild conditions, the developed arrival time estimator is unbiased and that the error variance of the
estimator is bounded.
Given a directed graph G = (N, A), with |N| = n and |A| = m, in dynamic problems, a non-
negative travel time dij(t) is associated with each arc(i, j) with the following meaning:
if t is a feasible leaving time from node i along the arc(i, j), then t + dij(t) is the arrival time at
node j. In addition to the travel time, a time-dependent travel cost cij(t) can be associated with (i,
j), which is the cost of traveling from i to j through (i, j) starting at time t. There is the possibility
of waiting at the nodes; in this case, a (unit time) waiting cost wi (t) can be associated with node i,
which gives the cost of waiting for unit time at i at time t. Given a route in a dynamic stochastic
transportation network, we develop a methodology to estimate the arrival times at the nodes of
that route. To estimate the arrival times, first step is developing a technique to predict the
traveling times on the arcs of the network in real-time. In this technique, available historical data
are used for predicting the traveling times, and new measurements are used to correct and update
our prediction at each instant of time. More precisely, this proposed methodology consists of the
following two stages:
1. Predicting traveling times on arcs: Given the time of the day together with the
historical and real-time data of traveling times on arcs of a transportation network, we predict the
future traveling times on those arcs, recursively.](https://image.slidesharecdn.com/2-160512125217/85/Routing-in-All-Optical-Networks-Using-Recursive-State-Space-Technique-5-320.jpg)
![Signal & Image Processing : An International Journal (SIPIJ) Vol.7, No.2, April 2016
28
2. Estimating arrival times at nodes: Given a route in the network, the departure time
from the first node of the route, and the predicted traveling times on arcs of the network (found in
stage 1), the arrival times at the nodes of the route are estimated.
In the following section, each stage is investigated and discussed in detail.
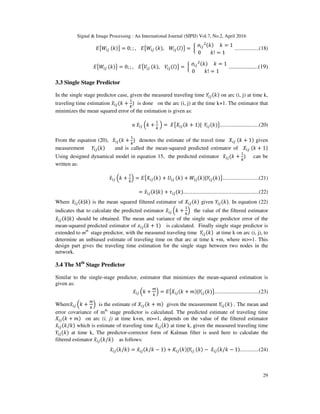
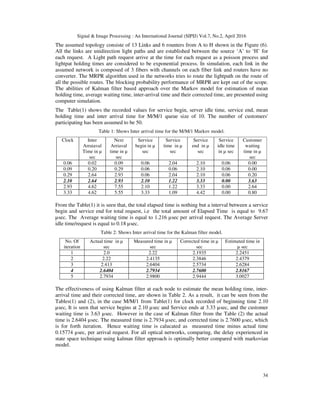
3.2 Predicting the Traveling Times on Arcs :
Let G:(N,A) be a transportation network (graph) with node set N={1...i, 1...j} and arc set A=(i,j).
A typical transportation network is shown in Figure(2).
Figure 2: A typical transportation network
In Figure(2) Solid lines represent the direct connections (arcs) between two adjacent nodes and
dashed lines are indirect connections, which consist of two or more arcs.
It is assumed that the historical data as well as the real-time information of traveling times on arcs
of the network are available. Let be the length of the planning horizon, K be an index of time in
the planning horizon, Xij(k) be the traveling time between nodes i and j at time k, Xh
ij(k) be the
historical traveling time on arc (i,j) at time k, Uij (k) be the historical change in the traveling time
on arc (i, j) from time k to k+1, Yij(k) be the measured traveling time on arc (i, j) at time k.
The dynamic behavior of the traveling time on arc (i ,j) is given by the system model equation as:
ܺ(݇ + 1ሻ = ܺ(݇ሻ + ܷ(݇ሻ + ܹ(݇ሻ … … … … … … … … … . . . (15ሻ
ܻ(݇ሻ = ܺ(݇ሻ + ܸ(݇ሻ … … … … … … … … … … . . . … (16ሻ
Where ܹ(݇ሻ is the traveling time disturbance on arc (i, j) at time k which is caused by the
addition of white Gaussian noise during switching from one wavelength to another wavelength at
each node. This noise is Known as process noise and ܸ(݇ሻ is the error in the traveling time
measurement of arc (i, j) at time k which is caused by the delay in the measurement. This delay in
measurement is known as measurement noise. ܹ(݇ሻ represents the real-time changes in the
traveling time at time k, which are not included in the historical data ܷ(݇ሻ[6].
Here ܷ(݇ሻ , ܹ(݇ሻ, ܸ(݇ሻ and ܺ(0ሻ are all mutually uncorrelated Gaussian random
variables with the following specifications:
ܧ൛ܷ (݇ሻൟ = ߬(ሻ(݇ሻ, ܧ൛ܷ (݇ሻ, ܷ(݈ሻൟ = ቐ
ߪ
ଶ(݇ሻ+= ߬
ଶ
(݇ሻ ݇ = 1
0,
݇! = 1
........(17)](https://image.slidesharecdn.com/2-160512125217/85/Routing-in-All-Optical-Networks-Using-Recursive-State-Space-Technique-6-320.jpg)
![Signal & Image Processing : An International Journal (SIPIJ) Vol.7, No.2, April 2016
31
which is the cost of traveling from i to j through (i, j). Mean holding time is calculated by
estimating the traveling time between the source and destination nodes and prior knowledge of
departure time at that node. Then ijth
Kalman filter coefficients are calculated on the basis of
above design. The implementation part is described in the following section.
4. PROPASED SYSTEM TO ESTIMATE AND MEASURE NOISE
Noises are random background events which have to be dealt with in every system processing
real input signals (requests). They are not part of the ideal signal and may be caused by an effect
of neighboring sources or delay in processing the request. The characteristics of noise depend on
their source.
4.1 Implementation of Process Noise to Estimate The Unknown Parameters:
The process noise is generated because of the signals being processed on the same wavelength
channel for some random period. Process noise can be analyzed both in wavelength convertible
networks as well as networks without converters. Q (the model/input noise covariance)
contributes to the overall uncertainty of the estimate as it is added to P (the error covariance
matrix) in each time step. When Q is large the Kalman Filter large changes in the actual output
more closely. This means there is a performance trade-off between tracking and noise in the
output in the choice of Q for the Kalman Filter[6][11].
4.2 Implementation of Measurement Noise to Estimate the Unknown Parameters:
The measurement noise is added to the signal because of the delay in the measurement device. If
the measuring device fails to measure the input data at some fixed time, then there will be delay.
Data will be the lightpath request. If the lightpath request is blocked for more than its lifetime,
then it is rejected permanently.
R (the measurement noise covariance) determines how much information from the sample is
used. If R is high the Kalman Filter measurement isn't very accurate. When R is smaller the
Kalman Filter output will follow the measurements more closely and accept more information
from them.
The effect of P (the error covariance matrix) on the Kalman Filter estimate is that when P is small
the Kalman Filter incorporates a lot less of the measurement into the estimate as it is fairly certain
of its time. Ideally P gets as close to zero as possible to indicate that the model is accurate. P is
generally reduced by measurements received; as there is more confidence in the estimated state if
there is a measurement to confirm it. However the reduction of P is limited by the model/input
variable error covariance Q which is added at each time step. Both P and R are incorporated into
the Kalman Filter through the Kalman gain K. The value of K determines how much of the
innovation (the difference between the actual measurement and the model measurement) is used
to correct the estimate. K varies in proportion to the error covariance matrix P and is inversely
proportional to the measurement covariance matrix R. If the measurement noise covariance R is
large compared to the error covariance matrix P then the Kalman gain K will be small. This
means the certainty of the measurement is small relative to the certainty of the current state model
and the old model is better compared to the new measurement so that minimal adjustment to the
estimate is required. Alternatively, if P is large compared to R, K will be large and the estimate of
X is updated to look more like the measurement than the previous estimate. The innovation is
weighted more heavily.](https://image.slidesharecdn.com/2-160512125217/85/Routing-in-All-Optical-Networks-Using-Recursive-State-Space-Technique-9-320.jpg)
![Signal & Image Processing : An International Journal (SIPIJ) Vol.7, No.2, April 2016
32
4.3 Important Routines in the Kalman Filter Implementation
In order to implement the Kalman Filter, the following steps need to be performed:
a) Model the System: A model of the system needs to be found. A knowledge of state space
representations is useful here. Modeling the system essentially means working out the
matrices Ô, B and H. Ô is the relationship between x in one time step, and x in the next,
given no inputs. B is the relationship between the inputs and the state. H is the
relationship between the measurement and the state (slightly more complicated for the
Extended Kalman Filter).
b) Noise Parameters: In theory R and Q can be calculated directly from the real world where
Q relates to model errors and input data errors, and R relates to measurement errors. In
practice these can't always be obtained accurately (or the effort involved is too great), or
the correct values don't give the required result. Tuning R too small will place too much
emphasis on the measurements making the filter varying. Tuning Q too large gives the
same result. Tuning R too large and Q too small will have the effect of making the filter
too slow, and it won't keep up with the actual changes in x. These values can be adjusted
until the filter gives the desired performance.
c) Initial Estimates: The state vector x and the error covariance matrix P need initial
estimates. Any 'guess' for x will mean that the estimate will eventually converge on the
right value, as long as P is non-zero. Given this, the best initial estimate is the 'middle' of
where x is likely to be. P needs to be chosen significantly large so that the filter is not too
slow and small enough that P doesn't remain large for too long.
d) Implement the Filter: Use the values obtained from the above steps and substitute them
into the Kalman Filter equations.
Figure 4: The Kalman Filter as a recursive linear filter.
At each cycle, the state estimate is updated by combining new measurements with the predicted
state estimate from previous measurements. Figure(5) shows the Kalman filter algorithm and its
four steps for computations are Gain computation, State estimate update, Covariance update, and
Prediction[6].](https://image.slidesharecdn.com/2-160512125217/85/Routing-in-All-Optical-Networks-Using-Recursive-State-Space-Technique-10-320.jpg)
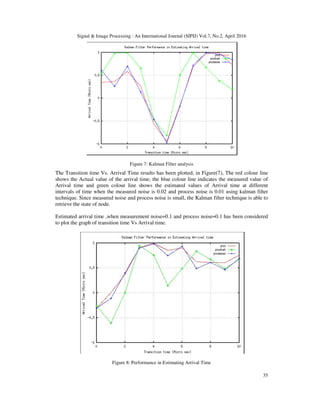
![Signal & Image Processing : An International Journal (SIPIJ) Vol.7, No.2, April 2016
36
As a second example, Figure(8) shows the performance in estimating the arrival time with a
measurement noise is equal to 1 and process noise is equal to 0.1. It is seen that the red colour
line shows the Actual value of the arrival time, the blue colour line indicates the measured value
of Arrival time and green colour line shows the estimated values of Arrival time at different
intervals of time. Henece it is able to retrieve the state of node, from this case study, it is possible
to retrieve the state and redirect the routing direction at the node level by using filter approach
this leads optimal performace. For simuations, we used GNU OCTAVE TOOL and Ubutu
Operating system 14.01.
6. CONCLUSION
Since the statistics are used in conjunction with the present state information, it is naturally
expected that the Kalaman filter algorithm achieves better routing performance compared to
earlier adaptive RWA algorithms especially M/M/1 under non-uniform traffic conditions, namely
M/M/1. We suggest that further research in this direction is likely to find the over-head time taken
to estimate arrival time and customer waitng time in each case and their comparisons with
markov model may yield better result.
The effectiveness of the kalman filter approach for RWA problem compared to LLR and Max –
sum routing approach will be communicated.
REFERENCES
[1] Stefano Baroni and Polina Bayvel, Wavelength requirements in arbitrarily connected wavelength-
routed optical networks, Lightwave Technology, Journal of 15 (1997), no. 2, 242-251.
[2] Ezhan Karasan and Ender Ayanoglu, Performance of wdm transport networks, Selected Areas in
Communications, IEEE Journal on 16 (1998), no. 7, 1081-1096.
[3] Altan Kocyigit and Semih Bilgen, Statistically predictive optimal wavelength routing, Optical
Networks Magazine (2003).
[4] Altan Kocyigit, and Semih Bilgen, All-optical networking, Turkish Journal of Electrical Engineering
& Computer Sciences 9 (2001), no. 2, 69-122.
[5] Peter S Maybeck, Stochastic models, estimation, and control, vol. 3, Academic press, 1982.
[6] The kalman filter, an introduction to concepts, Autonomous Robot Vehicles, Springer, 1990, pp. 194-
204.
[7] Athanasios Papoulis and S Unnikrishna Pillai, Probability, random variables, and stochastic
processes, Tata McGraw-Hill Education, 2002.
[8] Rajiv Ramaswami, Multiwavelength lightwave networks for computer communication,
Communications Magazine, IEEE 31 (1993), no. 2, 78-88.
[9] Marcelo Yannuzzi, Xavier Masip-Bruin, Sergio Sanchez-Lopez, Eva Marin-Tordera, Josep Sole-
Pareta, and Jordi Domingo-Pascual, Interdomain rwa based on stochastic estimation methods and
adaptive filtering for optical networks., GLOBECOM, 2006.
[10] Jay Y Yoo and Subrata Banerjee, Design, analysis, and implementation of wavelength-routed all-
optical networks: routing and wavelength assignment approach, IEEE Communications Surveys,
Broadband Network area (1997).](https://image.slidesharecdn.com/2-160512125217/85/Routing-in-All-Optical-Networks-Using-Recursive-State-Space-Technique-14-320.jpg)
![Signal & Image Processing : An International Journal (SIPIJ) Vol.7, No.2, April 2016
37
[11] Y.Donoso G.A Montoya, F.Solano, An Energy-Efficient and Routing Approach for Position,
Estimation using Kalman Filter Techniques in Mobile WSNs, CCC publications, International Journal
of Computer Communications and Control ISSN-1841-9836, 10(4):500-507 August 2015
[12] Mohana Kumar S, and Jagadeesh S N, “Routing and Wavelength Assignment for Optical Networks
using Link State Space Technique”, in Proceedings of the 6th IETE National Conference on RF &
Wireless, 09-11 May 2013 shimoga Karnataka pp. 116–119.
[13] Mohan Kumar S, Jagadeesh SN, Swaroop “A case study on Markov model for double fault tolerance,
comparing cloud based storage system” IJARCCE vol 4, Issue 11, November 2015, DOI 10.17148
pp 240-245
AUTHORS
Mohan Kumar S. received his Bachelor of Engineering in Computer Science &
Engineering and Master of .Technology, in Networking and Internet Engineering,
from Visvesvaraya Technological University, Belgaum, and Karnataka, India
respectively. He is currently working towards a Doctoral Degree from Visvesvaraya
Technological University, Belgaum, and Karnataka, India. At present he is working
as Assistant Professor, Department of Information Science and Engineering
M.S.Ramaiah Institute of Technology Bangalore. Karnataka. India (Affiliated to
Visvesvaraya Technological University Belgaum),
Dr. Jagadeesha S N received his Bachelor of Engineering., in Electronics and
Communication Engineering, from University B. D. T College of Engineering.,
Davangere affiliated to Mysore University, Karnataka, India in 1979, M.E. from
Indian Institute of Science (IISC), Bangalore, India specializing in Electrical
Communication Engineering., in 1987 and Ph.D. in Electronics and Computer
Engineering., from University of Roorkee, Roorkee, India in 1996. He is an IEEE
member. His research interest includes Array Signal Processing, Wireless Sensor
Networks and Mobile Communications. He has published and presented many papers
on Adaptive Array Signal Processing and Direction-of-Arrival estimation. Currently he is professor in the
Department of Computer Science and Engineering, Jawaharlal Nehru National College of Engineering.
(Affiliated to Visvesvaraya Technological University), Shimoga, Karnataka, India](https://image.slidesharecdn.com/2-160512125217/85/Routing-in-All-Optical-Networks-Using-Recursive-State-Space-Technique-15-320.jpg)

This paper presents a method for minimizing failures in all-optical networks by employing routing and wavelength assignment (RWA) techniques that maintain network performance criteria. The proposed Minimum Reconfiguration Probability Routing (MRPR) algorithm utilizes Kalman filter techniques to predict network states and optimize light path routing while considering the reliability of routes. The findings suggest that this approach effectively reduces blocking probability and enhances management of dynamic traffic demands in wavelength routing networks.