Download as PDF, PPTX


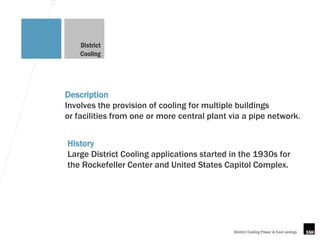
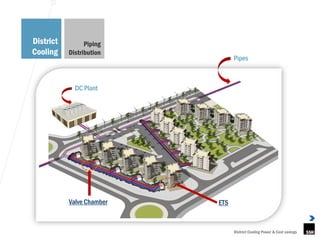


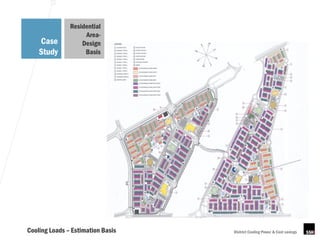


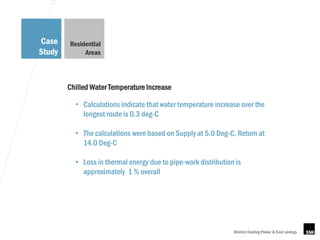


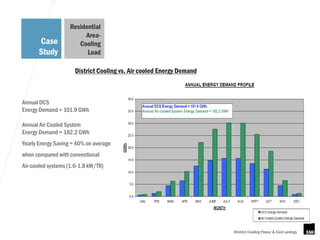


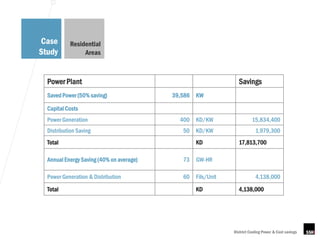


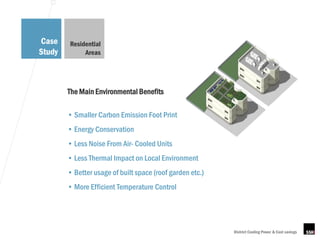


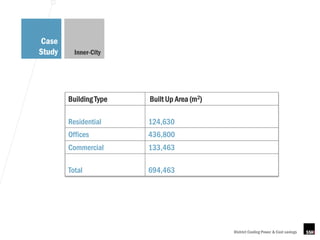


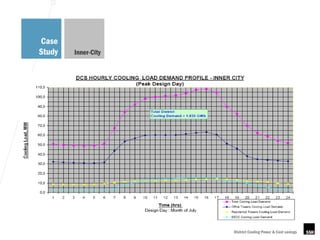
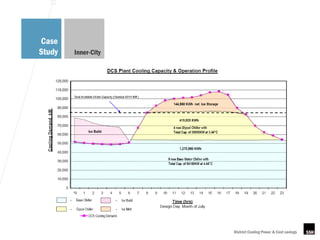


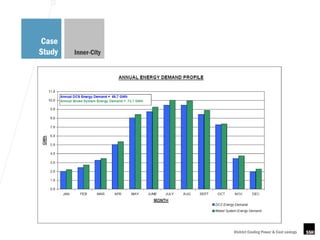


District cooling involves providing cooling from a central plant to multiple buildings via pipes. It started in the 1930s. A case study on a residential area in Jaber Al-Ahmad City found that a district cooling system with thermal storage could provide yearly energy savings of 40% compared to conventional air cooling systems and reduce peak power usage by 50% on average. The district cooling plant would have a capacity of 41,670 tons and use 101.9 GWh of energy annually to serve over 1,600,000 square meters of buildings.


