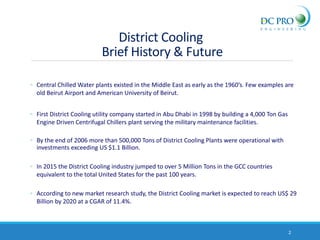
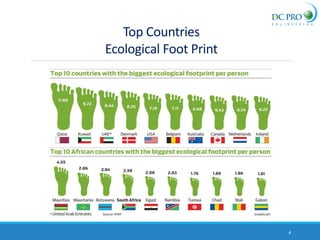
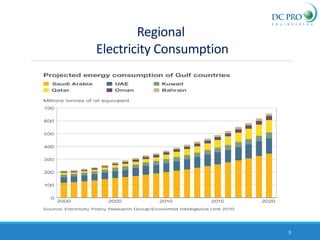
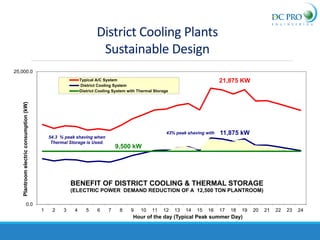
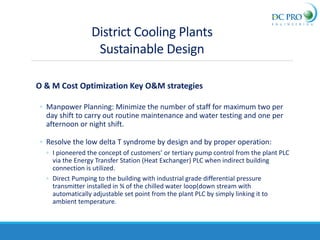
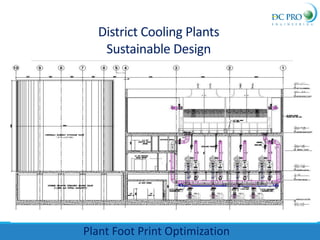
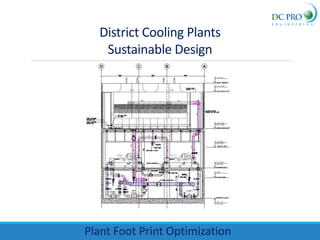
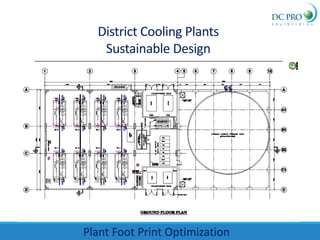
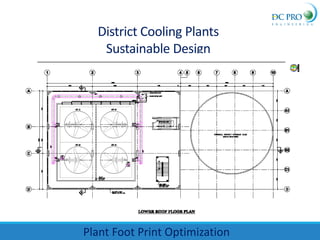
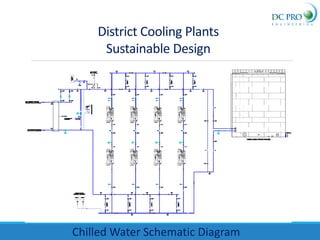
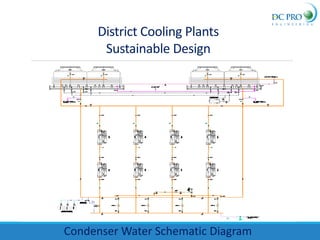
This document summarizes a presentation on district cooling and sustainable design. It discusses the history of district cooling in the Middle East since the 1960s. It then covers key topics in the presentation such as the growth and future outlook of the district cooling market, why district cooling is important, the main drivers of district cooling adoption, and sustainable design considerations for district cooling plants including energy efficiency, reliability, and water optimization. The document provides examples of district cooling plant designs and operational strategies to reduce costs and environmental impacts.
2. ◦ Central Chilled Water plants existed in the Middle East as early as the 1960’s. Few examples are
old Beirut Airport and American University of Beirut.
◦ First District Cooling utility company started in Abu Dhabi in 1998 by building a 4,000 Ton Gas
Engine Driven Centrifugal Chillers plant serving the military maintenance facilities.
◦ By the end of 2006 more than 500,000 Tons of District Cooling Plants were operational with
investments exceeding US $1.1 Billion.
◦ In 2015 the District Cooling industry jumped to over 5 Million Tons in the GCC countries
equivalent to the total United States for the past 100 years.
◦ According to new market research study, the District Cooling market is expected to reach US$ 29
Billion by 2020 at a CGAR of 11.4%.
2
District Cooling
Brief History & Future
7. 7
District Cooling
Main Drivers
Environment
Reduction of CO2 and Refrigerant Emissions by 40 to 70%
Government or Utility Company
Over 50% Reduction of Electric Power Consumption
District Cooling Provider
12 to 15% Internal Rate of Return (IRR)
Developers
Up to 8% Capital Cost Savings
9. District Cooling Plants
Sustainable Design
Design Broad Objectives
◦ Most Design Point Energy Efficient.
◦ Cost effective.
◦ Smallest foot print.
◦ Most Energy Efficient based on Year Round Operational.
◦ High reliability.
◦ Maintainability.
◦ Good Aesthetics.
10. Design Specific Objectives
◦ Maximum Design Zero Tolerance Point KW/Ton (Total Plant)
◦ Cond. 94 / 106OF + CHW 56 / 40 OF (Middle east) 0.90 KW/Ton
◦ Cond. 85 / 107 OF + CHW 56 / 40 OF (USA) 0.82 KW/Ton
◦ Cost effective
◦ Less Than US $ 1,200 / Ton for total plant for a plant size of around 10,000 Ton.
◦ Smallest foot print
◦ 10 Ton / m2 inclusive of thermal storage for plant size of less than 10,000 Ton capacity.
◦ 15 Ton / m2 inclusive of thermal storage for plant size of more than 20,000 Ton capacity.
◦ Most Energy Efficient based on Year Round Operation
◦ Annual operating Efficiency of 0 to 10% lower than design
District Cooling Plants
Sustainable Design
11. Design Specific Objectives
◦ High reliability.
◦ 99.96% Availability ( Less than 3.5 Hours Total Outage per Year)
◦ Maintainability.
◦ Ability to clean condenser tubes once a year in less than 4 working Hours per
condenser.
◦ Ability to remove any component in the plant within 8 working hours.
◦ Good Aesthetics.
◦ As Judged by general public
District Cooling Plants
Sustainable Design
12. Series Counter flow vs. Parallel
Chillers’ arrangement
◦ Simplifies piping arrangement and reduce # of primary chilled water
pumps, condenser pumps, valves, control valves and possibly cooling
towers cells.
◦ Hence reduce foot print and construction cost.
◦ Reduce power consumption by 0.03 KW/Ton or around 3.9%.
◦ Reduction in # of chillers may have an adverse effect on part load
performance as well as overall plant reliability which will resolved by using
thermal storage.
13. Typical Chillers Selection (Parallel & series / Parallel counter Flow)
Compressor Compressor Condenser CT Fan Total Electric
Chiller or pump or pump Pressure Pumping Pressure Pumping absorbed Power Demand
Qty Capacity Input Power Input Power Flow drop Power Flow drop Power Power
Ton KW KW/Ton GPM ft KW GPM ft KW KW KW KW / Ton
Parrallel flow
94 / 104 O
F Cod. Water Temp. , 2.91
GPM/Ton
Parallel Chillers 10 1,255 910 0.73 3,654 22 21 1,880 11 6 35 971 0.774
Cooling Tower lift 10 3,654 15 14
Total Plant 12,550 9,100 0.73 353 55 350 9,858 0.785
Total Plant (Mech. + TES) 15,688 9,100 0.58 353 55 350 9,858 0.628
Parrallel flow
94 / 106 O
F Cod. Water Temp. , 2.44
GPM/Ton
Parallel Chillers 10 1,184 883 0.75 2,887 14 11 1,773 10 5 24 922 0.779
Cooling Tower lift 10 2,887 15 11
Total Plant 11,840 8,830 0.75 221 47 240 9,338 0.789
Total Plant (Mech. + TES) 14,800 8,830 0.60 221 47 240 9,338 0.631
Series - Parrallel Counter flow
94 / 106 O
F Cod. Water Temp. , 2.43
GPM/Ton
Upstream Chiller 5 1,215 858 0.71 6,072 12 19 3,680 8 8 25 910 0.749
Downstream Chiller 5 1,285 903 0.70 6,072 12 19 3,680 8 8 25 955 0.743
Cooling Tower lift 5 6,072 15 24
Total Plant 12,500 8,805 0.70 308 77 250 9,440 0.755
Total Plant (Mech. + TES) 15,625 8,805 0.56 308 77 250 9,440 0.604
Series - Parrallel Counter flow
94 / 107 O
F Cod. Water Temp. , 2.2
GPM/Ton
Upstream Chiller 5 1,215 874 0.72 5,478 12 17 3,680 8 8 22 921 0.758
Downstream Chiller 5 1,285 906 0.71 5,478 12 17 3,680 8 8 22 953 0.741
Cooling Tower lift 5 5,478 15 21
Total Plant 12,500 8,900 0.71 278 77 220 9,475 0.758
Total Plant (Mech. + TES) 15,625 8,900 0.57 278 77 220 9,475 0.606
Series - Parrallel Counter flow
94 / 108 O
F Cod. Water Temp. , 2.05
GPM/Ton
Upstream Chiller 5 1,222 875 0.72 5,070 9 11 3,701 8 8 20 914 0.748
Downstream Chiller 5 1,250 900 0.72 5,070 8 11 3,701 8 8 20 939 0.751
Cooling Tower lift 5 5,070 15 20
Total Plant 12,360 8,875 0.72 212 77 200 9,364 0.758
Evaporator
District Cooling Plants
Sustainable Design
14. Benefits of Thermal Storage
◦ According to field Data the load profile indicate that 20% peak shaving is
the analyzed average field data vs. less than 10% in computer modeling
due to non accuracy of weather and solar data.
◦ Stratified water Thermal storage tank reduce total construction cost by
almost US $ 2,000,000 in a 12,500 Ton plant or by 12% of the total chilled
water plant cost of around US $ 15,500,000.
District Cooling Plants
Sustainable Design
15. 21,875 KW
11,875 kW
9,500 kW
0.0
25,000.0
1 2 3 4 5 6 7 8 9 10 11 12 13 14 15 16 17 18 19 20 21 22 23 24
Plantroom
electric
consumption
(kW)
Hour of the day (Typical Peak summer Day)
BENEFIT OF DISTRICT COOLING & THERMAL STORAGE
(ELECTRIC POWER DEMAND REDUCTION OF A 12,500 TON PLANTROOM)
Typical A/C System
District Cooling System
District Cooling System with Thermal Storage
54.3 % peak shaving when
Thermal Storage is Used.
43% peak shaving with
District Cooling Plants
Sustainable Design
16. Cooling Tower make Up Water
◦ Evaporation Losses is estimated at 7.2 Lit/ton-Hr (1.9 US Gal / Ton-Hr) or
1.3% of the 2.43 US GPM / Ton of condenser Flow Rate.
◦ Desalinated Fresh Water in UAE is very soft and has salt content of 150
ppm. Hence # of cycle of concentration is 5 and the blow-down from the
cooling tower is 1.8 Lit/ton-Hr (0.475 US Gal / Ton-Hr) making the total
water usage of (9.0 Lit/ton-Hr (2.375 US Gal / Ton-Hr).
◦ Treated Sewage Effluent (TSE) is rich in nitrate and other dissolved solid.
The # of cycle of concentration is 2.5 and the blow-down from the cooling
tower is 4.8 Lit/ton-Hr (1.27 US Gal / Ton-Hr) making the total TSE water
usage of (12.0 Lit/ton-Hr (3.17 US Gal / Ton-Hr).
District Cooling Plants
Sustainable Design
17. Cooling Tower make Up Water (cont’d)
◦ The best application for Cooling Tower water optimization is to utilize TSE
water when available and fresh water when TSE water is short. Hence the
plant is designed to operate with both water sources with separate tank
and pumping arrangement for each.
◦ The best Application to reutilize blow-down water is its direct usage in
irrigation for non edible plantation.
◦ One application in UAE has recycled blow-down via dechlorinification
process (As Chlorine deteriorate the R.O membrane) and the via an R.O
plant for re-use in cooling tower make up.
District Cooling Plants
Sustainable Design
18. Cost & Plant Foot Print Optimization Key Strategies
◦ Install Thermal Storage Tank above water storage.
◦ Have a proper equipment layout where piping is flowing in smooth logical
sense and along with proper layout and under ceiling cross over would
minimize piping length and maintain adequate and open maintenance
space.
◦ Proper Electrical Equipment Layout where Medium Voltage Switchgear and
transformer room are segregated in separate G.F rooms with proper
cooling or ventilation and adequate fire protection is maintained.
◦ Install low voltage MCC under transformers directly and close to the
pumps in the basement level to minimize cable runs.
District Cooling Plants
Sustainable Design
19. Cost & Plant Foot Print Optimization Key Strategies
◦ Industrial Control: If you cannot measure it you cannot manage it.
◦ Industrial control based on PLC and SCADA that communicate directly with
electric equipment switchgear and can communicate Industrial
communication protocol’s that generate automated online, hourly, daily,
weekly and monthly reports on plant power and water consumption.
◦ Utilize high precision field bus communicated industrial grade
instrumentation, High accuracy magnetic or ultrasonic flow Meters and
high accuracy class 0.5 amp meters.
District Cooling Plants
Sustainable Design
20. O & M Cost Optimization Key O&M strategies
◦ Manpower Planning: Minimize the number of staff for maximum two per
day shift to carry out routine maintenance and water testing and one per
afternoon or night shift.
◦ Resolve the low delta T syndrome by design and by proper operation:
◦ I pioneered the concept of customers’ or tertiary pump control from the plant PLC
via the Energy Transfer Station (Heat Exchanger) PLC when indirect building
connection is utilized.
◦ Direct Pumping to the building with industrial grade differential pressure
transmitter installed in ¾ of the chilled water loop(down stream with
automatically adjustable set point from the plant PLC by simply linking it to
ambient temperature.
District Cooling Plants
Sustainable Design
21. District Cooling Plants
Sustainable Design
Chiller Plant Part Load Performance @ 85O
F Ent. Cond. Temp.
Impact of Low Chilled Water D T
Description
Demand Cooling Load - Ton 5,000 5,000 5,000 5,000 5,000 5,000
Chiller Capacity - Ton 2,500 2,500 2,500 2,500 2,500 2,500
Chiller CHW Flow - GPM 3,750 3,750 3,750 3,750 3,750 3,750
Number of Operating Chillers 2 3 4 4 6 8
Chiller % Loading 100.0% 75.0% 62.5% 50.0% 37.5% 25.0%
Chilled water supply Temp. - O
F 40 40 40 40 40 40
Chilled water return Temp. - O
F 56 52 50 48 44 44
Chilled Water Delta T - O
F 16 12 10 8 6 4
Chilled Water Flow - GPM 7,500 10,000 12,000 15,000 20,000 30,000
KW / Unit KW KW/Ton KW KW/Ton KW KW/Ton KW KW/Ton KW KW/Ton KW KW/Ton
PCWP Pump 63 125 0.025 188 0.038 250 0.050 250 0.050 375 0.075 500 0.100
SCWP Pump 25 0.005 59 0.012 102 0.020 200 0.040 474 0.095 1,600 0.320
CCP Pump 175 350 0.070 525 0.105 700 0.140 700 0.140 1,050 0.210 1,400 0.280
CT Fan 75 150 0.030 225 0.045 300 0.060 300 0.060 450 0.090 600 0.120
Chiller Compressor 3,347 0.669 3,367 0.673 3,490 0.698 3,694 0.739 4,112 0.822 4,928 0.986
Plant Auxilliaries 250 0.050 250 0.050 250 0.050 250 0.050 250 0.050 250 0.050
Total Plant 4,247 0.849 4,614 0.923 5,093 1.019 5,394 1.079 6,711 1.342 9,278 1.856
% Increase Base 8.6% 19.9% 27.0% 58.0% 118.5%
O & M Cost Optimization through DT Control
29. Customers’ Interphase
Recognition of Green Buildings Regulations
District Cooling Utilities sell cooling energy and meter that energy on hourly basis, it can
recognize efficient building from non efficient building from the perspective of cooling
Energy Usage per square meter of building per year (Ton-Hr / m2 / Yr) and Demand Cooling
per square meter (m2 / Ton) which is a key requirement of measurement and verifications
of many Green Buildings codes
District Energy Can issue an Energy Efficiency awards for different type of buildings
categories (Malls, hotels, Residential, Offices, etc..)
30. Customers’ interphase
Connections type
Direct Connection
◦ Recommended for low rise with total capacity below 15,000 Ton.
◦ Precautions should be given for monitoring buildings highest point pressure with motorized
valve to isolate buildings with potential leakage.
◦ Is the most energy efficient method and simplest to control Low DT Syndrome.
Direct connection with tertiary customer pumps
◦ Recommended for low rise with large customer buildings of at 1,000 Ton per building.
◦ De-coupler between secondary and tertiary circuit and control the secondary pumping to
achieve minimal pressure of 5 psi (0.3 Bar) at the suction of the tertiary pump.
◦ Difficult to control and manage, require careful design details.
Indirect connection with plate heat exchanger
◦ Recommended for high rise with large customer buildings.
◦ Decouple secondary and tertiary that increase reliability.
◦ Consider parallel plate or Brazed exchangers.
31. Customers’ interphase
Low DT control
• Utilize Industrial grade Differential Pressure Indicator.
• Control The secondary pumps and tertiary pumps from the Plant Room SCADA
utilizing a polynomial proportional to the ambient temperature to set
automatically the Differential Pressure set point to control the signals that set
the VFD drives speed. For example:
• At ambient temperature of 45OC set DP = 1.0 Bar ( 15 psig)
• At ambient temperature of 25OC set DP = 0.2 Bar ( 3.0 psig)
• At ambient temperature of 35OC set DP = (1+0.2)/2 =0.6 Bar ( 9 psig)
• This will resolve low Delta syndrome and save pumping energy at all level.
• Improve plant room efficiency.
• Improve Thermal storage tank capacity.