Downloaded 12 times

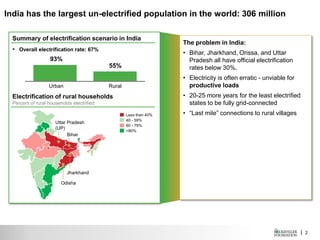
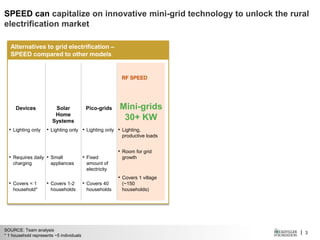
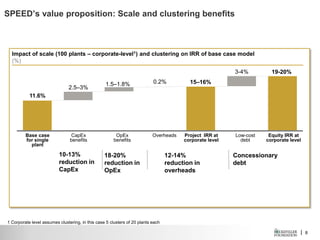
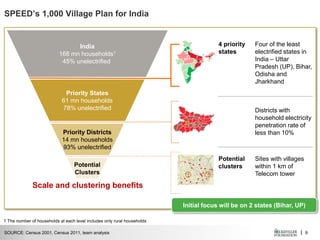


India has the largest un-electrified population in the world at 306 million people, with rural electrification rates below 30% in states like Bihar, Jharkhand, Odisha, and Uttar Pradesh. The SPEED model proposes using innovative mini-grid technology to provide renewable energy to rural villages, as extending the centralized grid will take over 20 more years. SPEED aims to electrify 1,000 villages through mini-grids serving households, productive loads, and telecom towers, taking advantage of scale and clustering benefits to increase the return on investment.


