Downloaded 115 times


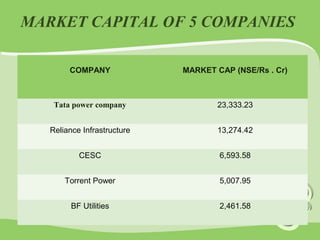


The document provides an overview of the power industry in India. It notes that as of 2014, India had an installed power capacity of 237.742 GW, with non-renewable sources making up 87.55% and renewable 12.45%. In 2012-2013, India generated around 911 billion units of electricity. Key sources of power discussed include thermal, nuclear, wind, solar, and coal. The largest players in the Indian power market by market capitalization are listed and described briefly.


