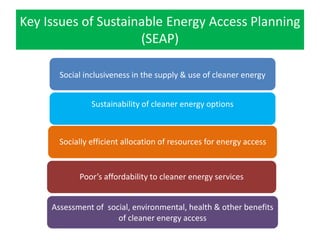
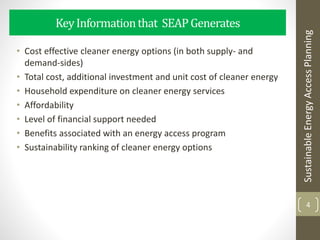
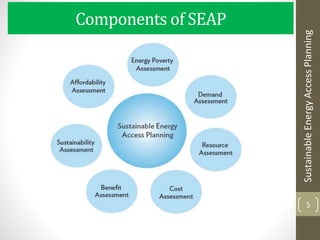
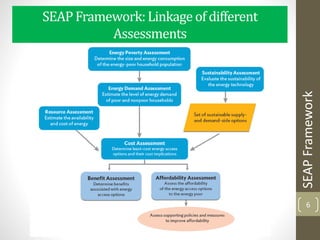
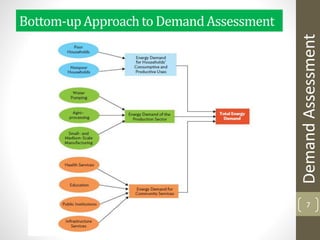
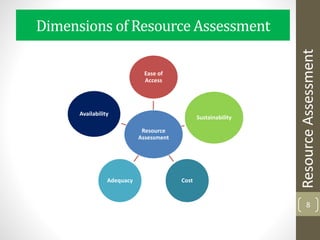
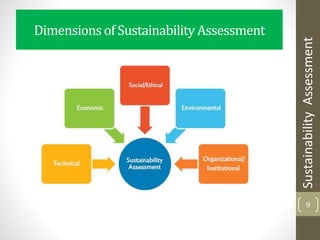
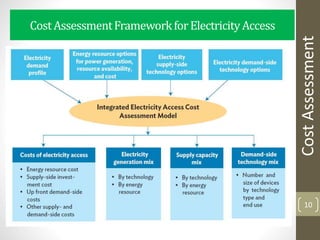
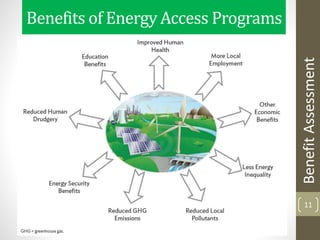
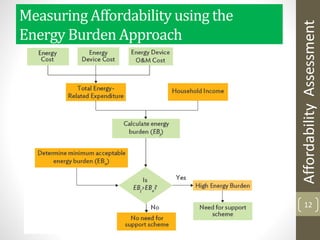
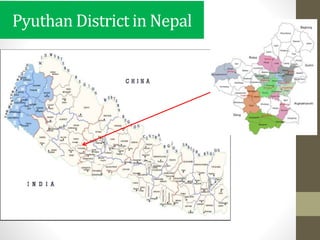
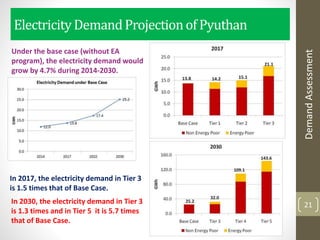
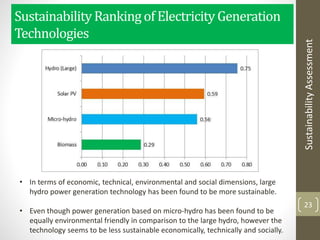
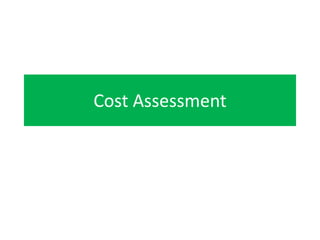
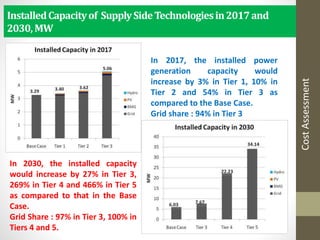
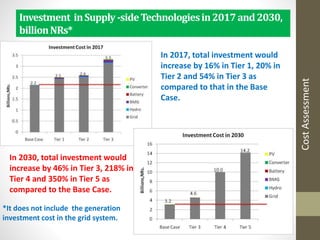
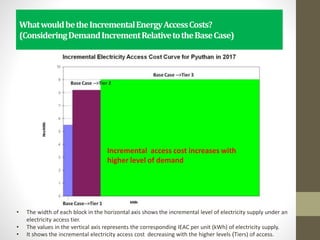
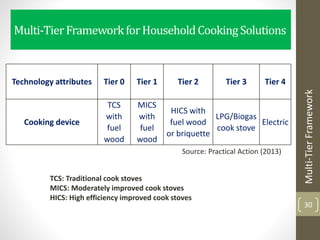
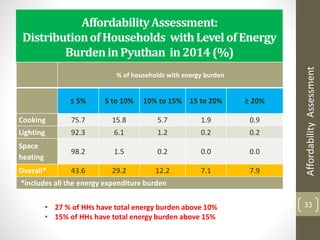
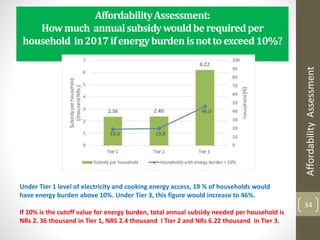
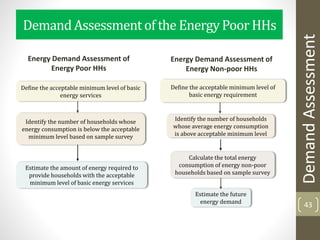
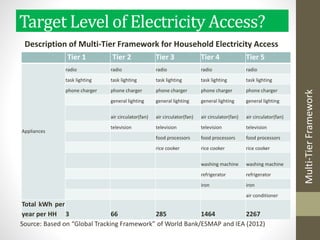
This document presents a framework for sustainable energy access planning (SEAP). Key components of the SEAP framework include assessing energy demand, available resources, sustainability of options, costs, affordability, and benefits. The framework is applied in a case study of Pyuthan District, Nepal. Demand projections show increased electricity access over time. Large hydro and improved cookstoves are identified as most sustainable options. Cost assessments find least-cost solutions and investment needs. Affordability analysis determines subsidy requirements. Health, economic, and environmental benefits of access are quantified. The SEAP framework provides a holistic approach to planning sustainable energy access programs.
1. Sustainable Energy Access
Planning Framework
Ram M. Shrestha and Jiwan S. Acharya
1
SE4ALL Consultation Workshop: Monitoring the Status of Asia-Pacific
Discovery Suites, Ortigas Center, Pasig City, Philippines, 14 June 2015
3. Key Issues of Sustainable Energy Access Planning
(SEAP)
Social inclusiveness in the supply & use of cleaner energy
Sustainability of cleaner energy options
Poor’s affordability to cleaner energy services
Socially efficient allocation of resources for energy access
Assessment of social, environmental, health & other benefits
of cleaner energy access
4. KeyInformationthat SEAPGenerates
4
• Cost effective cleaner energy options (in both supply- and
demand-sides)
• Total cost, additional investment and unit cost of cleaner energy
• Household expenditure on cleaner energy services
• Affordability
• Level of financial support needed
• Benefits associated with an energy access program
• Sustainability ranking of cleaner energy options
SustainableEnergyAccessPlanning
15. Background
• Both primary as well as secondary data used.
• Sample survey data of 2330 households covering all the
49 VDCs in the district.
• Secondary data from government sources at district and
national level and private agencies/offices and their
publications used.
15
21. ElectricityDemandProjectionof Pyuthan
21
In 2017, the electricity demand in Tier 3
is 1.5 times that of Base Case.
In 2030, the electricity demand in Tier 3
is 1.3 times and in Tier 5 it is 5.7 times
that of Base Case.
DemandAssessment
Under the base case (without EA
program), the electricity demand would
grow by 4.7% during 2014-2030.
23. SustainabilityRankingof ElectricityGeneration
Technologies
23
• In terms of economic, technical, environmental and social dimensions, large
hydro power generation technology has been found to be more sustainable.
• Even though power generation based on micro-hydro has been found to be
equally environmental friendly in comparison to the large hydro, however the
technology seems to be less sustainable economically, technically and socially.
SustainabilityAssessment
25. InstalledCapacityof SupplySideTechnologiesin2017and
2030,MW
CostAssessment
In 2017, the installed power
generation capacity would
increase by 3% in Tier 1, 10% in
Tier 2 and 54% in Tier 3 as
compared to the Base Case.
Grid share : 94% in Tier 3
In 2030, the installed capacity
would increase by 27% in Tier 3,
269% in Tier 4 and 466% in Tier 5
as compared to that in the Base
Case.
Grid Share : 97% in Tier 3, 100% in
Tiers 4 and 5.
26. Investment inSupply-sideTechnologiesin2017and2030,
billionNRs*
In 2017, total investment would
increase by 16% in Tier 1, 20% in
Tier 2 and 54% in Tier 3 as
compared to that in the Base
Case.
In 2030, total investment would
increase by 46% in Tier 3, 218% in
Tier 4 and 350% in Tier 5 as
compared to the Base Case.
CostAssessment
*It does not include the generation
investment cost in the grid system.
27. TotalCostofElectricityAccessDependsonTypesof
LampsandOther DemandSideTechnologiesUsed
• Total cost is found to be minimum with LED lamps used for lighting.
• Providing Tier 3 level of electricity access based on CFL and incandescent
(INCAN) lamps would increase the total cost by 6.7% and 28.5% respectively
as compared to the total cost with lighting based on LED lamps.
Cases % increase in total cost
as compared to LED
based Lighting
CFL INCAN
Tier 1 1.0% 4.4%
Tier 2 4.9% 23.5%
Tier 3 6.7% 28.5%
28. WhatwouldbetheIncrementalEnergyAccessCosts?
(ConsideringDemandIncrementRelativetotheBaseCase)
Incremental access cost increases with
higher level of demand
• The width of each block in the horizontal axis shows the incremental level of electricity supply under an
electricity access tier.
• The values in the vertical axis represents the corresponding IEAC per unit (kWh) of electricity supply.
• It shows the incremental electricity access cost decreasing with the higher levels (Tiers) of access.
33. AffordabilityAssessment:
DistributionofHouseholds withLevelofEnergy
BurdeninPyuthan in2014 (%)
33
% of households with energy burden
≤ 5% 5 to 10% 10% to 15% 15 to 20% ≥ 20%
Cooking 75.7 15.8 5.7 1.9 0.9
Lighting 92.3 6.1 1.2 0.2 0.2
Space
heating
98.2 1.5 0.2 0.0 0.0
Overall* 43.6 29.2 12.2 7.1 7.9
*includes all the energy expenditure burden
• 27 % of HHs have total energy burden above 10%
• 15% of HHs have total energy burden above 15%
AffordabilityAssessment
34. AffordabilityAssessment:
Howmuch annualsubsidywouldberequiredper
household in2017ifenergyburdenisnottoexceed10%?
34
Under Tier 1 level of electricity and cooking energy access, 19 % of households would
have energy burden above 10%. Under Tier 3, this figure would increase to 46%.
If 10% is the cutoff value for energy burden, total annual subsidy needed per household is
NRs 2. 36 thousand in Tier 1, NRS 2.4 thousand I Tier 2 and NRs 6.22 thousand in Tier 3.
AffordabilityAssessment
35. Benefits of Electricity Access
Productive Uses:
• 90 % of the households with family business had electricity access. 10% of
HHs with family business had no electricity access.
Time saving:
• Up to 48 hours of time saving per month per household for purchasing
kerosene in lighting.
Education:
• The sample survey shows that average study hour of students with
electricity access is 66% higher than that of students without electricity
access.
Energy Security:
• Amount of kerosene replaced in 2017, 2022 and 2030 would be 113, 130 and
171 toe respectively. 35
BenefitAssessment
36. HealthBenefits,LocalPollutant&CO2 Emissions
Reductionsdueto Electrification
Emission Reduction Benefit:
• Replacement of kerosene, candle and pine resin based lighting could abate
• 7,747 kg of CO
• 669 kg of NOX
• 4,844 kg of PM10
• 41,275 kg of BC
• 1,433 tonne of CO2
BenefitAssessment
VDC Status Number of hospital
visits per year per HH
Number of
annual absent
days per
household
Damri Unelectrified 3.3 32.1 days
Dakhakwadi Electrified 2.5 10.7 days
Health Benefit:
Lower number of hospital visits and annual absent days in electrified VDCs.
37. Key Messages (1)
• Major issues of energy access planning are: social
inclusiveness, affordability of the poor to cleaner energy
services and sustainability of energy access programs.
• It is not enough to make clean energy available, it should
also be affordable to use.
• SEAP framework considers these issues explicitly.
• Energy access being a societal problem, the solutions
must be socially cost effective.
• Both supply and demand side options should be
considered to determine the socially cost effective
energy access solutions.
• Supply side planning with a predetermined set of
demand side technology options could result in more
expensive energy access programs.
38. Key Messages (2)
• Even the socially cost effective and sustainable cleaner
energy options may not be affordable to the energy poor
households.
• However, with the socially cost effective supply and
demand side options, the level of financial support
needed by the energy poor would be lower.
• SEAP also presupposes that the basic minimum level of
energy services as well as the maximum acceptable
energy burden are known. There are no universally
applicable values of basic minimum level of energy
services and maximum acceptable energy burden. These
are country specific policy parameters, which national
policy makers have to define.
39. Acknowledgement
The development of the SEAP framework has
greatly benefited from valuable
inputs/suggestions from
• Peer reviewers (within ADB and outside)
• Policy makers
• Research assistants
40. • R. M. Shrestha and J. Acharya. (2015). Sustainable Energy Access Planning: A Framework. (To
be released). Asian Development Bank (ADB), Manila.
• Practical Action, 2013, Poor People’s Energy Outlook 2013: Energy for Community Services,
Practical Action Publishing, Rugby, UK.
• World Bank/ESMAP and IEA, 2012, Sustainable Energy for All (SE4ALL) Global Tracking
Framework, v.3, no. 77889.
40
References
43. DemandAssessment of the EnergyPoorHHs
43
Define the acceptable minimum level of basic
energy services
Identify the number of households whose
energy consumption is below the acceptable
minimum level based on sample survey
Estimate the amount of energy required to
provide households with the acceptable
minimum level of basic energy services
Define the acceptable minimum level of
basic energy requirement
Identify the number of households
whose average energy consumption
is above acceptable minimum level
Calculate the total energy
consumption of energy non-poor
households based on sample survey
Estimate the future
energy demand
Energy Demand Assessment of
Energy Poor HHs
Energy Demand Assessment of
Energy Non-poor HHs
DemandAssessment
44. Target Level of Electricity Access?
Tier 1 Tier 2 Tier 3 Tier 4 Tier 5
Appliances
radio radio radio radio radio
task lighting task lighting task lighting task lighting task lighting
phone charger phone charger phone charger phone charger phone charger
general lighting general lighting general lighting general lighting
air circulator(fan) air circulator(fan) air circulator(fan) air circulator(fan)
television television television television
food processors food processors food processors
rice cooker rice cooker rice cooker
washing machine washing machine
refrigerator refrigerator
iron iron
air conditioner
Total kWh per
year per HH 3 66 285 1464 2267
Source: Based on “Global Tracking Framework” of World Bank/ESMAP and IEA (2012)
Description of Multi-Tier Framework for Household Electricity Access
Multi-TierFramework