Rock Expriment: Stress Versus Seismicity
•
1 like•168 views

Rock Experiment provides a nice oppurtunity to understand the effects of fault geometry to enhance seismic hazard.

Recommended
More Related Content
What's hot
What's hot (20)
Similar to Rock Expriment: Stress Versus Seismicity
Similar to Rock Expriment: Stress Versus Seismicity (20)
More from Ali Osman Öncel
More from Ali Osman Öncel (20)
Recently uploaded
Recently uploaded (20)
Rock Expriment: Stress Versus Seismicity
- 1. GEOLOGY | Volume 45 | Number 9 | www.gsapubs.org 815 What allows seismic events to grow big?: Insights from b-value and fault roughness analysis in laboratory stick-slip experiments Thomas H.W. Goebel1 *, Grzegorz Kwiatek2 , Thorsten W. Becker3 , Emily E. Brodsky1 and Georg Dresen2 1 Department of Earth and Planetary Sciences, University of California, 1156 High Street, Santa Cruz, California 95064, USA 2 Geomechanics and Rheology, German Research Centre for Geosciences (GFZ), 14473 Potsdam, Germany 3 Institute for Geophysics, University of Texas at Austin, 10100 Burnet Road, Austin, Texas 78758, USA ABSTRACT Estimating the expected size of the largest earthquake on a given fault is complicated by dynamic rupture interactions in addition to geometric and stress heterogeneity. However, a statistical assessment of the potential of seismic events to grow to larger sizes may be pos- sible based on variations in magnitude distributions. Such variations can be described by the b-value, which quantifies the proportion of small- to large-magnitude events. The values of b vary significantly if stress changes are large, but additional factors such as geometric heterogeneity may affect the growth potential of seismic ruptures. Here, we examine the influence of fault roughness on b-values, focal mechanisms, and spatial localization of laboratory acoustic emission (AE) events during stick-slip experiments. We create three types of roughness on Westerly granite surfaces and studyAE event statistics during triaxial loading of the lab faults. Because both roughness and stress variations are expected to influence b, we isolate roughness contributions by analyzing AEs at elevated stresses close to stick- slip failure. Our results suggest three characteristics of seismicity on increasingly rough faults: (1) seismicity becomes spatially more dis- tributed, (2) b-values increase, and (3) focal mechanisms become more heterogeneous, likely caused by underlying stress field heterogeneity within the fault zones. Localized deformation on smooth faults, on the other hand, promotes larger rupture sizes within the associated homogeneous stress field, which is aligned with the macroscopic stress orientation. The statistics of earthquake magnitude distributions may help quantify these fault states and expected rupture sizes in nature. INTRODUCTION The expected magnitude of earthquake ruptures may be influenced by many factors, including dynamic interactions, geometric and structural heterogeneity (e.g., fault roughness, discontinuities, and bends), as well as stress distributions (Burridge and Knopoff, 1967; Segall and Pollard, 1980; King, 1983; Wiemer and Wyss, 1997; Schorlemmer et al., 2005). These effects are difficult to assess at seismogenic depths, but can par- tially be explored in laboratory experiments that capture earthquake-like strain accumulation and abrupt release (Brace and Byerlee, 1966). While these experiments do not encompass the entire complexity of tectonic processes, they show many similarities to natural faulting processes in terms of fault structure, microseismicity characteristics, and source scal- ing relations (e.g., Goebel et al., 2014; McLaskey et al., 2014;Yoshimitsu et al., 2014). Microevents in the laboratory, which are also referred to as acoustic emission (AE) events, are commonly connected to microfrac- ture and slip processes, involving both deviatoric and isotropic source components (e.g., Manthei, 2005; Kwiatek et al., 2014). The number of seismic events in the lab and in nature decays exponen- tially with larger magnitudes with an exponent (b-value) that describes the relative proportion of small- to large-magnitude events (Gutenberg and Richter, 1944): log ( )10 N a bM= − , (1) where N is number of events, a is productivity, and M is event magnitude. Previous studies of intact rock fracture suggested that increasing stresses lead to decreasing b-values before failure (e.g., Scholz, 1968). These laboratory observations of b-value–stress dependence have been used to explain variations in magnitude distributions in the tectonic system (e.g., Schorlemmer et al., 2005). Here, we extend the laboratory-based investigation of magnitude dis- tributions and b-value variations by studying the influence of fault rough- ness. We perform stick-slip experiments under tri-axial loading conditions and hydrostatic confining pressures on pre-fractured and pre-cut Westerly granite (Rhode Island, USA) surfaces and statistically analyzeAE catalogs, composed of event locations, focal mechanisms, and relative magnitudes (for details on experimental methods, see the GSA Data Repository1 ). Our results reveal a strong influence of fault roughness on both b-values and fractal dimensions of AE spatial distributions as well as AE source- mechanism heterogeneity. METHODS Magnitude Distributions, b-Value, and Fractal Dimension We determine relative AE event sizes by averaging peak amplitudes across the laboratory seismic array after correcting for source-receiver distances. We then assign relative magnitudes on an experiment-specific scale, using M = log10 (A), where A is average peak event amplitude. The magnitude distributions in our experiments commonly follow the Gutenberg-Richter relationship (Equation 1) for which b-values were determined by a maximum-likelihood estimate (see the Data Repository). The spatial distribution of AEs varies substantially as a function of fault roughness (Fig. 1). To quantify this variability, we compute the pair correlation function C(r) = N(s<r)/N2 tot , which describes the change in event number N with separation distance, s, as a function of scale, r, where Ntot is the total number of observed events. The slope of the log- transformed pair correlation function, i.e., dlog10 (C)/dlog10 (r), defines the correlation dimension, D2 (see the Data Repository). The dimension D2 decreases with increasing localization so that a planar point cloud has D2 = 2 and values <2 indicate localization on fault patches. In the following, we only useAE events during periods of elevated stresses and prior to the first stick-slip events, which are most representative of the initial surface roughness (see Fig. DR2 in the Data Repository). 1 GSA Data Repository item 2017275, experimental methods and sensitivity analyses, is available online at http://www.geosociety.org/datarepository/2017/ or on request from editing@geosociety.org.*E-mail: tgoebel@ucsc.edu GEOLOGY, September 2017; v. 45; no. 9; p. 815–818 | Data Repository item 2017275 | doi:10.1130/G39147.1 | Published online 10 July 2017 © 2017 Geological Society of America. For permission to copy, contact editing@geosociety.org.
- 2. 816 www.gsapubs.org | Volume 45 | Number 9 | GEOLOGY AE Source Mechanisms and Stress Heterogeneity In our experiments, far-field stresses are prescribed by the vertical load- ing axis (σ1 ) and horizontal confining pressure (σ2 = σ3 ) at fixed orienta- tions.At the fault scale, however, stress orientations and magnitudes vary because of roughness and microfractures. Here, we use focal mechanism heterogeneity, namely variations in P-axis orientations and rotation angle between moment tensor pairs (see the Data Repository), as proxy for microscale stress field heterogeneity. Focal mechanisms are determined from double-couple components of the decomposed moment tensors com- puted from first-motion P-wave amplitudes and a homogeneous velocity model. The moment tensor inversion includes a time-dependent correc- tion term for sensor-rock coupling, which depends on confining pressure and is thus well suited for laboratory conditions (Kwiatek et al., 2014). RESULTS We report results from eight experiments on polished, roughened, and fractured surfaces. Slip on the laboratory faults produces between one and seven stick-slip events for each experiment; however, we limit the analysis to AEs associated with the first slip event in each experiment, which is most representative of initial fault roughness. AE locations in fractured samples delineate the orientation and extent of the faults at ~25° to 35° to the largest principle stress, σ1 (Fig. 1). For polished and roughened surfaces, we cut the samples at a 30° angle to the loading axis to match the fault orientation in fractured samples. Slip on planar, cut surfaces results in localizedAE activity, whereasAEs on fractured surfaces are dispersed within the irregular fault damage zone with an absolute width of ~1 cm. The variability of focal mechanism P-axis orientations increases sys- tematically between polished, roughened, and fractured surfaces, sug- gesting that fractured surfaces and associated damage zones produce the highest degree of stress heterogeneity (Fig. 1, bottom). This increase in stress heterogeneity is also resolved through statistical analyses of mini- mum rotation angles between moment tensor pairs. The median rotation angles increase systematically from polished to roughened to fractured surfaces and decrease for larger-magnitude events (Fig. DR7). The P-axis orientations for polished and roughened surfaces in Figure 1 form a compact region with an orientation similar to that of the applied stress field. This is expected if most of the AEs occur on the pre-cut sur- faces and not within the damage zone. Most P-axes have a plunge angle between 15° to 20° from the loading axis (σ1 ). This difference in plunge relative to σ1 arises because P-axes are generally located at the center of the tensional quadrant of the focal mechanisms at 45°, whereas σ1 is at an angle θ = 25°–30° from the slip surface. Variations in Spatial and Magnitude Distributions with Increasing Roughness Both b-value and correlation dimension increase systematically for rougher faults (Fig. 2), such that b-values are smallest for polished surfaces (b ≈ 0.6–0.7) and largest for fractured surfaces (b ≈ 1.2–1.3). Roughened, planar surfaces produce b-values in the range of 0.8–1.0. The underlying magnitude distributions can be described by a Gutenberg-Richter–type rela- tionship above the magnitude of completeness, however this relationship breaks down after several successive stick-slip events on polished surfaces and transitions to a more characteristic magnitude distribution, recogniz- able as a pronounced second peak above M4.6 (Fig. DR8). Such a transition may be a result of a dominant length scale that controls AE event sizes. Here, we concentrate on periods with Gutenberg-Richter–like behavior. The correlation dimension, D2 , increases systematically from polished (D2 ≈ 1.6) to roughened (D2 ≈ 2.0) and fractured surfaces (D2 ≈ 2.5; Fig. 2), reflecting the more broadly distributed AE event clouds for roughened and fractured surfaces in Figure 1. The smaller value of D2 ≈ 1.6 for the polished surface suggests a high degree of spatial localization ofAE events. Fractured Roughened Polished 2 3 4 5 Figure 1. Acoustic emission (AE) hypocenters and magnitudes (see legend) for polished (left), roughened (center), and fractured surface (right), viewed at an oblique angle (upper cylinders) and parallel to the fault (lower cylinders). P-axis variability is depicted as density maps in lower-hemisphere stereonet projection at bottom of each column, with lighter blue colors corresponding to higher densities, and white curve depicting fault dip angle. Average P-axis plunges are: 72° ± 13° for polished, 58° ± 18° for roughened, and 41° ± 25° for fractured surface. Figure 2.A,C: Magnitude distributions (A) and pair-correlation functions (C) for polished (blue), roughened (purple), and fractured (green) sur- faces. Corresponding b (proportion of small- to large-magnitude events) and D2 (correlation dimension) are shown in upper right and left corners, respectively. B: Solid lines show variations in b-value as function of magnitude of completeness. Shaded regions show uncertainty in b, dashed lines show misfit (Kolmogorov-Smirnov distance, KS-D), and arrows highlight b and Mc (magnitude of completeness) at minimum misfit. D: Changes in D2 (solid lines) and goodness of fit (dashed lines) as function of maximum radius. Arrows indicate best-fitting values.
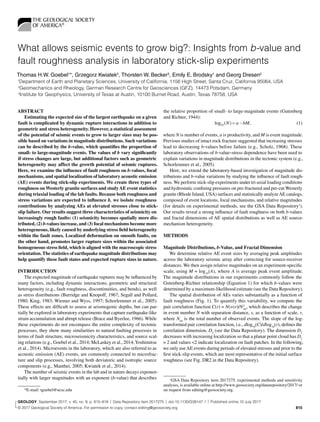
- 3. GEOLOGY | Volume 45 | Number 9 | www.gsapubs.org 817 Observed and Theoretically Expected Correlations Between D2 and b-Value The fractal dimension of AE hypocenter distributions exhibits a posi- tive linear relationship with the b-value, so that the ratio between D2 and the b-value is ≈2.1 (Fig. 3), which is significant at the 99% level. Moreover, both b and D2 increase systematically as a function of fault roughness so that rougher faults favor spatially more-distributed seismicity and higher b-values, corresponding to relatively more small-magnitude events. Previous laboratory studies primarily focused on changes in b-value and fractal dimension during the fracture of intact rock samples, sug- gesting a general scaling of the form D2 ≈ b (e.g., Meredith et al., 1990), whereas we find D2 ≈ 2b. Thus, both fracture and frictional failure of preexisting faults reveal increasing spatial localization with decreasing b-values, however the governing processes may be significantly different, resulting in a different ratio between b and D2 . In nature, fault size distributions can be described by a power law of the form log10 (N) ∝ D log10 (L), where N is number and L length of faults (e.g., King, 1983). The exponent, D, describes the relative proportion of small to large faults, and is expected to be closely connected to D2 (e.g., Wyss et al. 2004). The scaling of fault size distributions can be linked to the Gutenberg-Richter relationship by rewriting Equation 1 as a function of seismic moment and employing the definition of moment, i.e., M0 = μAS, where μ is the shear modulus, A is fault area, and S is slip. Seismic moment is related to magnitude by M0 ∝ 10cM where c = 3/2 (Kanamori and Anderson, 1975). For isotropic ruptures and constant stress drop (S/A = constant), seis- mic moment is related to linear rupture dimension via M0 ∝ L3 , and the Gutenberg-Richter relationship can be written as (Aki, 1967): log ( ) log ( )10 10 3 N b c L∝ . (2) Thus, if seismic moment is proportional to the fault dimension cubed, D and b are connected through (Aki, 1967; King, 1983; Wyss et al., 2004): D cb b= =3 2 . (3) Interestingly, the best linear fit between b and D2 over the explored range of roughness produces a slope close to 2, revealing a strong corre- lation between the scaling of fault size distribution and event separation distances (Fig. 3). For a fault in two dimensions, the scaling of separation distances between rupture patches is expected to correspond to the scaling of linear rupture dimensions, because seismogenic patches are approximately one rupture dimension apart. In 3-D, such a scaling may also be expected based on elastic stress transfer processes with spatial decay on the order of rupture size (Stein, 1999). Nevertheless, for Equation 3 to be strictly applicable in the laboratory, several assumptions have to be fulfilled: First, AE stress drops should be constant at the lab scale, which is supported by previous studies (e.g., Yoshimitsu et al., 2014). Second, the relative magnitude estimates in our experiments should be proportional to the logarithm of seismic moment during fracture and slip. The observed correlation between b and D2 sug- gests that these two assumptions may approximately hold true. Hence, spatially more-localized fracture networks andAE locations (i.e., smaller D2 ) associated with smooth faults promote rupture growth and coalescence leading to low b-values. Nevertheless, a direct upscaling of laboratory results is complicated by additional complexity in the natural system, such as geometric complexity and fault step-overs which may obscure the relationship between D2 and b-value (e.g., Main, 1992). APPLICABILITY OF LABORATORY RESULTS TO NATURAL SYSTEMS Many previous observations of b-value variations in natural systems were interpreted in light of experimental results of a b-value–stress depen- dency (e.g., Wiemer and Wyss, 1997; Schorlemmer et al., 2005). Such a dependency is observed when, for example, stress changes are high during sequences of stick-slips resulting in b-values between 1.7 and 1.0 (Goebel et al., 2013). At a fundamental level, b-values are controlled by the geometry of the fault network (King, 1983) and the dynamics of inter- acting ruptures, so that the Gutenberg-Richter relationship is applicable to a single fault plane and to the fault network (Burridge and Knopoff, 1967). Both explanations are linked in the sense that the geometry of fault networks is shaped by dynamic rupture events and, conversely, dynamic interactions are controlled by the distribution of stresses which may eas- ily be perturbed by fractures and roughness (e.g., Scholz, 1968; Zang et al., 1998). The distinction between dynamic and geometric influences is conceptually useful because fault size distributions and geometric com- plexity are more readily observable in nature such as in Parkfield, Cali- fornia, USA (Wyss et al., 2004). Previous studies on geometric complexity and roughness showed that slip on younger, rougher faults produces a higher degree of source-mech- anism heterogeneity and a slower spatial decay of seismicity within the damage zone (Bailey et al., 2010; Powers and Jordan, 2010; Goebel et al., 2014). If fault roughness decreases with age and cumulative slip, our laboratory observations suggest that more mature, smoother faults are associated with localized seismicity, smoother stress fields, and lower b-values (Fig. 4). This connection between localization and decreasing b-values implies that larger events occur preferably close to the principal slip surfaces, which may explain a potential increase in b with distance from faults (Page et al., 2011). Further evidence for the geometric control on b-value can be resolved in cases where seismogenic deformation transitions from distributed frac- ture networks to a localized fault, or vice versa. Such a transition is observed in high-resolution seismicity catalogs during pressure-induced Polished Roughened Fractured H ~0.5 Figure 3. Correlation dimension, D2 and b-value (proportion of small- to large-magnitude events) are linearly correlated with a slope of ≈2.1 (black dashed line). Gray dashed line highlights theoretically expected relationship between D2 and b (see text for details). Correlation is significant at 99% level with Pearson’s r coefficient of 0.97. Statisti- cal uncertainty in b and D2 are indicated by horizontal and vertical error bars, respectively. Markers are colored according to root mean square (RMS) roughness. Inset shows power-spectral density (PSD) of roughness for three typical surfaces, highlighting significant dif- ference between fractured (green), roughened (purple), and polished (blue) surfaces. Hll is the Hurst exponent in the slip-parallel direction.
- 4. 818 www.gsapubs.org | Volume 45 | Number 9 | GEOLOGY sequences, for example in volcanic environments where periods with localized seismicity on well-defined fault planes have lower b-values than periods with disbursed seismicity (e.g., Shelly et al., 2016). In both lab and nature, b-values are also suggested to be anomalously low close to fault patches with relatively higher resistance to slip, and the relationship between b and D2 can be described by Equation 3 (Wiemer and Wyss, 1997; e.g., Wyss et al., 2004). Microanalyses of such patches with anomalously low b-values in stick-slip experiments revealed smaller damage and gouge zone widths so that the host rock is potentially in direct contact (Goebel et al., 2012). The AEs within low-b-value regions occur more localized than in the surrounding areas, highlighting the coupling between lower b-values and strain localization. Within such regions, the preferred occurrence of large seismic events may be physically driven by coalescing cracks within a smooth stress field and a lack of hetero- geneity that may cause earlier rupture arrest (Segall and Pollard, 1980; Sammonds and Ohnaka, 1998). CONCLUSIONS Acoustic emission statistics during stick-slip on laboratory faults are strongly affected by fault roughness. Our results suggest that rougher faults lead to more spatially distributed AE activity, higher b-values, and more heterogeneous focal mechanisms. The latter is likely caused by increased heterogeneity in the underlying stress field at small scales. Smoother faults, on the other hand, are associated with localized strain and AE activity as well as a more homogeneous fault-scale stress field, which is aligned with the applied, macroscopic stresses. These condi- tions allow seismic ruptures to grow and coalesce, leading to relatively more large-magnitude events and low b-values in laboratory and nature. ACKNOWLEDGMENTS We thank Ian Main and two anonymous reviewers for comments, and Stefan Geh- rmann for sample preparation at GFZ-Potsdam. Goebel was supported by the German Alexander von Humboldt Foundation. This work was support by U.S. National Science Foundation grant EAR-1624657. REFERENCES CITED Aki, K., 1967, Scaling law of seismic spectrum: Journal of Geophysical Research, v. 72, p. 1217–1231, doi:10.1029/JZ072i004p01217. Bailey, I., Ben-Zion, Y., Becker, T.W., and Holschneider, M., 2010, Quantifying focal mechanism heterogeneity for fault zones in central and southern Cali- fornia: Geophysical Journal International, v. 183, p. 433–450, doi:10.1111/j .1365-246X.2010.04745.x. Brace, W.F., and Byerlee, J.D., 1966, Stick-slip as a mechanism for earthquakes: Science, v. 153, p. 990–992, doi:10.1126/science.153.3739.990. Burridge, R., and Knopoff, L., 1967, Model and theoretical seismicity: Bulletin of the Seismological Society of America, v. 57, p. 341–371. Goebel, T.H.W., Becker, T.W., Schorlemmer, D., Stanchits, S., Sammis, C., Rybacki, E., and Dresen, G., 2012, Identifying fault heterogeneity through mapping spatial anomalies in acoustic emission statistics: Journal of Geophysical Re- search, v. 117, B03310, doi:10.1029/2011JB008763. Goebel, T.H.W., Schorlemmer, D., Becker, T.W., Dresen, G., and Sammis, C.G., 2013,Acoustic emissions document stress changes over many seismic cycles in stick-slip experiments: Geophysical Research Letters, v. 40, p. 2049–2054, doi:10.1002/grl.50507. Goebel, T.H.W., Candela, T., Sammis, C.G., Becker, T.W., Dresen, G., and Schor- lemmer, D., 2014, Seismic event distributions and off-fault damage during frictional sliding of saw-cut surfaces with pre-defined roughness: Geophysical Journal International, v. 196, p. 612–625, doi:10.1093/gji/ggt401. Gutenberg, B., and Richter, C.F., 1944, Frequency of earthquakes in California: Bulletin of the Seismological Society of America, v. 34, p. 185–188. Kanamori, H., and Anderson, D.L., 1975, Theoretical basis of some empirical relations in seismology: Bulletin of the Seismological Society of America, v. 65, p. 1073–1095. King, G.C.P., 1983, The accommodation of large strains in the upper lithosphere of the Earth and other solids by self-similar fault systems: The geometrical origin of b-value: Pure and Applied Geophysics, v. 121, p. 761–815, doi:10 .1007/BF02590182. Kwiatek, G., Goebel, T.H.W., and Dresen, G., 2014, Seismic moment tensor and b value variations over successive seismic cycles in laboratory stick-slip ex- periments: Geophysical Research Letters, v. 41, p. 5838–5846, doi:10.1002 /2014GL060159. Main, I.G., 1992, Damage mechanics with long-range interactions: Correlation between the seismic b-value and the fractal two-point correlation dimension: Geophysical Journal International, v. 111, p. 531–541, doi:10.1111/j.1365- 246X.1992.tb02110.x. Manthei, G., 2005, Characterization of acoustic emission sources in a rock salt specimen under triaxial compression: Bulletin of the Seismological Society of America, v. 95, p. 1674–1700, doi:10.1785/0120040076. McLaskey, G.C., Kilgore, B.D., Lockner, D.A., and Beeler, N.M., 2014, Laboratory generated M-6 earthquakes: Pure and Applied Geophysics, v. 171, p. 2601– 2615, doi:10.1007/s00024-013-0772-9. Meredith, P.G., Main, I.G., and Jones, C., 1990, Temporal variations in seismicity during quasi-static and dynamic rock failure: Tectonophysics, v. 175, p. 249– 268, doi:10.1016/0040-1951(90)90141-T. Page, M.T., Alderson, D., and Doyle, J., 2011, The magnitude distribution of earthquakes near Southern California faults: Journal of Geophysical Research, v. 116, B12309, doi:10.1029/2010JB007933. Powers, P.M., and Jordan, T.H., 2010, Distribution of seismicity across strike-slip faults in California: Journal of Geophysical Research, v. 115, B05305, doi: 10.1029/2008JB006234. Sammonds, P., and Ohnaka, M., 1998, Evolution of microseismicity during fric- tional sliding: Geophysical Research Letters, v. 25, p. 699–702, doi:10.1029 /98GL00226. Scholz, C.H., 1968, The frequency-magnitude relation of microfracturing in rock and its relation to earthquakes: Bulletin of the Seismological Society ofAmer- ica, v. 58, p. 399–415. Schorlemmer, D., Wiemer, S., and Wyss, M., 2005, Variations in earthquake-size distribution across different stress regimes: Nature, v. 437, p. 539–542, doi: 10.1038/nature04094. Segall, P., and Pollard, D.D., 1980, Mechanics of discontinuous faults: Journal of Geophysical Research, v. 85, p. 4337–4350, doi:10.1029/JB085iB08p04337. Shelly, D.R., Ellsworth, W.L., and Hill, D.P., 2016, Fluid-faulting evolution in high definition: Connecting fault structure and frequency-magnitude varia- tions during the 2014 Long Valley Caldera, California, earthquake swarm: Journal of Geophysical Research: Solid Earth, v. 121, p. 1776–1795, doi:10 .1002/2015JB012719. Stein, R.S., 1999, The role of stress transfer in earthquake occurrence: Nature, v. 402, p. 605–609, doi:10.1038/45144. Wiemer, S., and Wyss, M., 1997, Mapping the frequency-magnitude distribution in asperities: An improved technique to calculate recurrence times?: Journal of Geophysical Research, v. 102, p. 15,115–15,128, doi:10.1029/97JB00726. Wyss, M., Sammis, C.G., Nadeau, R.M., and Wiemer, S., 2004, Fractal dimension and b-value on creeping and locked patches of the San Andreas fault near Parkfield, California: Bulletin of the Seismological Society ofAmerica, v. 94, p. 410–421, doi:10.1785/0120030054. Yoshimitsu, N., Kawakata, H., and Takahashi, N., 2014, Magnitude –7 level earth- quakes: A new lower limit of self-similarity in seismic scaling relationships: Geophysical Research Letters, v. 41, p. 4495–4502, doi:10.1002/2014GL060306. Zang, A., Wagner, F.C., Stanchits, S., Dresen, G., Andresen, R., and Haidekker, M.A., 1998, Source analysis of acoustic emissions inAue granite cores under symmetric and asymmetric compressive loads: Geophysical Journal Interna- tional, v. 135, p. 1113–1130, doi:10.1046/j.1365-246X.1998.00706.x. Manuscript received 13 March 2017 Revised manuscript received 16 May 2017 Manuscript accepted 16 May 2017 Printed in USA Figure 4. Schematic rep- resentation of influence of surface roughness on spatial and magnitude distributions as well as small-scale stress field heterogeneity (white arrows). Sketch exempli- fies distribution of small (green) and large (orange and red) cracks around laboratory fault zones that started from fractured (left), and planar surfaces (right). Large black arrows show macro- scopic stress field.