Downloaded 100 times

![From Mouse to Man (MS >RR)
0 2 4 6 8 10 12 14 16
0
20
40
60
80
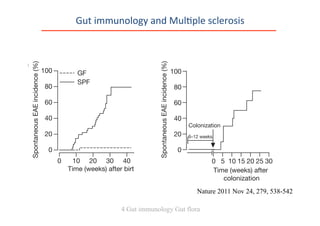
100 MS Patient feces (n = 5)
Healthy Control feces (n = 5)
Time (wk) after colonization
SpontaneousEAE[%]
State
of
the
art
Luzern
26.01.2013
Presenta0on
from
Prof
Wekerle
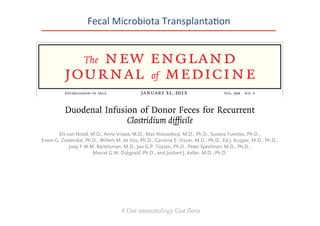
Fecal
Microbiota
Transplanta0on
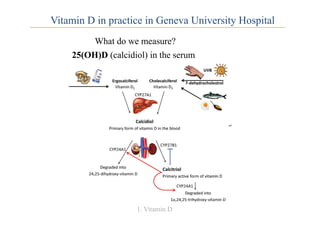
and
Mul0ple
sclerosis
4 Gut immunology Gut flora](https://image.slidesharecdn.com/6workshopcpotcarolinelalivepatriceriskfactorsinms-140319112857-phpapp02/85/Risk-factors-in-Multiple-Sclerosis-Detection-and-Treatment-in-Daily-Life-41-320.jpg)
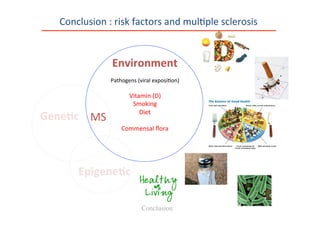


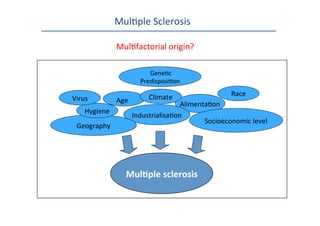
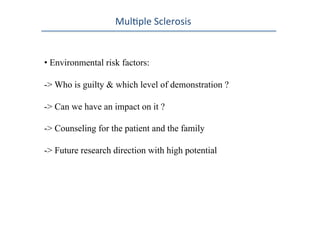
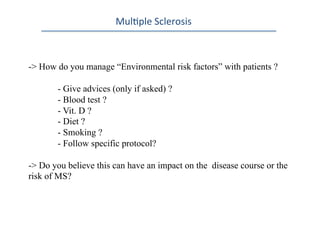
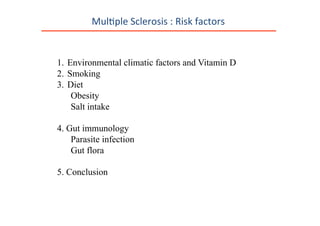
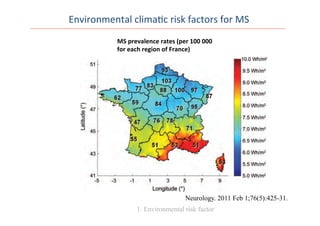
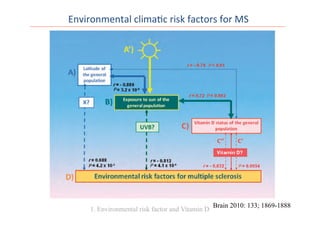
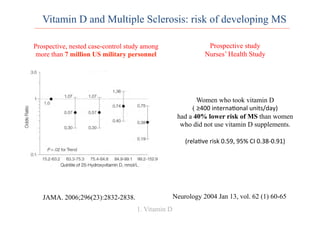
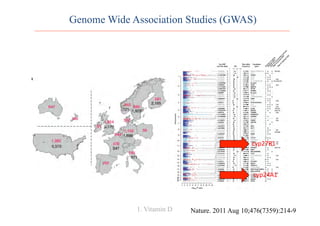
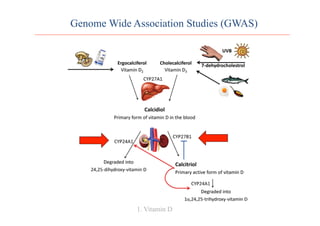
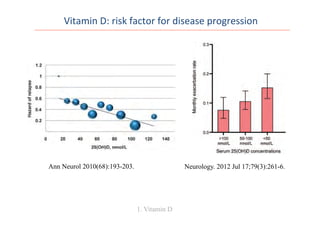
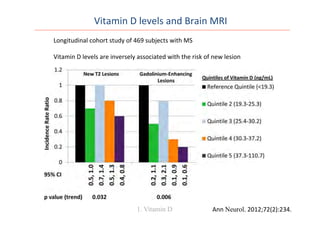
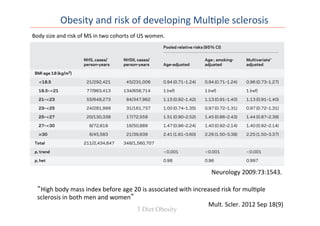
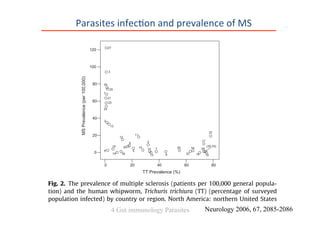
The document discusses risk factors for multiple sclerosis (MS), emphasizing environmental influences such as vitamin D levels, smoking, diet, and genetic predispositions. It explores various studies linking these factors to the prevalence and progression of MS. Strategies for patient management and counseling regarding these risk factors are also suggested.


![ONFH[AVN HIP] -TRIPLE REGIME -A NOVAL SURGICAL CONCEPT .pptx](https://cdn.slidesharecdn.com/ss_thumbnails/onfhavnhip2026koaconcalicutdrgokuldevdrmashraf-260210064517-213ec005-thumbnail.jpg?width=640&height=640&fit=bounds)


![PERI-PROSTHETIC FRACTURE NAIL-PLATE CONSTRUCT [NPC].pptx](https://cdn.slidesharecdn.com/ss_thumbnails/drarunkumardrmohamedashrafperiprostheticfrasturenail-plateconstructnpc-260209164459-7e9d15a1-thumbnail.jpg?width=640&height=640&fit=bounds)


