Download as PDF, PPTX


![Multiple hyperintense
lesions in the spinal cord
Rovaris et al., Brain 2001
Spinal cord / T2 lesions
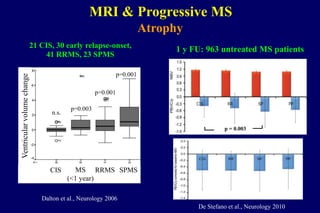
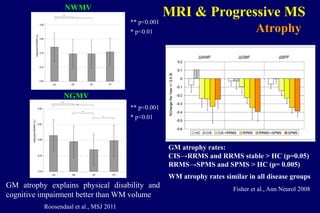
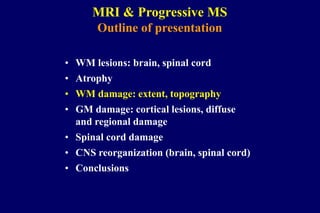
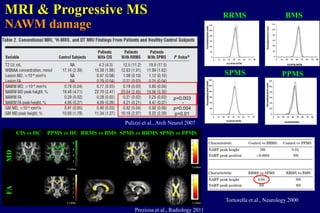
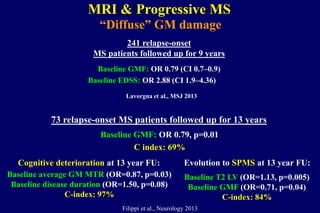
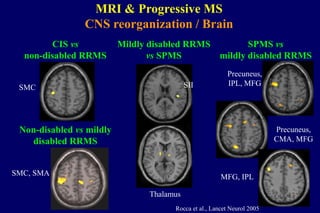
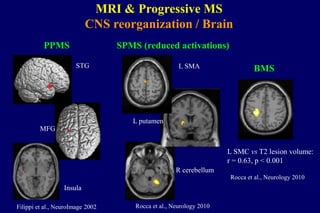
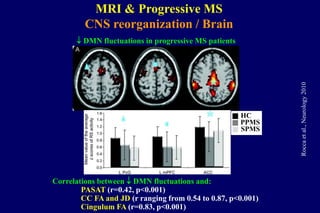
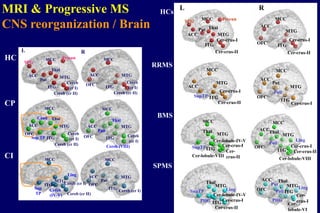
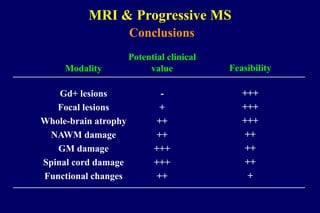
MRI & Progressive MS
Number of cord lesions Number of damaged
cord segments
0.0
1.0
2.0
3.0
4.0
5.0
0.0
1.0
2.0
3.0
4.0
5.0
6.0
p = 0.03
0.0
30.0
60.0
90.0
Cord area [mm2]
Rovarisetal.,Brain2001
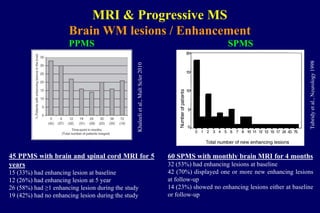
PPMSSPMSControls](https://image.slidesharecdn.com/mrimarkerstounderstandprogression-140320114636-phpapp01/85/MRI-markers-to-understand-progression-6-320.jpg)


![Average MD
[x10-3mm2s-1] (SD)
Mean FA
(SD)
Controls
1.203
(0.09)
0.42
(0.04)
PPMS
1.280
(0.10)
0.38
(0.05)
p
0.024
0.007
Agosta et al., Neurology 2005
MRI & Progressive MS
Spinal cord / Diffuse damage
Composite MR model vs EDSS:
Cord area + cord MTR peak height
(r=0.21, p=0.04)
Rovaris et al., Brain 2001
0
10
20
30
40
50
60
70
0 10 20 30 40 50 60 70 80
Controls
MTR [%]
Normalizedpixelcount
SPMS
PPMS](https://image.slidesharecdn.com/mrimarkerstounderstandprogression-140320114636-phpapp01/85/MRI-markers-to-understand-progression-21-320.jpg)

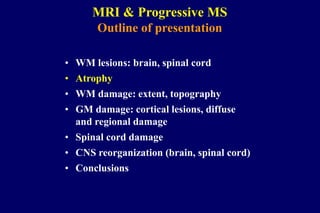
![Tactile stimulation of the palm of the R hand
Progressive MS vs controls: p=0.003
SPMS vs PPMS: p=0.05
Cordaveragesignalchange(%)
Controls
SPMS
PPMS
Valsasina et al., Hum Brain Mapp 2011
MRI & Progressive MS
CNS reorganization / Spinal cord
Valsasina et al., JNNP 2010
Controls RRMS SPMS
3.9 %
1.3 %3. 3 %
1.1 %
2.7 %
0.7 %
Task-relatedaveragesignalchange[%]
0.0
0.5
1.0
1.5
2.0
2.5
3.0
3.5
4.0
4.5
5.0
p=0.05
vs controls
p=0.02
vs controls
Cord fMRI vs fatigue
Rocca et al., Mult Scler 2012](https://image.slidesharecdn.com/mrimarkerstounderstandprogression-140320114636-phpapp01/85/MRI-markers-to-understand-progression-28-320.jpg)
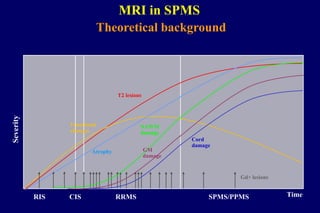

The document discusses neuroimaging research focusing on MRI markers to understand mechanisms of disease progression in multiple sclerosis (MS). It details findings related to white matter (WM) lesions, brain atrophy, gray matter (GM) damage, and spinal cord issues, along with their implications for clinical outcomes. Studies presented cover various forms of MS, including relapsing forms and primary progressive MS, highlighting correlations between imaging results and clinical disability over time.


