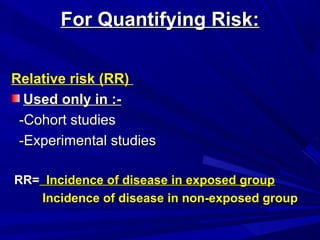
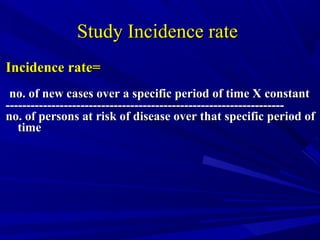
Risk AssessmentRisk Assessment
BYBY
Dr. Mona AbosereaDr. Mona Aboserea
Professor of Public Health &Professor of Public Health &
Preventive MedicinePreventive Medicine
2017-20182017-2018
Why Do We Study It?Why Do We Study It?
What we must learn?What we must learn?
The aim of risk assessment is to provideThe aim of risk assessment is to provide
preventive measures. So, we need:preventive measures. So, we need:
ToTo measure degree of associationmeasure degree of association
between certain risk factor and thebetween certain risk factor and the
occurrence of a disease.occurrence of a disease.
AndAnd
To quantify this risk.To quantify this risk.
Relative risk (RR)
Used only in :-Used only in :-
-Cohort studies-Cohort studies
-Experimental studies-Experimental studies
RR=RR= Incidence of disease in exposed groupIncidence of disease in exposed group
Incidence of disease in non-exposed groupIncidence of disease in non-exposed group
For Quantifying Risk:For Quantifying Risk:
Study Prevalence rateStudy Prevalence rate
Useful for assessing theUseful for assessing the burden of diseaseburden of disease
within a populationwithin a population
Valuable forValuable for planning & follow upplanning & follow up
Prevalence rate=Prevalence rate=
No of cases (old & new)No of cases (old & new)
-------------------------------------------- X Constant-------------------------------------------- X Constant
No examined in the same time & placeNo examined in the same time & place 100
1000
10000
100000
Incidence rate=Incidence rate=
no. of new cases over a specific period of time X constantno. of new cases over a specific period of time X constant
--------------------------------------------------------------------------------------------------------------------------------------
no. of persons at risk of disease over that specific period ofno. of persons at risk of disease over that specific period of
timetime
Study Incidence rateStudy Incidence rate
Prevalence and Incidence
= prevalent cases = incident cases = deaths or recoveries
Prevalence is a function of the incidence of diseasePrevalence is a function of the incidence of disease
and the duration of diseaseand the duration of disease
Prevalence=incidence X durationPrevalence=incidence X duration
Prevalence and Incidence
Interpreting Relative Risk:Interpreting Relative Risk:
1-if RR1-if RR=1=1 {Risk in exposed equal to{Risk in exposed equal to
risk in non-exposed (no association)}risk in non-exposed (no association)}
2-if RR>1 {Risk in exposed greater than
risk in non-exposed (+ve association;
possibly causal)}
3-if RR<1 {Risk in exposed less than risk
in non-exposed (-ve association; possibly
protective)}
Another measureAnother measure Used only in:Used only in:
-Cohort studies-Cohort studies
-Experimental studies-Experimental studies is theis the
Attributable Risk (AR) or riskAttributable Risk (AR) or risk
differencedifference, which gives an idea about the, which gives an idea about the
excess risk due to specific factor.due to specific factor.
AR=AR= incidence among exposed-incidence among exposed-
incidence among non-exposedincidence among non-exposed..
Attributable risk in the exposedAttributable risk in the exposed
(AR(ARexpexp))
Unexposed Exposed
Incidence(per1,000)
ARexp
Attributable riskAttributable risk is usefulis useful
for Public Health guidelinesfor Public Health guidelines
and planningand planning
1212
Example:- a cohort of 200 workers wasExample:- a cohort of 200 workers was
followed for ten years to study thefollowed for ten years to study the
association between smoking andassociation between smoking and
cancer lungcancer lung ::
Cancer lung Yes No Total
Smokers 35 65 100
Non smokers 5 95 100
Total 40 160 200
The incidence of cancer amongThe incidence of cancer among
smokers=smokers= 35/10035/100
The incidence of cancer among non-The incidence of cancer among non-
smokers=smokers= 5/1005/100
RR= 0.35/0.05=7RR= 0.35/0.05=7 meaningmeaning thatthat
smokers are at risk of cancer lungsmokers are at risk of cancer lung
7 times more than non-smokers.7 times more than non-smokers.
ARAR== 0.35-0.05=0.30.35-0.05=0.3 meaning thatmeaning that
smoking increase risk of cancer lungsmoking increase risk of cancer lung
byby 0.30.3 ((30%30%).).
Odds ratio (OR)Odds ratio (OR)
used mainly in:-used mainly in:-
-Case-control studies-Case-control studies
-Comparative cross sectional studies-Comparative cross sectional studies
OR==Odds of exposure among exposedOdds of exposure among exposed
Odds of exposure among non-exposedOdds of exposure among non-exposed
Odds Ratio (OR) =Odds Ratio (OR) =
No. of diseased / No. of not diseased amongNo. of diseased / No. of not diseased among exposedexposed
No. of diseased / No. of not diseased amongNo. of diseased / No. of not diseased among non–exposednon–exposed
1616
Cases Control Total
Exposure a(diseased) b(not
diseased)
A+b
No
exposure
c(diseased) d(not
diseased)
C+d
a+c b+d A+b+
c+d
Design
OR= ad/bc
1717
Past
sugery
Cases
HCV+VE
Control
HCV -VE
Total
YES 30 20 50
No 70 180 250
100 200 300
EXAMPLE
CALCULATE: OR= ad/bc
1818
Answer
OR=30X180 / 20X70=3.6OR=30X180 / 20X70=3.6
1919
Interpret ????Interpret ????
Exercise1:Exercise1:
In a case control study to investigate the associationIn a case control study to investigate the association
between oral contraceptive use & hypertension, howbetween oral contraceptive use & hypertension, how
to quantify the risk from the table below:to quantify the risk from the table below:
Feedback1:Feedback1: Odds Ratio=Odds Ratio= 32x15 =32x15 = 1.331.33
8x458x45
hypertensivehypertensive normotensivenormotensive totaltotal
CP usersCP users 1515 4545 6060
Non usersNon users 88 3232 4040
totaltotal 2323 7777 100100
Exercise 2:Exercise 2:
In a case control study to investigate the associationIn a case control study to investigate the association
between oral contraceptive use & occurrence ofbetween oral contraceptive use & occurrence of
rheumatoid arthritis. From the table below. Whatrheumatoid arthritis. From the table below. What
measure will be used to quantify risk?measure will be used to quantify risk?
Feedback2:Feedback2: Odds ratioOdds ratio ad/bcad/bc because:-because:-
- Case-control studyCase-control study-- unpaired qualitative data.unpaired qualitative data.
- We have distribution of numbers.We have distribution of numbers.
- OROR=0.44 Interpret.=0.44 Interpret.
rheumatoidrheumatoid freefree totaltotal
usersusers 4040 120120 160160
Non usersNon users 6060 8080 140140
totaltotal 100100 200200 300300
Exercise 3:-Exercise 3:-
In a cohort study to test major ECG abnormalitiesIn a cohort study to test major ECG abnormalities
as a risk factor for death from coronary heartas a risk factor for death from coronary heart
disease (CHD), How to quantify risk & interpret itdisease (CHD), How to quantify risk & interpret it
from the table below:-from the table below:-
Feedback 3:Feedback 3: Relative risk because:-Relative risk because:-
- cohort study.cohort study.
- We can calculate incidenceWe can calculate incidence
- RRRR= 2.45 .= 2.45 . Interpret.Interpret. ARAR= .= . Interpret.Interpret.
Death fromDeath from
CHDCHD
No death fromNo death from
CHDCHD
totaltotal
ECG abnormalityECG abnormality 88 3939 4747
No ECG abnormalityNo ECG abnormality 1010 134134 144144
totaltotal 1818 173173 191191
Exercise 4:-Exercise 4:-
In a case-control study to test the exposure toIn a case-control study to test the exposure to
ionizing radiation as a risk factor for leukemia,ionizing radiation as a risk factor for leukemia,
can you quantify risk & interpret it from the tablecan you quantify risk & interpret it from the table
below:-below:-
Feedback 4:Feedback 4: Odds ratio ad/bc because:-Odds ratio ad/bc because:-
- Case-control studyCase-control study
- OR= 2 . Interpret.OR= 2 . Interpret.
leukemialeukemia No leukemiaNo leukemia totaltotal
Exposed to radiationExposed to radiation 7575 6060 135135
Non exposed toNon exposed to
radiationradiation
2525 4040 6565
totaltotal 100100 100100 200200
Exercise 5:Exercise 5:
A cohort study was doneA cohort study was done
to prove associationto prove association
between zinc deficiencybetween zinc deficiency
and stunted growth inand stunted growth in
infants.infants.
Calculate relative risk andCalculate relative risk and
attributable risks of zincattributable risks of zinc
deficiency on growthdeficiency on growth
Stunted
growth
Normal
growth
Total
Zinc def 30 20 50
Normal
zinc
10 40 50
40 60 100
Feed back
RR= 30/50= 3 , AR= 60%-20%= 40%
10/50Interpretation of AR:
Infants with zinc def were 3 times as likely
to develop stunted growth than among infants
With normal Zinc intake
Interpretation of AR:
zinc def increases risk of stunted growth
by 0.4
(40%) than infants with normal Zinc
intake
Exercise 6:Exercise 6:
In a case control study toIn a case control study to
find relation betweenfind relation between
hypertension & diabetes,hypertension & diabetes,
findings were as shown.findings were as shown.
What is the measure canWhat is the measure can
be used to calculate thebe used to calculate the
risk of occurrence ofrisk of occurrence of
hypertension beinghypertension being
diabetic?diabetic?
What is its value in thisWhat is its value in this
study?study?
Diabeti
c
Non
diabeti
c
Total
Hyperte
nsion 30 10 40
Non
hyperten
sion
20 40 60
Total
50 50 10
0
Feedback
OR= 30x40= 6
10x20
Risk assessment

Risk assessment

  • 1.
    Risk AssessmentRisk Assessment BYBY Dr.Mona AbosereaDr. Mona Aboserea Professor of Public Health &Professor of Public Health & Preventive MedicinePreventive Medicine 2017-20182017-2018
  • 2.
    Why Do WeStudy It?Why Do We Study It? What we must learn?What we must learn?
  • 3.
    The aim ofrisk assessment is to provideThe aim of risk assessment is to provide preventive measures. So, we need:preventive measures. So, we need: ToTo measure degree of associationmeasure degree of association between certain risk factor and thebetween certain risk factor and the occurrence of a disease.occurrence of a disease. AndAnd To quantify this risk.To quantify this risk.
  • 4.
    Relative risk (RR) Usedonly in :-Used only in :- -Cohort studies-Cohort studies -Experimental studies-Experimental studies RR=RR= Incidence of disease in exposed groupIncidence of disease in exposed group Incidence of disease in non-exposed groupIncidence of disease in non-exposed group For Quantifying Risk:For Quantifying Risk:
  • 5.
    Study Prevalence rateStudyPrevalence rate Useful for assessing theUseful for assessing the burden of diseaseburden of disease within a populationwithin a population Valuable forValuable for planning & follow upplanning & follow up Prevalence rate=Prevalence rate= No of cases (old & new)No of cases (old & new) -------------------------------------------- X Constant-------------------------------------------- X Constant No examined in the same time & placeNo examined in the same time & place 100 1000 10000 100000
  • 6.
    Incidence rate=Incidence rate= no.of new cases over a specific period of time X constantno. of new cases over a specific period of time X constant -------------------------------------------------------------------------------------------------------------------------------------- no. of persons at risk of disease over that specific period ofno. of persons at risk of disease over that specific period of timetime Study Incidence rateStudy Incidence rate
  • 7.
    Prevalence and Incidence =prevalent cases = incident cases = deaths or recoveries
  • 8.
    Prevalence is afunction of the incidence of diseasePrevalence is a function of the incidence of disease and the duration of diseaseand the duration of disease Prevalence=incidence X durationPrevalence=incidence X duration Prevalence and Incidence
  • 9.
    Interpreting Relative Risk:InterpretingRelative Risk: 1-if RR1-if RR=1=1 {Risk in exposed equal to{Risk in exposed equal to risk in non-exposed (no association)}risk in non-exposed (no association)} 2-if RR>1 {Risk in exposed greater than risk in non-exposed (+ve association; possibly causal)} 3-if RR<1 {Risk in exposed less than risk in non-exposed (-ve association; possibly protective)}
  • 10.
    Another measureAnother measureUsed only in:Used only in: -Cohort studies-Cohort studies -Experimental studies-Experimental studies is theis the Attributable Risk (AR) or riskAttributable Risk (AR) or risk differencedifference, which gives an idea about the, which gives an idea about the excess risk due to specific factor.due to specific factor. AR=AR= incidence among exposed-incidence among exposed- incidence among non-exposedincidence among non-exposed..
  • 11.
    Attributable risk inthe exposedAttributable risk in the exposed (AR(ARexpexp)) Unexposed Exposed Incidence(per1,000) ARexp
  • 12.
    Attributable riskAttributable riskis usefulis useful for Public Health guidelinesfor Public Health guidelines and planningand planning 1212
  • 13.
    Example:- a cohortof 200 workers wasExample:- a cohort of 200 workers was followed for ten years to study thefollowed for ten years to study the association between smoking andassociation between smoking and cancer lungcancer lung :: Cancer lung Yes No Total Smokers 35 65 100 Non smokers 5 95 100 Total 40 160 200
  • 14.
    The incidence ofcancer amongThe incidence of cancer among smokers=smokers= 35/10035/100 The incidence of cancer among non-The incidence of cancer among non- smokers=smokers= 5/1005/100 RR= 0.35/0.05=7RR= 0.35/0.05=7 meaningmeaning thatthat smokers are at risk of cancer lungsmokers are at risk of cancer lung 7 times more than non-smokers.7 times more than non-smokers. ARAR== 0.35-0.05=0.30.35-0.05=0.3 meaning thatmeaning that smoking increase risk of cancer lungsmoking increase risk of cancer lung byby 0.30.3 ((30%30%).).
  • 15.
    Odds ratio (OR)Oddsratio (OR) used mainly in:-used mainly in:- -Case-control studies-Case-control studies -Comparative cross sectional studies-Comparative cross sectional studies OR==Odds of exposure among exposedOdds of exposure among exposed Odds of exposure among non-exposedOdds of exposure among non-exposed Odds Ratio (OR) =Odds Ratio (OR) = No. of diseased / No. of not diseased amongNo. of diseased / No. of not diseased among exposedexposed No. of diseased / No. of not diseased amongNo. of diseased / No. of not diseased among non–exposednon–exposed
  • 16.
    1616 Cases Control Total Exposurea(diseased) b(not diseased) A+b No exposure c(diseased) d(not diseased) C+d a+c b+d A+b+ c+d Design OR= ad/bc
  • 17.
    1717 Past sugery Cases HCV+VE Control HCV -VE Total YES 3020 50 No 70 180 250 100 200 300 EXAMPLE CALCULATE: OR= ad/bc
  • 18.
  • 19.
    OR=30X180 / 20X70=3.6OR=30X180/ 20X70=3.6 1919 Interpret ????Interpret ????
  • 20.
    Exercise1:Exercise1: In a casecontrol study to investigate the associationIn a case control study to investigate the association between oral contraceptive use & hypertension, howbetween oral contraceptive use & hypertension, how to quantify the risk from the table below:to quantify the risk from the table below: Feedback1:Feedback1: Odds Ratio=Odds Ratio= 32x15 =32x15 = 1.331.33 8x458x45 hypertensivehypertensive normotensivenormotensive totaltotal CP usersCP users 1515 4545 6060 Non usersNon users 88 3232 4040 totaltotal 2323 7777 100100
  • 21.
    Exercise 2:Exercise 2: Ina case control study to investigate the associationIn a case control study to investigate the association between oral contraceptive use & occurrence ofbetween oral contraceptive use & occurrence of rheumatoid arthritis. From the table below. Whatrheumatoid arthritis. From the table below. What measure will be used to quantify risk?measure will be used to quantify risk? Feedback2:Feedback2: Odds ratioOdds ratio ad/bcad/bc because:-because:- - Case-control studyCase-control study-- unpaired qualitative data.unpaired qualitative data. - We have distribution of numbers.We have distribution of numbers. - OROR=0.44 Interpret.=0.44 Interpret. rheumatoidrheumatoid freefree totaltotal usersusers 4040 120120 160160 Non usersNon users 6060 8080 140140 totaltotal 100100 200200 300300
  • 22.
    Exercise 3:-Exercise 3:- Ina cohort study to test major ECG abnormalitiesIn a cohort study to test major ECG abnormalities as a risk factor for death from coronary heartas a risk factor for death from coronary heart disease (CHD), How to quantify risk & interpret itdisease (CHD), How to quantify risk & interpret it from the table below:-from the table below:- Feedback 3:Feedback 3: Relative risk because:-Relative risk because:- - cohort study.cohort study. - We can calculate incidenceWe can calculate incidence - RRRR= 2.45 .= 2.45 . Interpret.Interpret. ARAR= .= . Interpret.Interpret. Death fromDeath from CHDCHD No death fromNo death from CHDCHD totaltotal ECG abnormalityECG abnormality 88 3939 4747 No ECG abnormalityNo ECG abnormality 1010 134134 144144 totaltotal 1818 173173 191191
  • 23.
    Exercise 4:-Exercise 4:- Ina case-control study to test the exposure toIn a case-control study to test the exposure to ionizing radiation as a risk factor for leukemia,ionizing radiation as a risk factor for leukemia, can you quantify risk & interpret it from the tablecan you quantify risk & interpret it from the table below:-below:- Feedback 4:Feedback 4: Odds ratio ad/bc because:-Odds ratio ad/bc because:- - Case-control studyCase-control study - OR= 2 . Interpret.OR= 2 . Interpret. leukemialeukemia No leukemiaNo leukemia totaltotal Exposed to radiationExposed to radiation 7575 6060 135135 Non exposed toNon exposed to radiationradiation 2525 4040 6565 totaltotal 100100 100100 200200
  • 24.
    Exercise 5:Exercise 5: Acohort study was doneA cohort study was done to prove associationto prove association between zinc deficiencybetween zinc deficiency and stunted growth inand stunted growth in infants.infants. Calculate relative risk andCalculate relative risk and attributable risks of zincattributable risks of zinc deficiency on growthdeficiency on growth Stunted growth Normal growth Total Zinc def 30 20 50 Normal zinc 10 40 50 40 60 100 Feed back RR= 30/50= 3 , AR= 60%-20%= 40% 10/50Interpretation of AR: Infants with zinc def were 3 times as likely to develop stunted growth than among infants With normal Zinc intake Interpretation of AR: zinc def increases risk of stunted growth by 0.4 (40%) than infants with normal Zinc intake
  • 25.
    Exercise 6:Exercise 6: Ina case control study toIn a case control study to find relation betweenfind relation between hypertension & diabetes,hypertension & diabetes, findings were as shown.findings were as shown. What is the measure canWhat is the measure can be used to calculate thebe used to calculate the risk of occurrence ofrisk of occurrence of hypertension beinghypertension being diabetic?diabetic? What is its value in thisWhat is its value in this study?study? Diabeti c Non diabeti c Total Hyperte nsion 30 10 40 Non hyperten sion 20 40 60 Total 50 50 10 0 Feedback OR= 30x40= 6 10x20