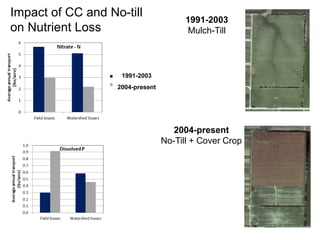
Restoring Depleted Soils:
Cover Crops and Soil Health
Newell Kitchen
USDA-ARS Cropping Systems and
Water Quality Research Unit
Columbia, MO
February 18, 2015
Cover Crops Iowa Conference, West Des Moines, IA
Consumables
“…. did not so much
collapse as consume
itself.”
How do we get away
from treating soil as a
consumable?
Recent Times
 U.S. Piedmont
used to be a major
agricultural region
 Cultivation brought
immediate and
devastating soil
erosion
• In the U.S. Midwest, extensive
flat grasslands were plowed
and put into grain production
about 100 years ago.
• Multiple and damaging large
flood events caused severe
soil erosion and property
damage between 1926-1936.
Grain crop yields for many
fields actually declined when
compared to the previous
century (Bennett, 1939).
More Recently
• A 10-cm rainfall event created
gullies that followed the planter
rows (channeled by the planter
furrow)
• About 5-cm deep x 30-cm wide, of
a 76 cm-row spacing corn crop
• Erosion “consumed” 2 cm of topsoil
• Could be replaced by growing grass for 300-400 years
Few Years Ago
Sheet
Rill Bank
Channel
What is the impact of
past erosion on productivity?
• Average 7” topsoil lost since farming started ~120 yrs ago
• Impact on production today?
• Soybean: 7” x 0.7 bu/in/a/yr x $13/bu = $64/a/yr
• Corn: 7” x 2.9 bu/in/a/yr x $5/bu = $102/a/yr
• C-S rotation: average loss $83/a/yr
“… the slower the emergency, the less
motivated we are to do anything about it.”
Dirt, David R. Montgomery
What do we know about
soil health and cover crops today that we
didn’t already know 30 years ago?
Hydrologic
Buffer
Food,
Biodiversity
and Habitat
Nutrient
Cycling
Filtering
and
Buffering
Physical
Stability
and
Support
Soil Functions
Dysfunctional Soils
ARS-MU Centralia Field-Research Station
What has been the impact of a decade
of no-till and cover crops?
Long-Term Research Field
1991-2003
Corn-Soybean Mulch-Till
2004-present
Soybean-Wheat (N)
Soybean-Corn (S)
No-Till + Cover Crop
Average Annual Sediment Loss
32% of Watershed
Rate of Soil Formation
350% more @ Field
than Watershed
1991-2003
Mulch-Till
2004-present
No-Till + Cover Crop
Impact of CC and No-till
on Nutrient Loss
1991-2003
2004-present
Downside of Cover Crops
Female meadow voles have a
gestation period of three
weeks, have an average litter
size of five, and produce four
to five litters per year. They
reach sexual maturity at 40
days and have a reproductive
life span of 1 to 2 years
Soil Health
Soil Management Assessment Framework (SMAF)
Physical Score
• bulk density
• water-filled pore space
• water-stable
aggregates
Biological Score
• organic C
• B-glucosidase
• microbial C
• mineralizable N
Chemical Score
• pH
• electrical conductivity
Nutrient Score
• extractable P
• extractable K
SMAF Total Score (0-5 cm)
G+CC
Grass/Pasture
NT G
MT G
a
ab
bc
c
c
d
Long-Term Research Field
1991-2003
Corn-Soybean Mulch-Till
2004-present
Soybean-Wheat (N)
Soybean-Corn (S)
No-Till + Cover Crop
~76 ~88
“How might we rethink the
conventional wisdom of
conventional agriculture to
find a way to work with
nature?”
Stop “trying to make soil
adapt to our technology.”
Use technology and innovation to
give us the tools to adapt to how
we manage soils.
Premise: Future agricultural will require innovation and technologies
to achieve a sustainable framework for managing soils.
Questions…..
Physical Score
• bulk density
• water-filled pore space
• water-stable
aggregates
Biological Score
• organic C
• B-glucosidase
• microbial C
• mineralizable N
Chemical Score
• pH
• electrical conductivity
Nutrient Score
• extractable P
• extractable K
SMAF Total Score (0-5 cm)
Restoring Depleted Soils - Kitchen

Restoring Depleted Soils - Kitchen

  • 1.
    Restoring Depleted Soils: CoverCrops and Soil Health Newell Kitchen USDA-ARS Cropping Systems and Water Quality Research Unit Columbia, MO February 18, 2015 Cover Crops Iowa Conference, West Des Moines, IA
  • 2.
  • 3.
    “…. did notso much collapse as consume itself.” How do we get away from treating soil as a consumable?
  • 4.
    Recent Times  U.S.Piedmont used to be a major agricultural region  Cultivation brought immediate and devastating soil erosion
  • 5.
    • In theU.S. Midwest, extensive flat grasslands were plowed and put into grain production about 100 years ago. • Multiple and damaging large flood events caused severe soil erosion and property damage between 1926-1936. Grain crop yields for many fields actually declined when compared to the previous century (Bennett, 1939). More Recently
  • 6.
    • A 10-cmrainfall event created gullies that followed the planter rows (channeled by the planter furrow) • About 5-cm deep x 30-cm wide, of a 76 cm-row spacing corn crop • Erosion “consumed” 2 cm of topsoil • Could be replaced by growing grass for 300-400 years Few Years Ago
  • 7.
  • 8.
    What is theimpact of past erosion on productivity? • Average 7” topsoil lost since farming started ~120 yrs ago • Impact on production today? • Soybean: 7” x 0.7 bu/in/a/yr x $13/bu = $64/a/yr • Corn: 7” x 2.9 bu/in/a/yr x $5/bu = $102/a/yr • C-S rotation: average loss $83/a/yr
  • 9.
    “… the slowerthe emergency, the less motivated we are to do anything about it.” Dirt, David R. Montgomery
  • 10.
    What do weknow about soil health and cover crops today that we didn’t already know 30 years ago?
  • 11.
  • 12.
  • 13.
  • 14.
    What has beenthe impact of a decade of no-till and cover crops?
  • 15.
    Long-Term Research Field 1991-2003 Corn-SoybeanMulch-Till 2004-present Soybean-Wheat (N) Soybean-Corn (S) No-Till + Cover Crop
  • 16.
    Average Annual SedimentLoss 32% of Watershed Rate of Soil Formation 350% more @ Field than Watershed
  • 17.
    1991-2003 Mulch-Till 2004-present No-Till + CoverCrop Impact of CC and No-till on Nutrient Loss 1991-2003 2004-present
  • 18.
    Downside of CoverCrops Female meadow voles have a gestation period of three weeks, have an average litter size of five, and produce four to five litters per year. They reach sexual maturity at 40 days and have a reproductive life span of 1 to 2 years
  • 19.
    Soil Health Soil ManagementAssessment Framework (SMAF) Physical Score • bulk density • water-filled pore space • water-stable aggregates Biological Score • organic C • B-glucosidase • microbial C • mineralizable N Chemical Score • pH • electrical conductivity Nutrient Score • extractable P • extractable K
  • 20.
    SMAF Total Score(0-5 cm) G+CC Grass/Pasture NT G MT G a ab bc c c d
  • 21.
    Long-Term Research Field 1991-2003 Corn-SoybeanMulch-Till 2004-present Soybean-Wheat (N) Soybean-Corn (S) No-Till + Cover Crop ~76 ~88
  • 22.
    “How might werethink the conventional wisdom of conventional agriculture to find a way to work with nature?” Stop “trying to make soil adapt to our technology.” Use technology and innovation to give us the tools to adapt to how we manage soils. Premise: Future agricultural will require innovation and technologies to achieve a sustainable framework for managing soils.
  • 23.
  • 24.
    Physical Score • bulkdensity • water-filled pore space • water-stable aggregates Biological Score • organic C • B-glucosidase • microbial C • mineralizable N Chemical Score • pH • electrical conductivity Nutrient Score • extractable P • extractable K SMAF Total Score (0-5 cm)

Editor's Notes

  • #3 a commodity that is intended to be used up relatively quickly
  • #12 As humans, we are a whole lot better at seeing things that we do wrong than we are at seeing things that we do right Engineer solutions, now we are seeing cover crops as a way to restore function
  • #13 As humans, we are a whole lot better at seeing things that we do wrong than we are at seeing things that we do right Engineer solutions, now we are seeing cover crops as a way to restore function
  • #20 The Soil Management Assessment Framework (SMAF) provides site-specific interpretations for soil quality indicator results. Because the definition of soil quality for your site depends on your management goals, climate, crops, and soil type, a framework approach to soil quality indexing is used. This allows for the necessary differences in site- and goal-specific interpretations of indicator results. The index framework involves three main steps: Indicator selection to efficiently and effectively monitor the critical soil functions Interpreting indicators in terms of soil function (using expected ranges determined by the soil's inherent capability) Combining indicator scores into an integrated index of soil quality (optional). The result is a relative measure of the soil's ability to perform the functions necessary for its intended use. Andrews et al., 2001