Download to read offline

![References:
YANG, W. X., & GAO, Y. X. (2005). Response surface methodology
& its application in food industry [J]. China Food Additives, 2(2), 68-71.
Erbay, Z., & Icier, F. (2009). Optimization of hot air drying of olive
leaves using response surface methodology. Journal of food
engineering, 91(4), 533-541.
Montgomery, D. C. (2015). Design and analysis of experiments.
John wiley & sons.](https://image.slidesharecdn.com/new-200819162638/85/Response-Surface-Methodology-In-the-Food-Sector-13-320.jpg)


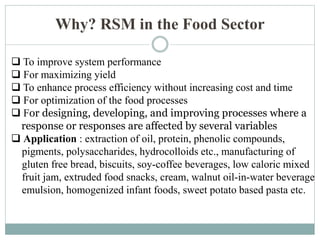
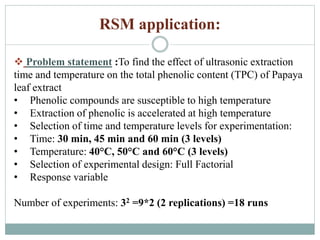
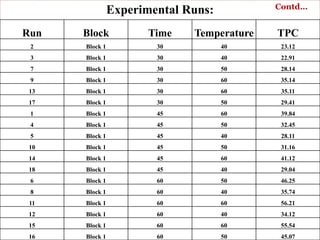
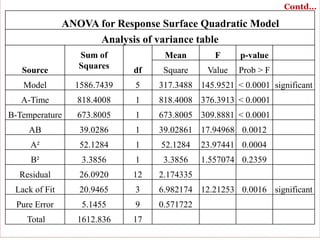
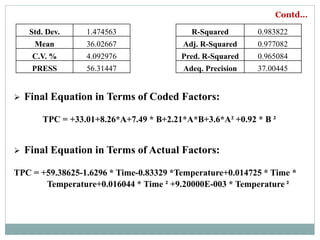
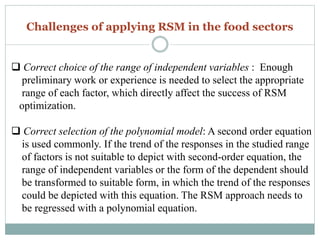
This document discusses Response Surface Methodology (RSM) in the food sector, highlighting its applications, including improving system performance and optimizing food processes. It provides a detailed example of the methodology applied to optimizing phenolic content in papaya leaf extract through experimental design and analysis of variance. The document also addresses challenges in RSM application, emphasizing the importance of selecting appropriate variable ranges and polynomial models.