This document analyzes factors that affect traffic, including population increase, peak hours of traffic, construction zones, and border crossings. It summarizes various traffic models, including the Lighthill-Whitham and Payne-Whitham models. While traffic will likely always exist due to urban development and safety needs, understanding the causes of traffic through analysis can help drivers accommodate better and improve safety. The conclusion emphasizes that preparation and patience are key for dealing with inevitable traffic issues rather than attempts to fully eliminate traffic.
![9Guinto
Analysis 5 – Borders
The amount of drivers in America are increasing and as a result, creating traffic. The
ministries of transportation from Great Britain have published the “Traffic in Towns” textbook,
which contains studies on the attempts of past engineers that have tried to permanently remove
traffic, as well as provided theoretical approaches, based on statistics, to ease traffic. Great
Britain agrees when they state, “American experience shows that as vehicles increase in numbers
the usage per vehicle also tends to increase” (Great Britain 27). We can infer that if there were
fewer cars on the roads, there would also be less traffic. However, in order to reduce the number
of cars, we would first need to determine what factors increases the use of private vehicles. Great
Britain argues that “the growth in the number of private cars would seem to depend primarily
upon the growth of incomes, but it is also dependent upon the price of cars, insurance rates, [and]
taxation levels” (26). Unexpectedly, the amount of income that individuals allocate plays a part
in the amount of traffic that is formed at a given time because there is a correlation between
income and cost of maintaining a car. In the United States, a large majority of our population
comes from Latino communities, which yields a lot of tourism from the U.S. and Mexico, a
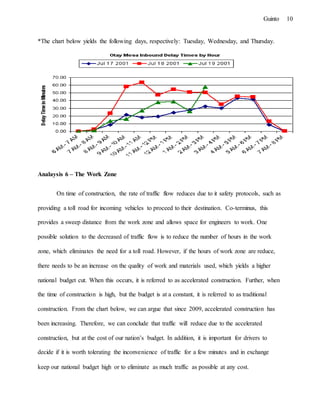
developing nation. In the Otay Mesa U.S. and Mexico’s border, there often seems to be traffic
for incoming vehicles headed to the U.S. However, if we study closely, we can determine that
the busiest hours of traffic are throughout the middle of the day. With this statistic, we can
provide drivers with appropriate hours of traveling from Mexico to the U.S.](https://image.slidesharecdn.com/010757d6-4670-4c00-9e55-a590f5cafb86-150920200738-lva1-app6892/85/Research-Paper-Civil-Engineering-9-320.jpg)