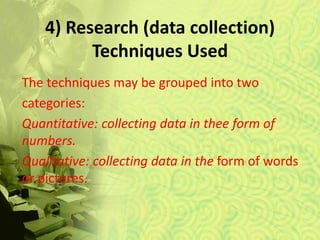
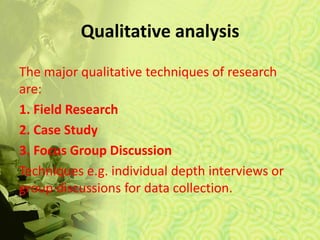
This document defines and describes different types of research. It discusses research purposes including exploratory, descriptive, and explanatory research. It also covers research uses in basic and applied contexts. The time dimension of cross-sectional and longitudinal research is outlined. Finally, it details quantitative and qualitative data collection techniques.
Research, Types and objectives of research Bindu Kshtriya
This presentation is regarding the basics of research method, about the voyage of research, steps included in research, types of research including descriptive, analytical, applied, fundamental, quantitative, qualitative conceptual, empirical historical conclusion oriented etc
Research Methodology Introduction ch1
MEANING OF RESEARCH, OBJECTIVES OF RESEARCH,TYPES OF RESEARCH,Research Approaches ,Research Methods versus Methodology,research process guideline:
In this ppt you can find the materials regarding Significance of Research/Importance of Research
Subscribe to Vision Academy for Video assistance https://www.youtube.com/channel/UCjzpit_cXjdnzER_165mIiw
In this ppt you can find the materials regarding Significance of Research/Importance of Research
Subscribe to Vision Academy for Video assistance https://www.youtube.com/channel/UCjzpit_cXjdnzER_165mIiw
Dear Colleague,
On behalf of the IJMSIR Panel of Directors, we invite you to join us
at the IJMSIR special symposium training 2020 to be held in
Catholic University of Ghana (CUG) Virtually on Microsoft Team.
The conference is a great way to be inspired by our keynote
speakers, engage in debates with other scholars, and enjoy our
social functions and the hospitality of CUG. New delegates are
always welcome so please spread the word to others.
Explore our comprehensive data analysis project presentation on predicting product ad campaign performance. Learn how data-driven insights can optimize your marketing strategies and enhance campaign effectiveness. Perfect for professionals and students looking to understand the power of data analysis in advertising. for more details visit: https://bostoninstituteofanalytics.org/data-science-and-artificial-intelligence/
Show drafts
volume_up
Empowering the Data Analytics Ecosystem: A Laser Focus on Value
The data analytics ecosystem thrives when every component functions at its peak, unlocking the true potential of data. Here's a laser focus on key areas for an empowered ecosystem:
1. Democratize Access, Not Data:
Granular Access Controls: Provide users with self-service tools tailored to their specific needs, preventing data overload and misuse.
Data Catalogs: Implement robust data catalogs for easy discovery and understanding of available data sources.
2. Foster Collaboration with Clear Roles:
Data Mesh Architecture: Break down data silos by creating a distributed data ownership model with clear ownership and responsibilities.
Collaborative Workspaces: Utilize interactive platforms where data scientists, analysts, and domain experts can work seamlessly together.
3. Leverage Advanced Analytics Strategically:
AI-powered Automation: Automate repetitive tasks like data cleaning and feature engineering, freeing up data talent for higher-level analysis.
Right-Tool Selection: Strategically choose the most effective advanced analytics techniques (e.g., AI, ML) based on specific business problems.
4. Prioritize Data Quality with Automation:
Automated Data Validation: Implement automated data quality checks to identify and rectify errors at the source, minimizing downstream issues.
Data Lineage Tracking: Track the flow of data throughout the ecosystem, ensuring transparency and facilitating root cause analysis for errors.
5. Cultivate a Data-Driven Mindset:
Metrics-Driven Performance Management: Align KPIs and performance metrics with data-driven insights to ensure actionable decision making.
Data Storytelling Workshops: Equip stakeholders with the skills to translate complex data findings into compelling narratives that drive action.
Benefits of a Precise Ecosystem:
Sharpened Focus: Precise access and clear roles ensure everyone works with the most relevant data, maximizing efficiency.
Actionable Insights: Strategic analytics and automated quality checks lead to more reliable and actionable data insights.
Continuous Improvement: Data-driven performance management fosters a culture of learning and continuous improvement.
Sustainable Growth: Empowered by data, organizations can make informed decisions to drive sustainable growth and innovation.
By focusing on these precise actions, organizations can create an empowered data analytics ecosystem that delivers real value by driving data-driven decisions and maximizing the return on their data investment.
Data Centers - Striving Within A Narrow Range - Research Report - MCG - May 2...pchutichetpong
M Capital Group (“MCG”) expects to see demand and the changing evolution of supply, facilitated through institutional investment rotation out of offices and into work from home (“WFH”), while the ever-expanding need for data storage as global internet usage expands, with experts predicting 5.3 billion users by 2023. These market factors will be underpinned by technological changes, such as progressing cloud services and edge sites, allowing the industry to see strong expected annual growth of 13% over the next 4 years.
Whilst competitive headwinds remain, represented through the recent second bankruptcy filing of Sungard, which blames “COVID-19 and other macroeconomic trends including delayed customer spending decisions, insourcing and reductions in IT spending, energy inflation and reduction in demand for certain services”, the industry has seen key adjustments, where MCG believes that engineering cost management and technological innovation will be paramount to success.
MCG reports that the more favorable market conditions expected over the next few years, helped by the winding down of pandemic restrictions and a hybrid working environment will be driving market momentum forward. The continuous injection of capital by alternative investment firms, as well as the growing infrastructural investment from cloud service providers and social media companies, whose revenues are expected to grow over 3.6x larger by value in 2026, will likely help propel center provision and innovation. These factors paint a promising picture for the industry players that offset rising input costs and adapt to new technologies.
According to M Capital Group: “Specifically, the long-term cost-saving opportunities available from the rise of remote managing will likely aid value growth for the industry. Through margin optimization and further availability of capital for reinvestment, strong players will maintain their competitive foothold, while weaker players exit the market to balance supply and demand.”
Techniques to optimize the pagerank algorithm usually fall in two categories. One is to try reducing the work per iteration, and the other is to try reducing the number of iterations. These goals are often at odds with one another. Skipping computation on vertices which have already converged has the potential to save iteration time. Skipping in-identical vertices, with the same in-links, helps reduce duplicate computations and thus could help reduce iteration time. Road networks often have chains which can be short-circuited before pagerank computation to improve performance. Final ranks of chain nodes can be easily calculated. This could reduce both the iteration time, and the number of iterations. If a graph has no dangling nodes, pagerank of each strongly connected component can be computed in topological order. This could help reduce the iteration time, no. of iterations, and also enable multi-iteration concurrency in pagerank computation. The combination of all of the above methods is the STICD algorithm. [sticd] For dynamic graphs, unchanged components whose ranks are unaffected can be skipped altogether.
As Europe's leading economic powerhouse and the fourth-largest hashtag#economy globally, Germany stands at the forefront of innovation and industrial might. Renowned for its precision engineering and high-tech sectors, Germany's economic structure is heavily supported by a robust service industry, accounting for approximately 68% of its GDP. This economic clout and strategic geopolitical stance position Germany as a focal point in the global cyber threat landscape.
In the face of escalating global tensions, particularly those emanating from geopolitical disputes with nations like hashtag#Russia and hashtag#China, hashtag#Germany has witnessed a significant uptick in targeted cyber operations. Our analysis indicates a marked increase in hashtag#cyberattack sophistication aimed at critical infrastructure and key industrial sectors. These attacks range from ransomware campaigns to hashtag#AdvancedPersistentThreats (hashtag#APTs), threatening national security and business integrity.
🔑 Key findings include:
🔍 Increased frequency and complexity of cyber threats.
🔍 Escalation of state-sponsored and criminally motivated cyber operations.
🔍 Active dark web exchanges of malicious tools and tactics.
Our comprehensive report delves into these challenges, using a blend of open-source and proprietary data collection techniques. By monitoring activity on critical networks and analyzing attack patterns, our team provides a detailed overview of the threats facing German entities.
This report aims to equip stakeholders across public and private sectors with the knowledge to enhance their defensive strategies, reduce exposure to cyber risks, and reinforce Germany's resilience against cyber threats.
2. What is research?
Research is a process of steps used to collect
and analyze information to increase our
understanding of a topic or issue.
The main goal of research is the gathering and
interpreting of information to answer questions
(Hyllegard, Mood, and Morrow, 1996).
3. Research classification
Research comes in many shapes and
sizes.
Before a researcher begins to conduct a
study, he or she must decide on a specific
type of research.
4. Research classification
For classification of research we shall look from
four dimensions:
1. The purpose of doing research;
2. The intended uses of research;
3. How it treats time i.e. the time dimension in
research; and
4. The research (data collection) techniques
used in it.
5. 1) Purpose of Doing Research
There are almost as many reasons to do
research as there are researches. Purposes of
research may be organized into three groups
based on what the researcher is trying to
accomplish
I. Exploratory Research
II. Descriptive Research
III. Explanatory Research
6. I) Exploratory Research
You are exploring a new topic or issue in
order to learn about it.
The researcher’s goal is to formulate more
precise questions that future research can
answer.
Exploratory research may be the first stage in
a sequence of studies.
7. Goals of Exploratory Research:
Become familiar with the basic facts, setting, and
concerns
Develop well grounded picture of the situation
Generate new ideas, assumption, or hypotheses
Develop techniques and a sense of direction for
future research.
8. II) Descriptive Research
Presents a picture of the specific details of a
situation.
The major purpose of descriptive research, is
to describe characteristics of a population or
phenomenon.
9. Goals of Descriptive Research
Describe the situation in terms of its
characteristics i.e. provide an accurate profile of
a group
Give a verbal or numerical picture (%) of the
situation
Present background information
Focus on ‘who,’ ‘what,’ ‘when,’ ‘where,’ and
‘how’ but not why?
10. III) Explanatory Research
It builds on exploratory and descriptive research
and goes on to identify the reasons for
something that occurs.
Tells why things are the way they are.
The desire to know “why,” to explain, is the
purpose of explanatory research.
11. Looks for causes and reasons.
For example, a descriptive research may
discover that 10 percent of the parents abuse
their children, whereas the explanatory
researcher is more interested in learning why
parents abuse their children.
12. Goals of Explanatory Research
Explain things not just reporting. Why?
Determine which of several explanations is
best.
Determine the accuracy of the theory; test a
theory’s predictions or principle.
13. 2) Use of research
Research can be used for basic level or
advanced level. Depends upon researcher’s
choice.
Some researchers focus on using research to
advance general knowledge, whereas others
use it to solve specific problems.
14. (i) Basic research
Basic research is directed towards finding
information that has a broad base of
applications.
Focuses on refuting or supporting
theories that explain how this world
operates, what makes things happen, why
social relations are a certain way, and why
society changes.
15. (i) Basic research
It generates new ideas, principles and
theories.
Today’s computers could not exist without the
pure research in mathematics conducted over
a century ago, for which there was no known
practical application at that time.
16. (ii) Applied Research
It try to solve specific problems or help
practitioners accomplish tasks.
Theory is less central than seeking a solution
on a specific problem.
Applied research is conducted when decision
must be made about a specific real-life
problem.
Central aim of applied research is to discover
a solution for some critical practical problem
17. (ii)Applied Research
The consumers of applied research findings are
practitioners such as teachers, counselors, or
decision makers such as managers,
committees, and officials.
18. 3) The Time Dimension in Research
From the angle of time research could be divided
into two broad types:
a) Cross-Sectional Research.
b) Longitudinal Research.
19. The Time Dimension in Research
a) Cross-Sectional Research.
It gives us a snapshot of a single, fixed time
point and allow us to analyze it in detail.
Researchers observe at one point in time
It cannot capture the change processes
Simplest and cheaper
20. The Time Dimension in Research
b) Longitudinal Research.
Provide a moving picture over a period of time.
Used to examine features of people or other
units at more than one time.
More complex and costly than cross-sectional
research
Answers to questions about change are
determined.
21. Types of longitudinal research
Time series research
The panel study
Cohort analysis
22. Time series research:
Same type of information is collected on a group of
people or other units across multiple time periods.
The panel study:
In panel study, the researcher observes exactly the same
people, group, or organization across time periods.
Cohort analysis:
In it rather than observing the exact same people, a
category of people who share a similar life experience in
a specified time period is studied.
The focus is on category, not on specific individuals.
Examples; all people hired at the same time, all people
retire on one or two year time frame, and all people who
graduate in a given year
23. 4) Research (data collection)
Techniques Used
The techniques may be grouped into two
categories:
Quantitative: collecting data in thee form of
numbers.
Qualitative: collecting data in the form of words
or pictures.
24. Quantitative research
Quantitative research can be numerically
stated or compared; may use statistical
standards.
Involves objective measurements
Quantitative research uses closed-end or
forced choice questions.
Factual, numerical questions with short
responses that have precise and conclusive
outcomes.
25. Quantitative research
The main quantitative techniques are:
1. Experiments
2. Surveys
3. Content Analysis
4. Using Existing Statistics
Techniques such as online questionnaires,
on-street or telephone interviews for data
collection
26. Qualitative analysis
Subjective (influenced-biased) in nature
Uses a problem or open-ended, free response
format to investigate the value of programs
Asks broad questions and collects word data
Looks at how and why.
Yields an in-depth understanding of an issue.
27. Qualitative analysis
The major qualitative techniques of research
are:
1. Field Research
2. Case Study
3. Focus Group Discussion
Techniques e.g. individual depth interviews or
group discussions for data collection.
Editor's Notes
Good researchers understand the advantages and disadvantages of each type, although most end up specializing in one.
Studies may have multiple purposes (e.g. both to explore and to describe) but one purpose usually dominates.
A great deal of social research is descriptive. Descriptive researchers use most data –gathering
techniques – surveys, field research, and content analysis
Those who seek an understanding of the fundamental nature of social reality are engaged in basic research (also called academic research or pure research or fundamental research).
Applied researchers, primarily want to apply and modify knowledge to address a specific practical issue. They want to solve a critical social and economic problem.
The scientific community is the primary consumer of basic research.
Applied research is frequently a descriptive
For example, an organization contemplating a
paperless office and a networking system for the company’s personal computers may conduct research to learn the amount of time its employees spend at personal computers in an average week.
It is usually more complex and costly than cross-sectional research but it is also more powerful, especially when researchers seek answers to questions
about change.
Let’s say we want to investigate the relationship between daily walking and cholesterol levels in the body. One of the first things we’d have to determine is the type of study that will tell us the most about that relationship. Do we want to compare cholesterol levels among different populations of walkers and non-walkers at the same point in time? Or, do we want to measure cholesterol levels in a single population of daily walkers over an extended period of time?
Quantitative Research options have been predetermined and a large number of respondents are
involved. By definition, measurement must be objective, quantitative and statistically valid.
Simply put, it’s about numbers, objective hard data.
To gain an understanding of underlying reasons and motivations
To provide insights into the setting of a problem, generating ideas for later quantitative research
In layman's terms, this means that the quantitative researcher asks a specific, narrow question and collects numerical data from participants to answer the question. The researcher analyzes the data with the help of statistics. The researcher is hoping the numbers will yield an unbiased result that can be generalized to some larger population. Qualitative research, on the other hand, asks broad questions and collects word data from participants
Content analysis::: a systemic analysis of content rather than structure such as written work,speeech,or film