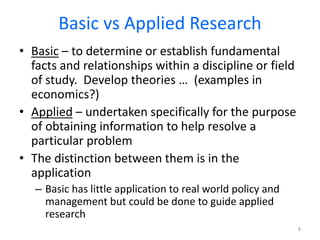
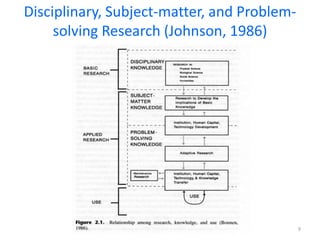
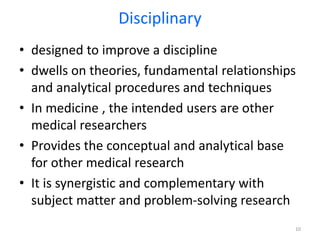
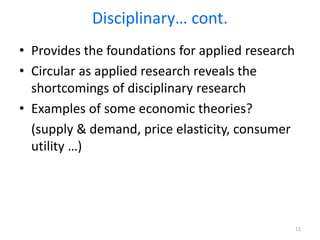
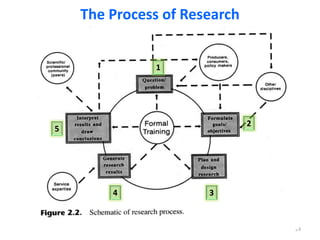
This document provides an overview of research methods topics covered in an AML 4311 lecture, including defining research, classifying different types of research, and outlining the research process. Research is systematically defined as seeking new and reliable knowledge. Basic research aims to establish fundamental facts, while applied research aims to solve practical problems. Research can also be classified as disciplinary, subject-matter, or problem-solving based on its goals. The research process involves formulating a question, developing objectives and a design, conducting the research, analyzing results, and interpreting findings. Creativity and various methods play important roles in the research process.
Research and experimental development (R&D)
Creative work undertaken on a systematic basis in order to increase the stock of knowledge, including knowledge of man, culture and society, and the use of this stock of knowledge to devise new applications
Research and experimental development (R&D)
Creative work undertaken on a systematic basis in order to increase the stock of knowledge, including knowledge of man, culture and society, and the use of this stock of knowledge to devise new applications
Research in general refers to….
A search for knowledge.
A scientific and systematic search for relevant information on a specific topic.
Research is an art of scientific investigation.
Research is a careful investigation or inquiry especially through search for new facts in any branch of knowledge.
Research in general refers to….
A search for knowledge.
A scientific and systematic search for relevant information on a specific topic.
Research is an art of scientific investigation.
Research is a careful investigation or inquiry especially through search for new facts in any branch of knowledge.
Operation “Blue Star” is the only event in the history of Independent India where the state went into war with its own people. Even after about 40 years it is not clear if it was culmination of states anger over people of the region, a political game of power or start of dictatorial chapter in the democratic setup.
The people of Punjab felt alienated from main stream due to denial of their just demands during a long democratic struggle since independence. As it happen all over the word, it led to militant struggle with great loss of lives of military, police and civilian personnel. Killing of Indira Gandhi and massacre of innocent Sikhs in Delhi and other India cities was also associated with this movement.
Biological screening of herbal drugs: Introduction and Need for
Phyto-Pharmacological Screening, New Strategies for evaluating
Natural Products, In vitro evaluation techniques for Antioxidants, Antimicrobial and Anticancer drugs. In vivo evaluation techniques
for Anti-inflammatory, Antiulcer, Anticancer, Wound healing, Antidiabetic, Hepatoprotective, Cardio protective, Diuretics and
Antifertility, Toxicity studies as per OECD guidelines
A Strategic Approach: GenAI in EducationPeter Windle
Artificial Intelligence (AI) technologies such as Generative AI, Image Generators and Large Language Models have had a dramatic impact on teaching, learning and assessment over the past 18 months. The most immediate threat AI posed was to Academic Integrity with Higher Education Institutes (HEIs) focusing their efforts on combating the use of GenAI in assessment. Guidelines were developed for staff and students, policies put in place too. Innovative educators have forged paths in the use of Generative AI for teaching, learning and assessments leading to pockets of transformation springing up across HEIs, often with little or no top-down guidance, support or direction.
This Gasta posits a strategic approach to integrating AI into HEIs to prepare staff, students and the curriculum for an evolving world and workplace. We will highlight the advantages of working with these technologies beyond the realm of teaching, learning and assessment by considering prompt engineering skills, industry impact, curriculum changes, and the need for staff upskilling. In contrast, not engaging strategically with Generative AI poses risks, including falling behind peers, missed opportunities and failing to ensure our graduates remain employable. The rapid evolution of AI technologies necessitates a proactive and strategic approach if we are to remain relevant.
The French Revolution, which began in 1789, was a period of radical social and political upheaval in France. It marked the decline of absolute monarchies, the rise of secular and democratic republics, and the eventual rise of Napoleon Bonaparte. This revolutionary period is crucial in understanding the transition from feudalism to modernity in Europe.
For more information, visit-www.vavaclasses.com
Francesca Gottschalk - How can education support child empowerment.pptxEduSkills OECD
Francesca Gottschalk from the OECD’s Centre for Educational Research and Innovation presents at the Ask an Expert Webinar: How can education support child empowerment?
2. Organization of this lecture
Research Methods:
• Explain types and concepts of research
• Formulate the concepts of research
proposal
• Analyze data using conventional methods
• Prepare a research report
2
3. Research Defined and Described
“Research is the systematic approach to
obtaining and confirming new and reliable
knowledge”
– Systematic and orderly (following a series of
steps)
– Purpose is new knowledge, which must be
reliable
This is a general definition which applies to all
disciplines
3
4. Research is…
1. Searching for explanation of events,
phenomena, relationships and causes
– What, how and why things occur
– Are there interactions?
2. A process
– Planned and managed – to make the information
generated credible
– The process is creative
– It is circular – always leads to more questions
4
5. • All well designed and conducted research has
potential application.
• Failure to see applications can be due to:
– Users not trained or experienced in the specialized
methods of economic research and reasoning
– Researchers often do not provide adequate
interpretations and guidance on applications of
the research
• Researchers are responsible to help users
understand research implications
(How?)
5
6. Public good
• Public research is a public good
– May be more rigorous and objective because it is
subject to more scrutiny
• Private research may also be rigorous
– But research on a company’s product may be
questioned as biased.
6
7. Classification of Research
• Before classification, we must first define types
of research
• Different criteria are used to classify research
types
(All of these are somewhat arbitrary and artificial)
7
8. Basic vs Applied Research
• Basic – to determine or establish fundamental
facts and relationships within a discipline or field
of study. Develop theories … (examples in
economics?)
• Applied – undertaken specifically for the purpose
of obtaining information to help resolve a
particular problem
• The distinction between them is in the
application
– Basic has little application to real world policy and
management but could be done to guide applied
research
8
10. • designed to improve a discipline
• dwells on theories, fundamental relationships
and analytical procedures and techniques
• In medicine , the intended users are other
medical researchers
• Provides the conceptual and analytical base
for other medical research
• It is synergistic and complementary with
subject matter and problem-solving research
10
Disciplinary
11. • Provides the foundations for applied research
• Circular as applied research reveals the
shortcomings of disciplinary research
• Examples of some economic theories?
(supply & demand, price elasticity, consumer
utility …)
11
Disciplinary… cont.
12. Subject-matter research
• “research on a subject of interest to a set of
decision makers.
• Tends to follow subject-matter boundaries within
a discipline ( eg. resource economics, production
economics, labor economics)
• Inherently multidisciplinary, drawing information
from many disciplines
– eg. consumer economic draws from psychology,
natural resource economics from biology, economic
policy from political science
12
13. Subject-matter research … cont.
• Provides policy makers with general
knowledge to make decisions about various
problems.
• A primary source of policy applications for
economics
• Subject-matter research is a cornerstone in
economics – it involves direct application of
economics to contemporary issues.
13
14. Problem-solving research
• Designed to solve a specific problem for a specific
decision maker
• Often results in recommendations on decisions or
actions
• Problem-solving research is holistic – uses all
information relevant to the specific problem
(while disciplinary research tends to be
reductionist)
• Disciplinary research is generally the most
“durable” (long lasting); problem-solving research
the least durable
14
15. Analytic vs Descriptive Research
• Descriptive Research – the attempt to
determine, describe, or identify something
– The intent is often synthesis, which pulls
knowledge or information together
• Analytic – the attempt to establish why
something occurs or how it came to be
• All disciplines generally engage in both
15
16. Conti,
• Quantitative - as the name suggests, is concerned with trying
to things; it asks questions such as ‘how long’, ‘how many’
• or ‘the degree to which’. Quantitative methods look to
quantify data and generalize results from a sample of the
population of interest.
• They may look to measure the incidence of various views and
opinions in a chosen sample for example or aggregate results.
• Qualitative – concerned with a quality of information,
qualitative methods attempt to gain an understanding of the
underlying reasons and motivations for actions and establish
how people interpret their experiences and the world around
them.
• Qualitative methods provide insights into the setting of a
problem, generating ideas and/or hypotheses.
16
17. Conti,
• Conceptual vs. Empirical: Conceptual research is that related to some abstract
idea(s) or theory. It is generally used by philosophers and thinkers to develop new
concepts or to reinterpret existing ones. On the other hand, empirical research relies
on experience or observation alone, often without due regard for system and theory.
• Some Other Types of Research: All other types of research are variations of one or
more of the above stated approaches, based on either the purpose of research, or the
time required to accomplish research, on the environment in which research is
done, or on the basis of some other similar factor. Form the point of view of time,
we can think of research either as one-time research or longitudinal research. In the
former case the research is confined to a single time-period, whereas in the latter
case the research is carried on over several time-periods.
17
18. Conti,
18
Aim Quantitative Qualitative
The aim is to count things in an attempt to explain
what is observed The aim is a complete, detailed description of
what is observed
Purpose Generalisability, prediction, causal explanations Contextualisation, interpretation, understanding
perspectives
Tools Researcher uses tools, such as
surveys, to collect numerical data. Researcher is the data gathering instrument
Data collection Structured Unstructured
Output Data is in the form of numbers and
statistics.
.
Data is in the form of words, pictures or objects
Sample Usually a large number of cases representing the
population of interest. Randomly selected
respondents
Usually a small number of non representative
cases. Respondents selected on their experience.
Objective/Subjective Objective – seeks precise measurement & analysis
Subjective - individuals’ interpretation of
events is important
Research role Researcher tends to remain objectively separated
from the subject matter.
Researcher tends to become subjectively
immersed in the subject matter.
19. Methodology Defined & Described
Methodology and Method are often (incorrectly)
used interchangeable
• Methodology – the study of the general
approach to inquiry in a given field
• Method – the specific techniques, tools or
procedures applied to achieve a given objective
– Research methods in economics include regression
analysis, mathematical analysis, operations
research, surveys, data gathering, etc.
19
20. • Contrast research methodology in economics
(the approach to research) to economic
methodology (the general approach to
economic reasoning and economic concepts)
• While these are different they are
interdependent ( in the same way as science
and research are related)
20
21. Cont.,
• Research methods are the techniques you use to do
research. They represent the tools of the trade, and
provide you with ways to collect, sort and analyse
information so that you can come to some conclusions.
• If you use the right sort of methods for your particular
type of
• research, then you should be able to convince other
people that your conclusions have some validity, and
that the new knowledge you have created is soundly
based.
21
22. Some of the ways to do research
• Categorize. This involves forming a typology of objects, events or concepts, i.e. a set
of names or ‘boxes’ into which these can be sorted. This can be useful in explaining
which ‘things’ belong together and how.
• Describe. Descriptive research relies on observation as a means of collecting data
again under the same circumstances.
• Explain. This is a descriptive type of research specifically designed to deal with
complex issues
• Evaluate. This involves making judgements about the quality of objects or events.
• Compare. Two or more contrasting cases can be examined to highlight differences
and similarities between them, leading to a better understanding of phenomena.
• Correlate. The relationships between two phenomena are investigated to see whether
and how they influence each other.
• Predict. This can sometimes be done in research areas where correlations are already
known.
• Control. Once you understand an event or situation, you may be able to find ways to
control it.
22
23. The Process of Research
• The process is initiated with a question or
problem (step 1)
• Next, goals and objectives are formulated to
deal with the question or problem (step 2)
• Then the research design is developed to
achieve the objectives (step 3)
• Results are generated by conducting the
research (step 4)
• Interpretation and analysis of results follow
(step 5)
23
25. Creativity in the Research Process
• Research is a creative process
• “…research includes far more than mere logic … It
includes insight, genius, groping, pondering –
‘sense’ … The logic we can teach; the art we
cannot”
• Research requires (or at least works best) with
imagination, initiative, intuition, and curiosity.
• There are different types of creativity,
characteristic of different situations – “applied”
and “theoretical” most closely associate with
economic research
25
26. Fostering Creativity (Ladd 1987)
A. Gather and use previously developed knowledge
B. Exchange ideas
C. Apply deductive logic
D. Look at things alternate ways
E. Question or challenge assumptions
F. Search for patterns or relationships
G. Take risks
H. Cultivate tolerance for uncertainty
26
27. Fostering Creativity … cont.
I. Allow curiosity to grow
J. Set problems aside … and come back to them
K. Write down your thoughts
“… frequently I don’t know what I think until I write it”
L. Freedom from distraction … some time to think.
Creativity may provide the difference between
satisfactory and outstanding research.
27
28. BIOSTATISTICS AND RESEARCH METHODOLOGY
• Origin of the word Statistics- From the Italian STATISTA meaning statesman.
• Used first formally by Gottfried Achenwall (1719-1772). He was a professor at Marlbotough
and Gottingen.
• The word was introduced in to England by Dr. Zimmerman
• It was then popularized by sir John Sinclair in his work called statistical account of Scotland
(1791-1799).
USE OF STATISTICS BY EARLIER GOVERNMENTS
• Was used in ancient Babylon, Egypt and Rome for population and resources records
• Ownership of land registration started in the middle Ages
• AD 762 Chloride Magil asked for detailed description of church owned property.
• 1086 William the conqueror ordered the publication of the doomsday book in which extent,
value and ownership of the lands of England were recorded. This was England's first
statistical abstract.
28
29. EARLY PREDICTIONS
• Biostatistics (a study of biology and statistics; sometimes referred to as biometry or
biometrics) is the application of statistics to a wide range of topics in biology.
• The science of biostatistics encompasses the design of biological experiments,
especially in medicine, pharmacy, agriculture and fishery; the collection,
summarization, and analysis of data from those experiments; and the interpretation
of, and inference from, the results.
• A major branch of this is medical biostatistics,which is exclusively concerned with
medicine and health.
• Henry VII feared plague and so ordered registration of deaths in 1532. At the same
time the French law established registration of baptisms, deaths and marriages.
• English governments published weekly deaths and by 1632 these bills of mortality
listed births and deaths by sex.
29
30. Conti,
• In 1632, captain John grant used 30 years data to make
predictions about the number of persons who would die from
various diseases and in male and female proportions. This
work was a pioneer effort in STATISTICAL ANALYSIS.
• Handling samples less than 30
• William S. Gosset was a statistician employed by the Guinness
Breweries in Dublin. The company sent him to UCL to work
on a way that would be used to handle data of samples less
than 30 i.e. data not normally distributed. He succeeded and
published his work in 1908 but he could not sign it in his name
as the company regulations did not allow. So he simply signed
STUDENT. Hence the student-t distribution or test. This
distribution was further perfected by Sir Richard Fisher in
1924.
30
31. Statistics can be used to lie
• We see a lot of this in business and politics etc
• Benjamin Disrael a 19th British conservative prime minister once said.
There are three kinds of lies; lies, damned lies and statistics.
• In Biomedical research those who know little statistics could easily lie by
using wrong data analysis tool or making wrong conclusions intentionally.
Therefore Biostatistics is the mathematics of biomedical experiments.
Statistical methods are applied to the solutions of biomedical problems.
This becomes important when we realize how biomedical knowledge has
been obtained, being modified and extended by research. Statistical
methods thus enable us to make statements and draw
conclusions(inferences) from sample data. Thus we can set confidence
limits and carry out a test of significance for a population based on sample
data.
31
32. Conti,
• We may also need biostatistics in biomedical research for the
following reasons:
• To evaluate biomedical literature
• Interpreting vital statistics
• Understanding biomedical problems e.g epidemiological data
• Interpret information e.g. drugs
• Being abreast with current trends and being critical about data
reported In journals
• Evaluation of research protocols and articles
• Participation or directing rsearch
32
33. WHAT WE NEED TO KNOW ABOUT DATA IN
BIOMEDICAL RESEARCH
1. Where data originated
2. Whether data contradict some facts we have already
3. Is there some evidence missing that may cause us to arrive at a different
conclusion?
4. How many observations were made?
5. Is the conclusion going to be logical?
• Data are always based on individual observations. Data could also be
obtained from past records. We gather data from a sample and use data to
make inferences on population. A population I statistics is a collection of
all animals we are studying. We may measure one property by the
individual observation e. g Wt.
33
34. FREQUENCY DISTRIBUTIONS
• Numbers are recorded in a laboratory or field. These have now to be analyzed to have
meaning to a researcher. This can be done using ordered array, but further and better
understanding is achieved by grouping data . Let us look at the data below. N=60
34
12 14 15 16 17 11 16 12 13 14
14 11 10 17 10 13 14 15 16 17
18 11 13 14 15 16 11 12 13 14
14 11 12 13 14 15 10 11 12 13
15 15 17 16 16 9 18 17 20 10
11 12 14 16 18 10 9 12 13 14
37. Conti,
• Proportion falling in each class is called relative frequency(RF0. We may have
cumulative frequency as well as indicated below. Calculate CF, RF and CRF
37
38. Conti,
• The frequency distribution may also be
displayed in form of histogram. Then
frequency polygons may be drawn by joining
the midpoints of the histograms. From
frequency polygons several curves may be
developed e.g. Ogive, Normal, Bimodal and
Kurtic.
• Draw the curves above
38
39. POPULATION PARAMETERS AND SAMPLE STATISTICS
• There six reasons why we sample;
• Samples can be studied more quickly- some research requires very speedy
actions e.g. getting vaccine for an outbreak
• Samples are less expensive in terms of – money, personnel, time
• A study of entire population is at times impossible or not practical
• Sample results are usually more correct than entire population
• If samples are properly selected, probability methods can be used to
estimate the error. This is the aspect that makes us to make statements.
• Reduction of heterogeneity when samples are chosen with specified
features which will be better than going for the whole population
• NB. Bigger does not mean better in terms of samples sizes. Therefore the
investigator must plan sample size appropriately before starting research.
This is called determining the power of study.
39
40. SAMPLING METHODS
• There are two types of methods/ procedures.
1. Probability sampling techniques
• Simple random sampling- simple random sampling selects samples by methods
that allow each possible sample to have an equal probability to have an equal
chance of being included in the sample. E.g suppose we have 100 cows and
assign each numbers 00 to 99 and now systematic go down picking after every
two digits
• Systematic sampling- Elements are selected from the population at a uniform
interval that is measured in time, order or space. If we want to treat every 20th
plot in a crop field we would choose a random starting point in the first 20 plots
and then pick every 20th plot thereafter.
• Stratified sampling- In this category we divide the population in to relative
homogenous groups called strata. Then we can select at random from each
stratum a specified number of elements corresponding to the proportion of that
stratum in the population as a whole. E.g. age groups
40
41. Conti,
• Cluster sampling- Here we divide the population in to groups or clusters
and then select random sample of these clusters. We assume these
individual clusters are representatives of the population as a whole. E.g. In
looking for the average number of TV sets per household we would divide
the city in to clusters using the map of the cityu and then chose a certain
number of blocks for interviewing. Every household in each cluster would
be interviewed.
• Probability proportional to size sampling- In this sampling method we aim
at taking individuals for study in numbers proportional to the total
available in each category e.g. Lets assume we want a sample of 600
patients presenting malaria signs from four provincial hospitals, each
hospital has them at the time of study as follows. New Nyanza hos=600,
Coast general hos=200, Nyeri provincial hos=100 and Kakamega provincila
hos=300, totalling to 1200. Then how many do we take from each hos.
41
42. Conti,
• Multistage sampling- We sample at a certain level then next. E.g. Sample
the provinces to get the number you want say 3, then districts, divisions
and so on.
2. Non-probability methods
• Purposively- Quite often In research we are faced with constraints of
funds, personnel and time. E.g. If one had to study T.B in Manyattas it will
be possible to include all districts assigned but it will be impossible to
study all manyattas however from experience a particular Manyatta does
not differ from any other hence we can pick any Manyatta and study.
• Convenience sampling- In this one all the items for the study, they all have
the features you are interested in. E.g. In a study involving monkeys in
Kenya one would go to IPR. Every method used in research should be
properly explained for better understanding.
42
43. Sample size determination
• Once the researcher has determined a study and asked research questions, stated the hypothesis, clear
and achievable objective, ensured and understood the area of study, its important to determine the
sample size to use, this because the size of the sample will determine the error margin and levels of
significance.
• There are several methods of determining sample size all of which in one way or another will involve SE,
characteristic probability and Z or d values( critical values). They also involve Alfa( type one error and Beta(
type 2 error). Researchers have control of Alfa but not beta errors of type 2.
43
44. Fisher et al.,(1998)
• N= z2PqD/ d2
• Z= critical value corresponding with the desired probabiliy incase of 95%---
-0.05= 1.96 which is z
• P= characteristic probability
• q= 1-p
• D= design effect means in sciences the D will be 2 where there is
experiment with control
• d= Level of significance 0.05 or 0.01 E.g. Its know that 40% of orpan
children are HIV positive, if a researcher wants to study this population
and achieve the results at 0.01 level of significance, what sample size the
researcher would take if the population of these children in the study area
is 20000.
44
45. Conti,
• Sample size= n
• Z= 2.576
• D= 0.01
• q= 0.6 failure
• P= 0.4 success
• 2.5762 X 0.4 X 0.6/ 0.012= 15925.862 which is 15920
• The formula by fisher works when total population size is greater than
10000, however in research we might not have this big number and the
way forward is to modify the formula which is nf= n/1+n/N
• 15926/1+15926/20000=8866
45
46. Type I and II Errors and Significance Levels
• Type I Error
Rejecting the null hypothesis when it is in fact true is called a Type I error.
Many people decide, before doing a hypothesis test, on a maximum p-value
for which they will reject the null hypothesis. This value is often denoted α
(alpha) and is also called the significance level. When a hypothesis test
results in a p-value that is less than the significance level, the result of the
hypothesis test is called statistically significant.
• Type II Error
Not rejecting the null hypothesis when in fact the alternate hypothesis is
true is called a Type II error. (The second example below provides a
situation where the concept of Type II error is important.)
Note: "The alternate hypothesis" in the definition of Type II error may
refer to the alternate hypothesis in a hypothesis test, or it may refer to a
"specific" alternate hypothesis.
46
47. Student's' t Test
• Use this test to compare two small sets of quantitative data when samples are
collected independently of one another. When one randomly takes replicate
measurements from a population he/she is collecting an independent sample.
• Student's' t Test is one of the most commonly used techniques for testing a
hypothesis on the basis of a difference between sample means. Explained in
layman's terms, the t test determines a probability that two populations are the
same with respect to the variable tested.
• Thicknesses of 7 sun leaves were reported as: 150, 100, 210, 300, 200, 210, and
300, respectively. Thicknesses of 7 shade leaves were reported as 120, 125, 160,
130, 200, 170, and 200, respectively. The mean ± standard deviation for sun leaves
was 210 ± 73 micrometers and for shade leaves it was158 ± 34 micrometers. Note
that since all data were rounded to the nearest micrometer, it is inappropriate to
include decimal places in either the mean or standard deviation.
47
48. PROPOSAL WRITING
• There are many versions of proposal writing depending on the regulations of various institutions and
donors. The one given below should act as a guide only.
• TITLE- Should summarize as much as possible where, what, how you will work and should be not more
than 20 words.
• ABSTRACT- Not more than one page
• INTRODUCTION AND LITERATURE REVIEW- a)Introduction b).Literature review. Should be as recent as
possible and should be internationally accepted e.g Kithome(2014) and (Kithome 2014); Kamauet
al.,2014; Kithome et al.,(2014)
• RATIONALE OR CONCEPTIONAL BASIS a) Statement of the problem b) Research questions c) justification
• HYPOTHESIS Ho OR Ha
• OBJECTIVES a) general b)Specific
• MATERIALS AND METHODS a) Study area b) study population- Exclusion and inclusion criteria c) Study
design, d) Sampling procedure- include how you will deal with this in detail also include details of the
experiment where applicable e) Data analysis
• REFERENCES
• BUDGET
• TIME SCHEDURE
• MAP OF STUDY AREA WHERE APPLICABLE
48