This paper discusses a method for planning power distribution systems that incorporates reliability evaluation using credibility theory to address uncertainties in the power network. It highlights the complexities and challenges faced by planners in ensuring adequate capacity and reliability amidst varying failure rates and operational conditions. The study also reviews the quantitative models and indices used to assess the reliability of electrical distribution systems, emphasizing the need for improved data and methods to inform planning decisions.
![ISSN 2349-7815
International Journal of Recent Research in Electrical and Electronics Engineering (IJRREEE)
Vol. 2, Issue 3, pp: (11-19), Month: July 2015 - September 2015, Available at: www.paperpublications.org
Page | 13
Paper Publications
.
The expected squared error of „a‟ is
for z minimizes w.
⁄ .
If you set that to zero you get: , or . Then is .This makes it look like each
estimate gets a weight proportional to the expected squared error of the other. To express the weights as properties of the
estimates themselves, note that
[ ] [ ]
. This shows that each estimate gets a weight proportional to the
reciprocal of its expected squared error 1. Least squares credibility is an application of this principle.
B. Non Linear Estimation:
So far this discussion has been non-parametric. That is, the forms of the distributions have not entered in. That is the
advantage of linear estimates with squared error penalties. If you have some information about the type of distribution
available, you can give up the restriction to linear functions. In a Bayesian framework the class experience becomes the
prior distribution for the member experience, and then the Bayesian conditional expected value of the member mean
given the data is the least squares estimator of the member mean of any sort, linear or not. Feng et al (2008) in some cases
the conditional mean is a linear function of the data (e.g., normal and gamma distributions) so the linear restriction of
credibility theory does not reduce the accuracy. However in highly skewed distributions, like some lognormal cases, the
Bayes estimate is highly non-linear, and credibility weighting can give large errors for classes with small means. If the
distribution type is fairly well understood, Bayesian methods would be preferable in such cases. However, an alternative
when the member means can be very different from each other is to do the usual credibility estimation in the logs of the
data, then exponentiate the results. This introduces a downward bias, however, which has to be adjusted multiplicatively
to balance to the overall data.
C. Credibility Measure of Fuzzy Event:
A few no stochastic but uncertain phenomena in power systems can be modeled as fuzzy variables. Let be a nonempty
set, the power set of and ̃ is a fuzzy variable with the membership function ̃ . The possibility of a fuzzy
event is defined as , { } ,where is the supremum operator. The necessity measure is
defined as , { } { }, where is the complement. Obviously, and are one pair of dual measure
Baoding et al(2002).
In order to give a self-dual measure for fuzzy events, a credibility measure Cr is defined as follows
It is easy to verify that . { } { } The fuzzy event must hold if its credibility is 1, and fail if its credibility is 0.
Theorem 1: Relationship between the credibility measure and membership function
Definition: Let ̃be a fuzzy variable; then the possibility, the necessity, and the credibility of the fuzzy event Aare
expressed as follows:
{ } ̃
{ } ̃
{ } { } { }
Where ̃ is membership function of ̃.
In traditional fuzzy set theory, possibility measure is considered to be a parallel concept of probability measure. But it
does not possess self-duality: when Pos {A} = 1, fuzzy event A is not always true; when Nec{A} = 0, A may also be true.](https://image.slidesharecdn.com/reliabilitybasedpowerdistribution-383-170328064610/75/RELIABILITY-BASED-POWER-DISTRIBUTION-SYSTEMS-PLANNING-USING-CREDIBILITY-THEORY-3-2048.jpg)
![ISSN 2349-7815
International Journal of Recent Research in Electrical and Electronics Engineering (IJRREEE)
Vol. 2, Issue 3, pp: (11-19), Month: July 2015 - September 2015, Available at: www.paperpublications.org
Page | 14
Paper Publications
In order to solve this problem, Liu et al (2002). In this theory, credibility measure which corresponds to probability
measure in probability theory possesses self-duality and monotonicity – when Cr {A} = 1, fuzzy event A is inevitably
true; otherwise it is false.
III. MODELING OF FUZZY FACTORS
The component failure rate and repair time is normally used to measure the probability of failure and repair of a particular
component. While component status in the future and repair is not predictable, the failure rate ad repair time of such
component can be obtained from historical data in addition to failure rate and repair time can be modeled by triangular
fuzzy variable for failure rate is and fuzzy variable for repair time is [ ].
For failure rate
{
And repair time
{
The triangle membership function of failure rate & repair time can be easily created. The point estimate corresponds to
1.0 of the membership function grade. The significant level is always a small percentage such as 0.05 (5%). The half of α
is located at each of the two bounds in the t-distribution. Conceptually, the significant level is somewhat similar to the
fuzzy degree represented by the membership function grade since both of them reflect a subjective confidence. Therefore,
it can be assumed that the lower and higher bounds obtained from (5&6) correspond to the two points ( and ) in the
membership function that has a membership grade of (such as 0.1) With the three points of ( ), , and ,
the two linear algebraic equations in the form of can be built and the two end points (a, 0) and (b, 0) in the
membership function can be calculated. When is so small (0.025), a and should be very close and so are b and .
In other words, it is also acceptable to directly use and as the two end points of the membership function.
̆
0 (f/yr)
Fig. 1. Membership function of failure rate
Figure 1. Membership function](https://image.slidesharecdn.com/reliabilitybasedpowerdistribution-383-170328064610/75/RELIABILITY-BASED-POWER-DISTRIBUTION-SYSTEMS-PLANNING-USING-CREDIBILITY-THEORY-4-2048.jpg)
![ISSN 2349-7815
International Journal of Recent Research in Electrical and Electronics Engineering (IJRREEE)
Vol. 2, Issue 3, pp: (11-19), Month: July 2015 - September 2015, Available at: www.paperpublications.org
Page | 19
Paper Publications
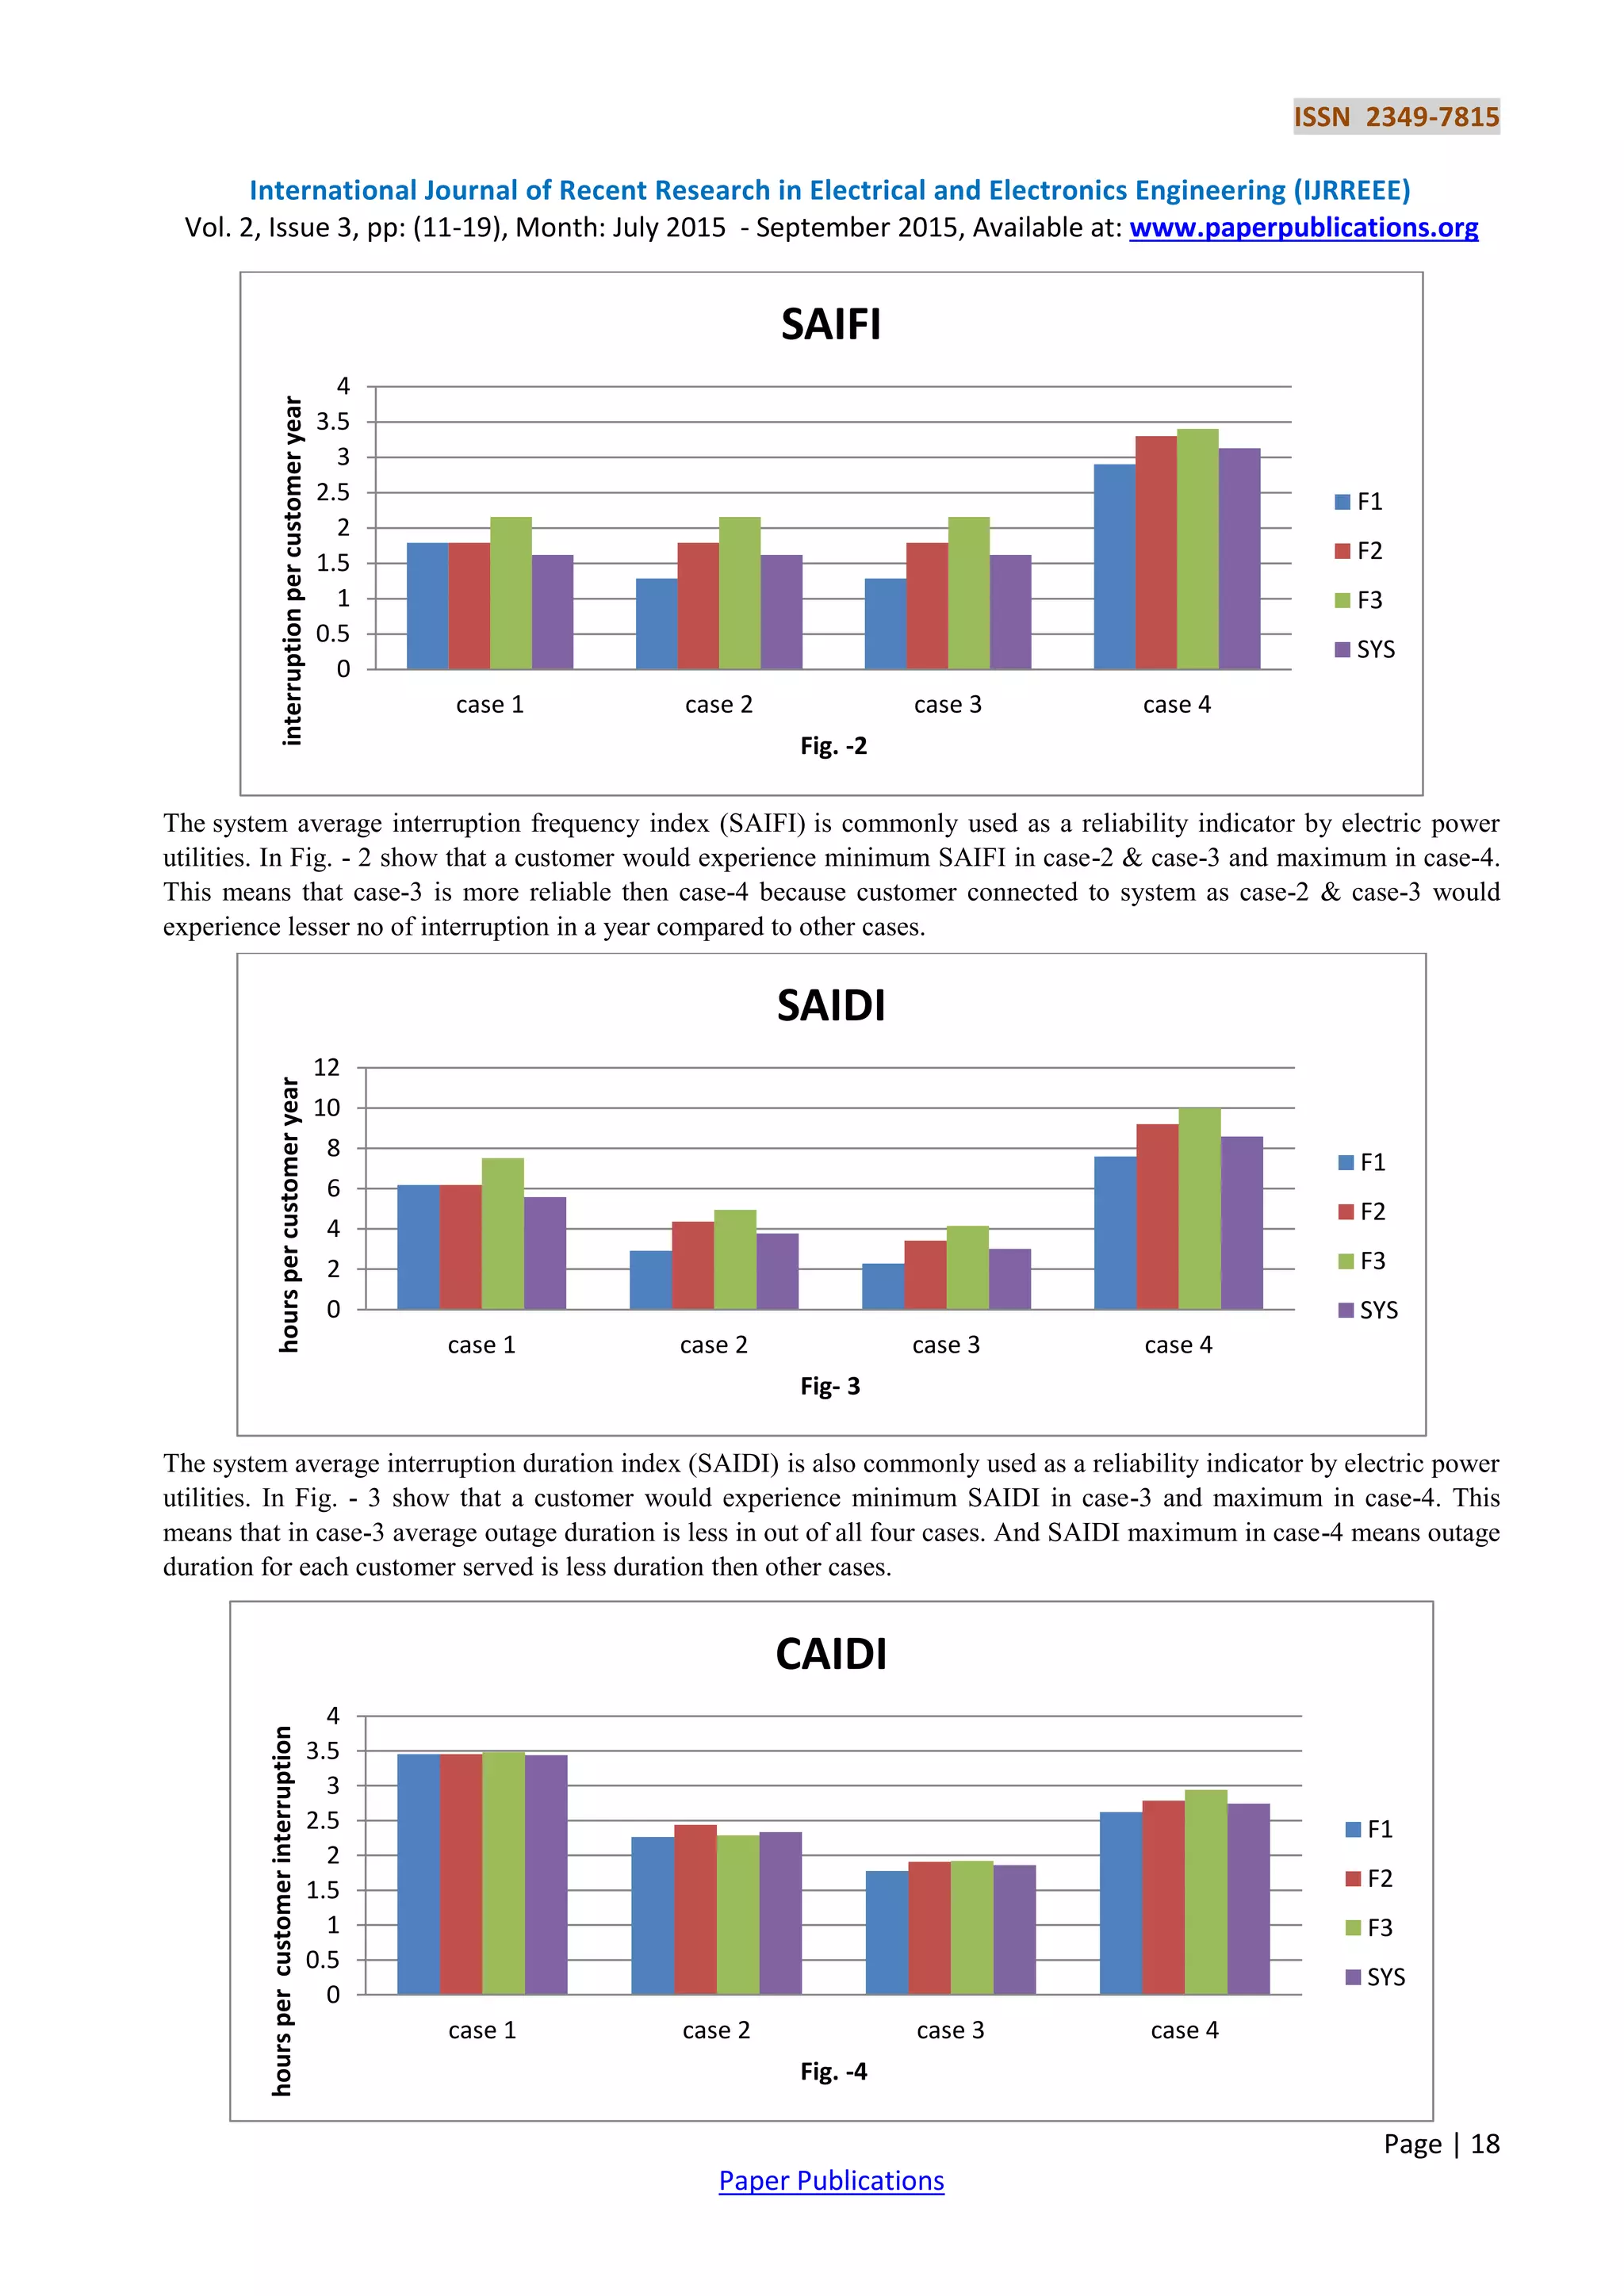
The customer average interruption duration index (CAIDI) is gives the average outage duration that any given customer
would experience. CAIDI can also be viewed as the average restoration time. In Fig-.4 shows that a customer would
experience minimum CAIDI in case-3 and maximum in case-1. The customer of case-3 would experience minimum
average restoration time/outage duration then other cases.
REFERENCES
[1] E.V. Sagar and P.V.N.Prasad, “Reliability Improvement of Radial Distribution System with Smart Grid
Technology” Proceedings of the World Congress on Engineering and Computer Science, Vol I WCECS,pag. 23-25,
2013.
[2] J. Nahman and D. Peric, “Distribution System Performance Evaluation Accounting for Data Uncertainty” IEEE
Transactions On Power Delivery, Vol. 18, No. 3, July 2003.
[3] M. F. Firuzabad, and S. Afshar, “Reliability analysis in Electrical Distribution System considering preventive
Maintenance Applications on Circuit Breakers” World Academy of Science, Engineering and Technology 25 2009.
[4] R. Billinton and J.R. Acharya, “Weather-based distribution system reliability evaluation” IEE Proc.-Gener. Transm.
Distrib., Vol. 153, No. 5, September 2006.
[5] R. Billinton, R. N. Allan, “Reliability Evaluation of Power System”, Pitman Books, New York and London, 1984.
[6] R. M. Godfrey, R. Billinton, “Guide to Value-Based Distribution Reliability Planning” Volume I, Canadian
Electricity Association, 3-46 – 3-51, 1996.
[7] R. N. Allan, R. Billinton, I. Sjarief, L. Goel and K.S. So, “A Reliability test system for educational purposes basic
distribution system data and results” IEEE transactions on power system vol.6,No,2 May 1991.
[8] R. E. Brown and J.R. Ochoa, “Distribution System Reliability:Default Data and Model Validation” IEEE
Transactions on Power Systems, Vol. 13, No. 2, May 1998.
[9] K. Suresh, Khator and C. Lawrence, Leung, “Power Distribution Planning: A Review of Models and Issues”, IEEE
Transactions on Power Systems, Vol. 12, No. 3, pp 1151-1159, August 1997.
[10] T. Lantharthong, and N. Phanthuna, “Techniques for Reliability Evaluation in Distribution System Planning” World
Academy of Science, Engineering and Technology Vol:64 27-04-2012.
[11] V. Ajodhia, “Cost Reliability and Regulation in Electricity Networks: Mapping The Issues”, IEE Power System
Management and Control. IEE, No.488, 2002.
[12] R. Rosado, J.Ignacio, and J. A. D. Navarro, “Possibilistic Model Based on Fuzzy Sets for the Multiobjective
Optimal Planning of Electric Power Distribution Networks” IEEE Transactions On Power Systems, Vol. 19, No. 4,
November 2004.
[13] R. Billinton and R. N. Allan, “Reliability Evaluation of Power Systems (2nd
Edition),” New York: Plenum. 1996.
[14] Feng Yongqing, wenchuan wu, B. Zhang, W. Li “Power System Operation Risk Assessment Using Credibility
Theory,” IEEE Transactions on Power Systems, vol. 23, no. 3, august 2008.
[15] L. Baoding and L. Yian-Kui, “Expected value of fuzzy variable and fuzzy expected value models,” IEEE Trans.
Fuzzy Syst., vol. 10, no. 4, pp. 445–450, Aug. 2002.](https://image.slidesharecdn.com/reliabilitybasedpowerdistribution-383-170328064610/75/RELIABILITY-BASED-POWER-DISTRIBUTION-SYSTEMS-PLANNING-USING-CREDIBILITY-THEORY-9-2048.jpg)