Download as PDF, PPTX
![www.yhd.com
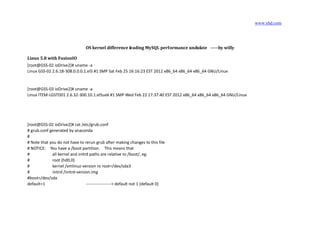
MySQL performance Tips (recently update)
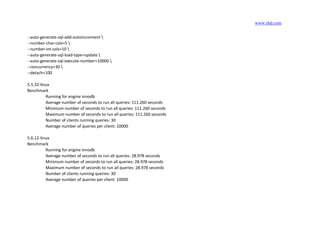
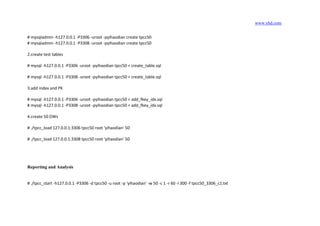
5.5.32 vs 5.6.12 MySQL performance test -----by yihaodian Tomleng.
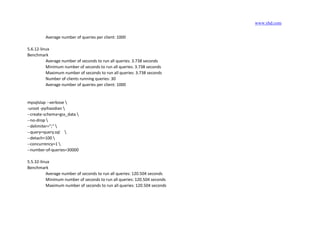
The Hardware environment:
[root@db-2-9 ~]# dmidecode -s system-product-name
PowerEdge R720xd
[root@db-2-9 ~]# cat /proc/meminfo |more
MemTotal: 65962096 kB
MemFree: 54150924 kB
[root@db-2-9 ~]# cat /proc/cpuinfo |more
processor : 0
vendor_id : GenuineIntel
cpu family : 6
model : 45
model name: Intel(R) Xeon(R) CPU E5-2620 0 @ 2.00GHz
stepping: 7
cpu MHz : 2000.059
cache size : 15360 KB](https://image.slidesharecdn.com/recentmysqlperformancedetail-130614093537-phpapp02/85/Recent-my-sql_performance-Test-detail-1-320.jpg)
![www.yhd.com
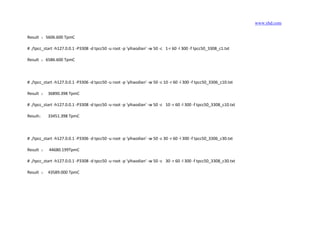
MySQL performance Tips (recently update)
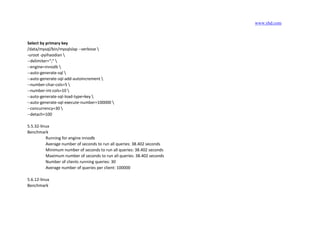
5.5.32 vs 5.6.12 MySQL performance test -----by yihaodian Tomleng.
The Hardware environment:
[root@db-2-9 ~]# dmidecode -s system-product-name
PowerEdge R720xd
[root@db-2-9 ~]# cat /proc/meminfo |more
MemTotal: 65962096 kB
MemFree: 54150924 kB
[root@db-2-9 ~]# cat /proc/cpuinfo |more
processor : 0
vendor_id : GenuineIntel
cpu family : 6
model : 45
model name: Intel(R) Xeon(R) CPU E5-2620 0 @ 2.00GHz
stepping: 7
cpu MHz : 2000.059
cache size : 15360 KB](https://image.slidesharecdn.com/recentmysqlperformancedetail-130614093537-phpapp02/75/Recent-my-sql_performance-Test-detail-1-2048.jpg)
![www.yhd.com
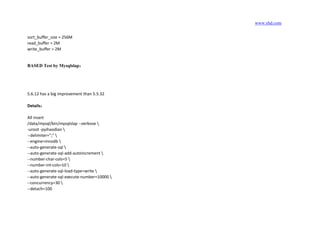
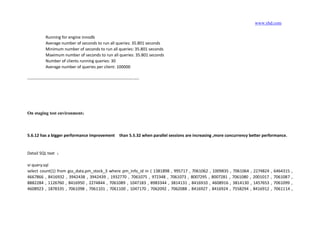
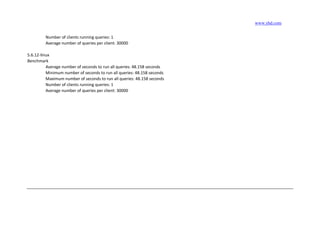
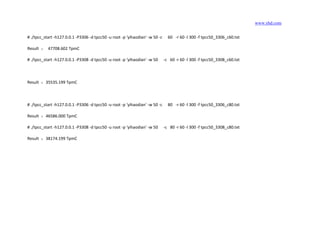
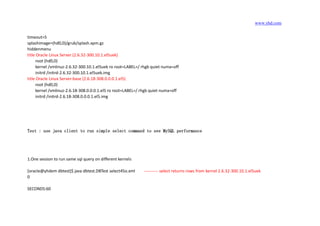
[root@db-2-9 ~]# cat /proc/cpuinfo |grep processor |wc -l
24
[root@db-2-9 ~]# cat /etc/my.cnf
[client]
port = 3306
socket = /data/mysql/data/mysql.sock
[mysql]
max_allowed_packet = 16M
default_character_set = utf8
no_auto_rehash
prompt = "R:m:s d> "
pager = "more"
[mysqld]
open_files_limit = 65535
server-id = 201
basedir = /data/mysql
datadir = /data/mysql/data
socket = /data/mysql/data/mysql.sock
port = 3306
character_set_server = utf8
skip_external_locking
max_allowed_packet = 16M
key_buffer_size = 1G
myisam_sort_buffer_size=64M](https://image.slidesharecdn.com/recentmysqlperformancedetail-130614093537-phpapp02/85/Recent-my-sql_performance-Test-detail-2-320.jpg)

![www.yhd.com
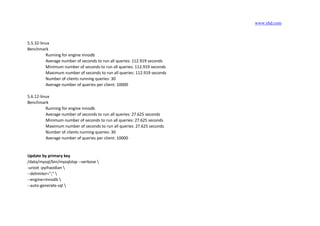
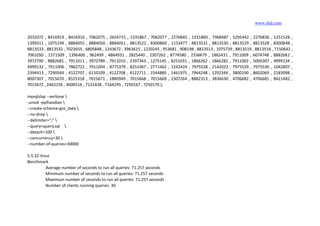
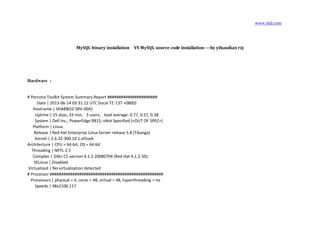
innodb_log_group_home_dir = /data/mysql/arch
innodb_log_files_in_group = 2
innodb_log_file_size = 512M
innodb_log_buffer_size = 8M
innodb_buffer_pool_size = 40G
innodb_additional_mem_pool_size = 16M
innodb_buffer_pool_instances=1
innodb_lock_wait_timeout = 100
innodb_thread_concurrency = 48
innodb_flush_log_at_trx_commit = 0
#innodb_locks_unsafe_for_binlog=1
innodb_locks_unsafe_for_binlog=0
innodb_read_io_threads=8
innodb-write-io-threads=8
innodb_io_capacity = 600
innodb_purge_threads=1
innodb_file_per_table = 1
innodb_flush_log_at_trx_commit = 1
sync_binlog = 1
lower_case_table_names=1
autocommit=1
[mysqldump]
quick
max_allowed_packet = 16M
[myisamchk]
key_buffer_size = 256M](https://image.slidesharecdn.com/recentmysqlperformancedetail-130614093537-phpapp02/85/Recent-my-sql_performance-Test-detail-4-320.jpg)
![www.yhd.com
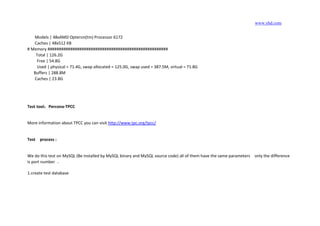
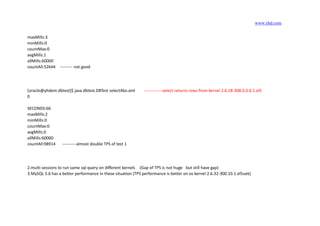
OS kernel difference leading MySQL performance undulate -----by willy
Linux 5.8 with FusionIO
[root@GSS-02 ioDrive2]# uname -a
Linux GSS-02 2.6.18-308.0.0.0.1.el5 #1 SMP Sat Feb 25 16:16:23 EST 2012 x86_64 x86_64 x86_64 GNU/Linux
[root@GSS-03 ioDrive2]# uname -a
Linux ITEM-LGSTD01 2.6.32-300.10.1.el5uek #1 SMP Wed Feb 22 17:37:40 EST 2012 x86_64 x86_64 x86_64 GNU/Linux
[root@GSS-02 ioDrive2]# cat /etc/grub.conf
# grub.conf generated by anaconda
#
# Note that you do not have to rerun grub after making changes to this file
# NOTICE: You have a /boot partition. This means that
# all kernel and initrd paths are relative to /boot/, eg.
# root (hd0,0)
# kernel /vmlinuz-version ro root=/dev/sda3
# initrd /initrd-version.img
#boot=/dev/sda
default=1 ------------------> default not 1 (default 0)](https://image.slidesharecdn.com/recentmysqlperformancedetail-130614093537-phpapp02/85/Recent-my-sql_performance-Test-detail-22-320.jpg)
![www.yhd.com
timeout=5
splashimage=(hd0,0)/grub/splash.xpm.gz
hiddenmenu
title Oracle Linux Server (2.6.32-300.10.1.el5uek)
root (hd0,0)
kernel /vmlinuz-2.6.32-300.10.1.el5uek ro root=LABEL=/ rhgb quiet numa=off
initrd /initrd-2.6.32-300.10.1.el5uek.img
title Oracle Linux Server-base (2.6.18-308.0.0.0.1.el5)
root (hd0,0)
kernel /vmlinuz-2.6.18-308.0.0.0.1.el5 ro root=LABEL=/ rhgb quiet numa=off
initrd /initrd-2.6.18-308.0.0.0.1.el5.img
Test : use java client to run simple select command to see MySQL performance
1.One session to run same sql query on different kernels
[oracle@yhdem dbtest]$ java dbtest.DBTest select45o.xml ---------- select returns rows from kernel 2.6.32-300.10.1.el5uek
0
SECONDS:60](https://image.slidesharecdn.com/recentmysqlperformancedetail-130614093537-phpapp02/85/Recent-my-sql_performance-Test-detail-23-320.jpg)
![www.yhd.com
maxMills:3
minMills:0
countMax:0
avgMills:1
allMills:60000
countAll:52644 --------- not good
[oracle@yhdem dbtest]$ java dbtest.DBTest select46o.xml -------------select returns rows from kernel 2.6.18-308.0.0.0.1.el5
0
SECONDS:60
maxMills:2
minMills:0
countMax:0
avgMills:0
allMills:60000
countAll:98914 ----------almost double TPS of test 1
2.multi sessions to run same sql query on different kernels (Gap of TPS is not huge but still have gap)
3.MySQL 5.6 has a better performance in these situation (TPS performance is better on os kernel 2.6.32-300.10.1.el5uek)](https://image.slidesharecdn.com/recentmysqlperformancedetail-130614093537-phpapp02/85/Recent-my-sql_performance-Test-detail-24-320.jpg)


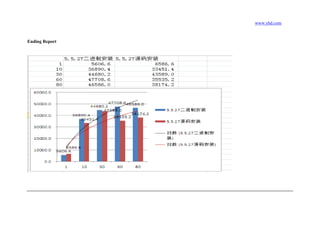
The document compares the performance of MySQL installed from binary versus from source code on a Dell PowerEdge R815 server with 4 CPUs and 48 cores. TPCC tests were run against both installations using the same parameters except for port number. The source code installation outperformed the binary installation, achieving 6586.6 transactions per minute versus 5606.6 transactions per minute for the binary installation in a test with 1 client and 50 warehouses over 60 seconds.