Download to read offline
![International Journal of Computer Science, Engineering and Applications (IJCSEA) Vol.2, No.1, February 2012
DOI : 10.5121/ijcsea.2012.2106 55
REAL TIME WEB BASED SYSTEM FOR OBSERVING
SAG AT SUBSTATION
Sangeeta Kambojଵ
and Dr. Ratna Dahiyaଶ
1
Research Scholar, National Institute of Technology Kurukshetra - 136119, Haryana,
India
http://www.nitkkr.ac.in/
2
Faculty, National Institute of Technology Kurukshetra- 136119, Haryana, India
http://www.nitkkr.ac.in/
ABSTRACT
The paper describes the designing of web based system for transmission of GPS measurements so that
power system operator may monitor overhead conductor sag of power transmission line at substation in
real time. The testing results of transmission of GPS measurements from 11KV power transmission line to
substation have also been discussed in detail. Raw GPS measurements are not so accurate that these are
usable for overhead conductor sag evaluation. The estimated GPS altitude measurements obtained using
signal processing techniques such as Least Square Parameter Estimation(LSPE) and Haar Wavelet
Transform (HWT) with LSPE are also presented in this paper.
KEYWORDS
GPS, LSPE method, Wavelet Analysis, Web Server, Overhead conductor sag, NMEA0183.
I. INTRODUCTION
GPS is satellite based radio positioning and navigation system. It provides position in three
dimension and time information to users worldwide with twenty four hours a day [2]. It was
declared operational for civilian users in December 1993. The developments in applications of
GPS over last 10 years have done at higher rate than advancements in realization of GPS
constellation. It is maintained by the United States government and every user can freely access
this with a GPS receiver. According to W. Wooden, the detailed definition of GPS is “The
Navstar GPS is an all-weather, space based navigation system under development by the
Department of Defense to satisfy the requirements for the military forces to accurately determine
their position, velocity, and time in common reference system, anywhere on or near earth on a
continuous basis”. A GPS receiver calculates its position by precisely timing the signals sent by
GPS satellites. There may be visible more than four satellites but only four satellites are used in
position calculation of GPS receiver [3, 9].The application market for vehicular tracking and](https://image.slidesharecdn.com/2112ijcsea06-180626115827/75/REAL-TIME-WEB-BASED-SYSTEM-FOR-OBSERVING-SAG-AT-SUBSTATION-1-2048.jpg)
![International Journal of Computer Science, Engineering and Applications (IJCSEA) Vol.2, No.1, February 2012
56
monitoring, digital video processing, recording and transmission is nowadays considered one of
the most promising in the security area [8]. Tracking systems were first developed for the
shipping industry because they wanted to determine where each vehicle was at any given time.
But nowadays Automatic Vehicle Location system has been used which transmit the vehicle
location information in real time. Real time vehicular tracking system incorporates a hardware
device installed in the vehicle and a remote Tracking server [7]. The ability of GPS Technology
to provide time synchronization in order of nanoseconds over wide area has opened up the usage
of GPS in electric power systems for its reliable and secure operation [5, 6].
The most concerned issue about GPS application in measurement of overhead conductor sag is
its accuracy. There are several factors that affect the accuracy of GPS [4]. Various signal
processing techniques such as LSPE method and HWT with LSPE to improve accuracy of GPS
measurements are used in the paper. In the paper test system for GPS data transmission to Web
Server at 66KV Grid Substation Idgah, sector6, Faridabad has been designed. The testing results
of GPS data transmission from pole of overhead conductor of 11KV Public Health Feeder, sector
6, Faridabad to substation for sag measurement are also shown in the paper.
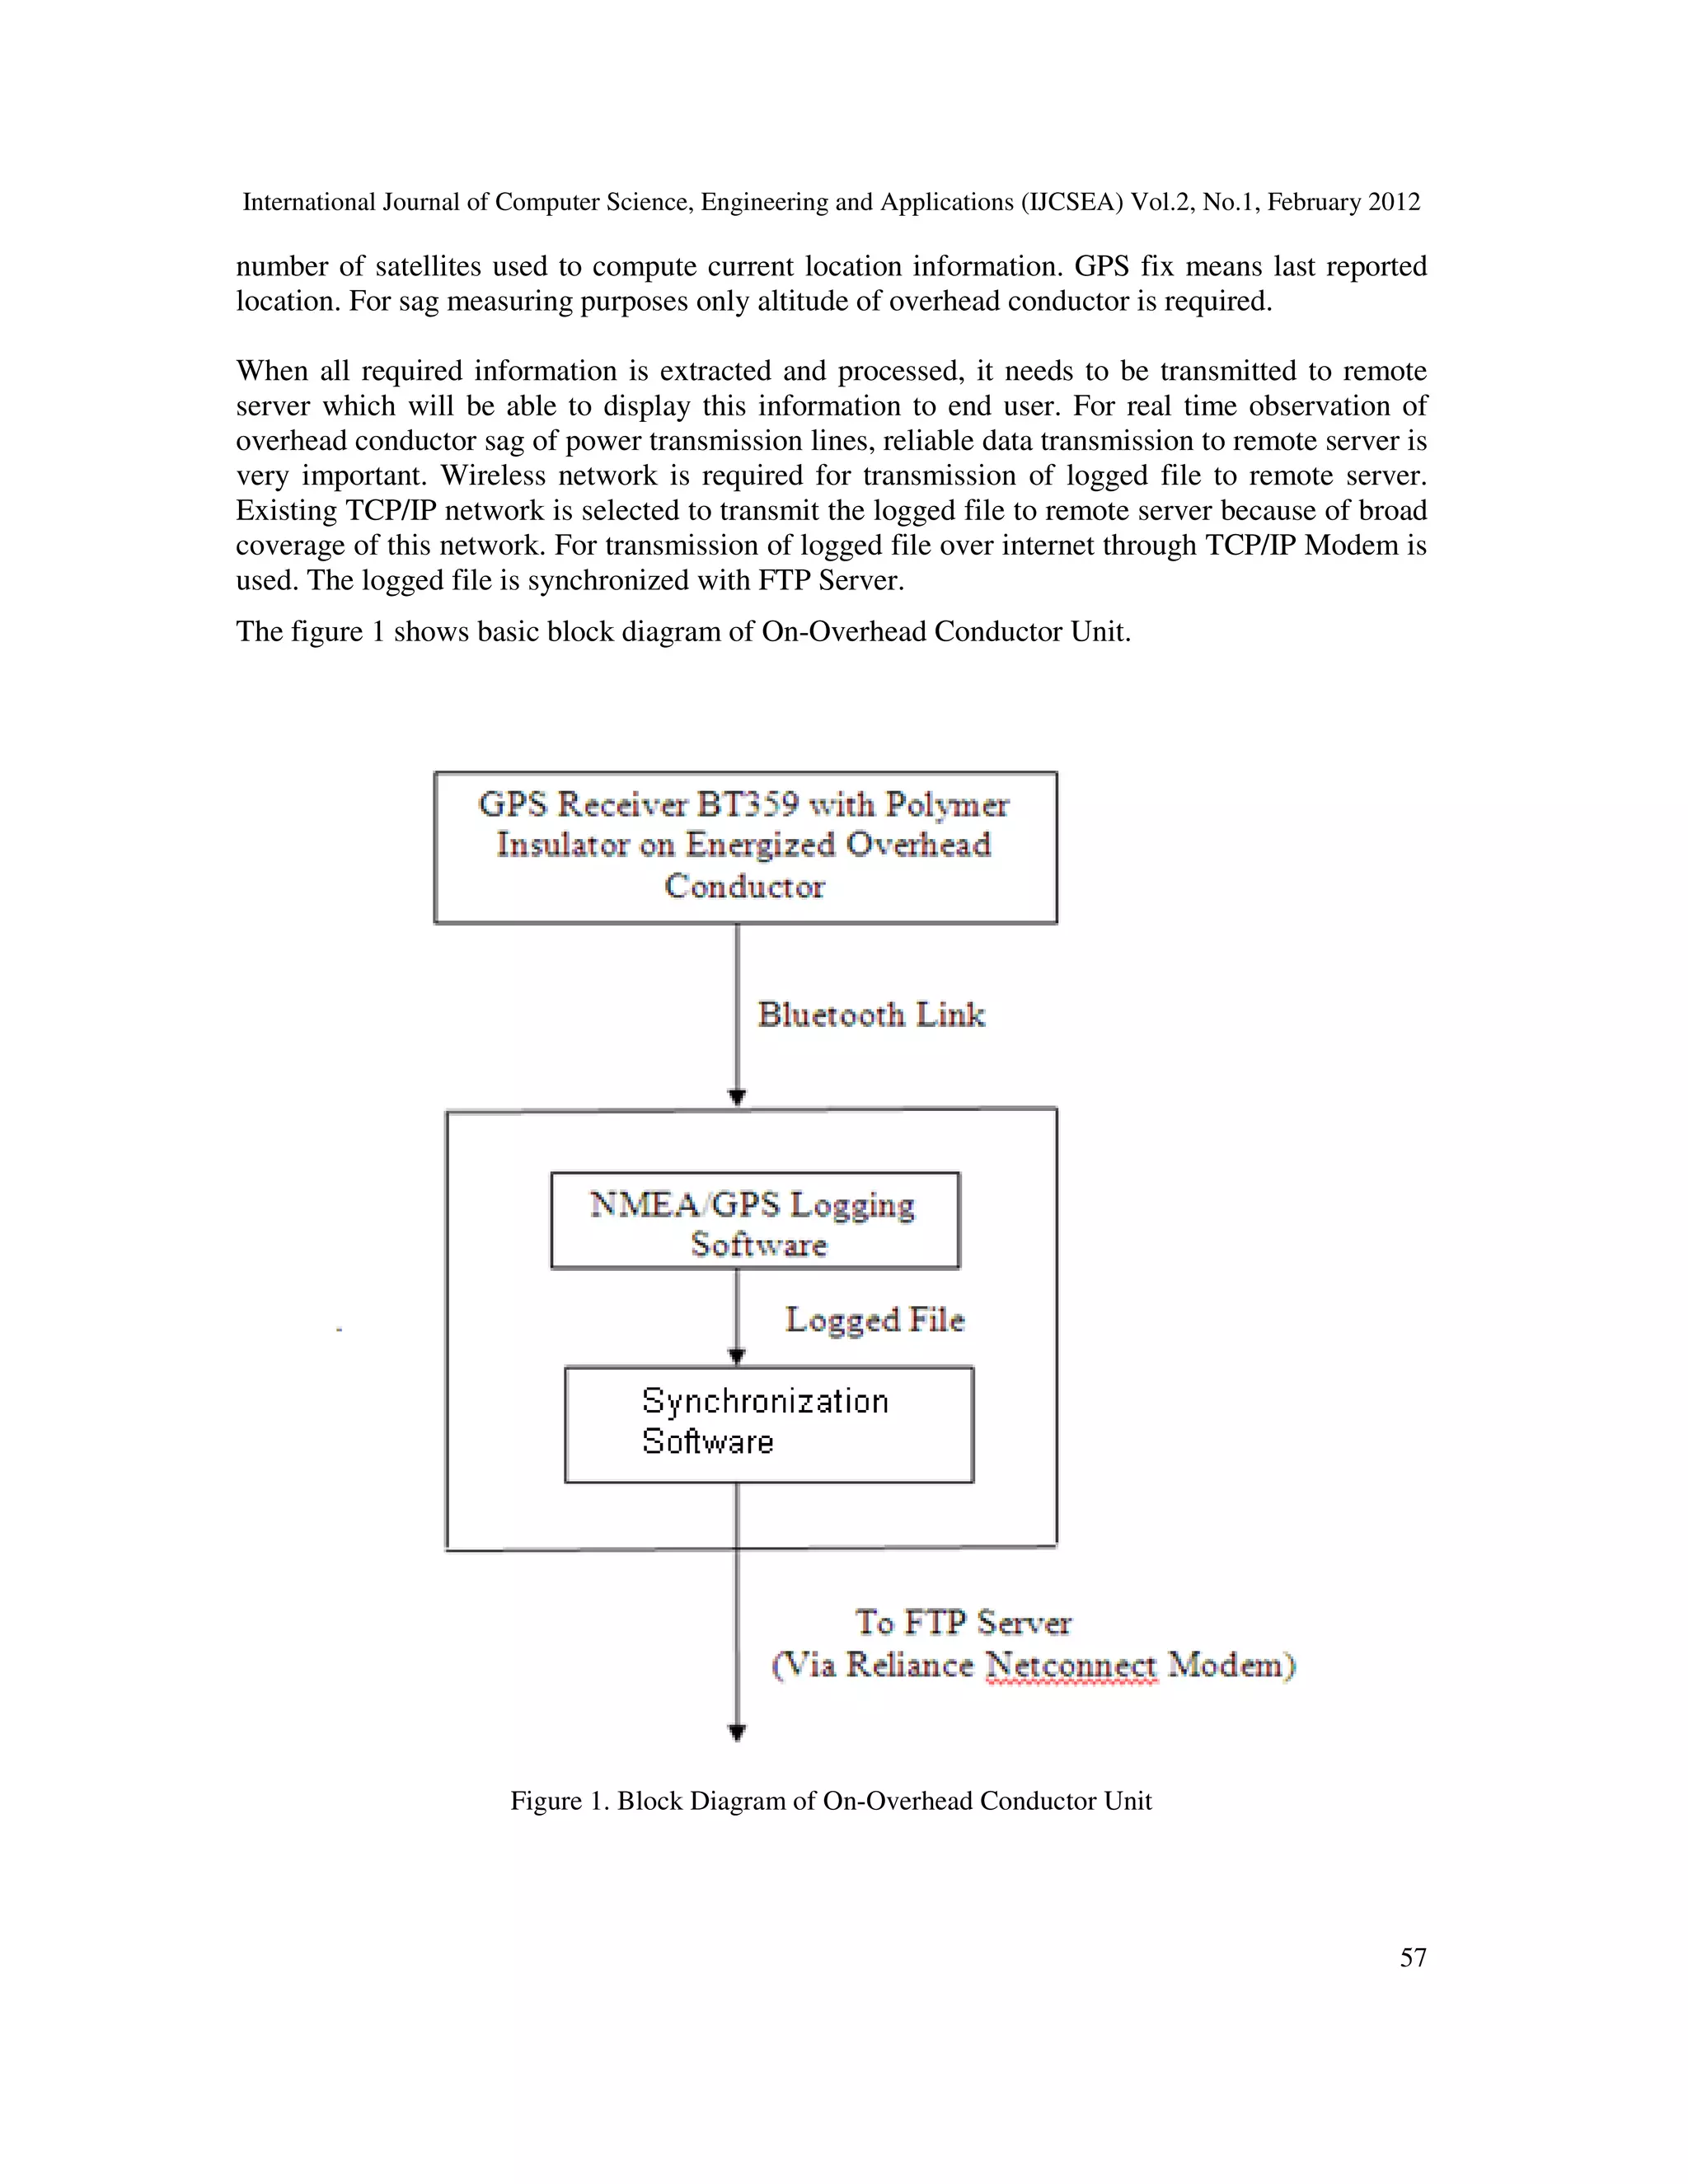
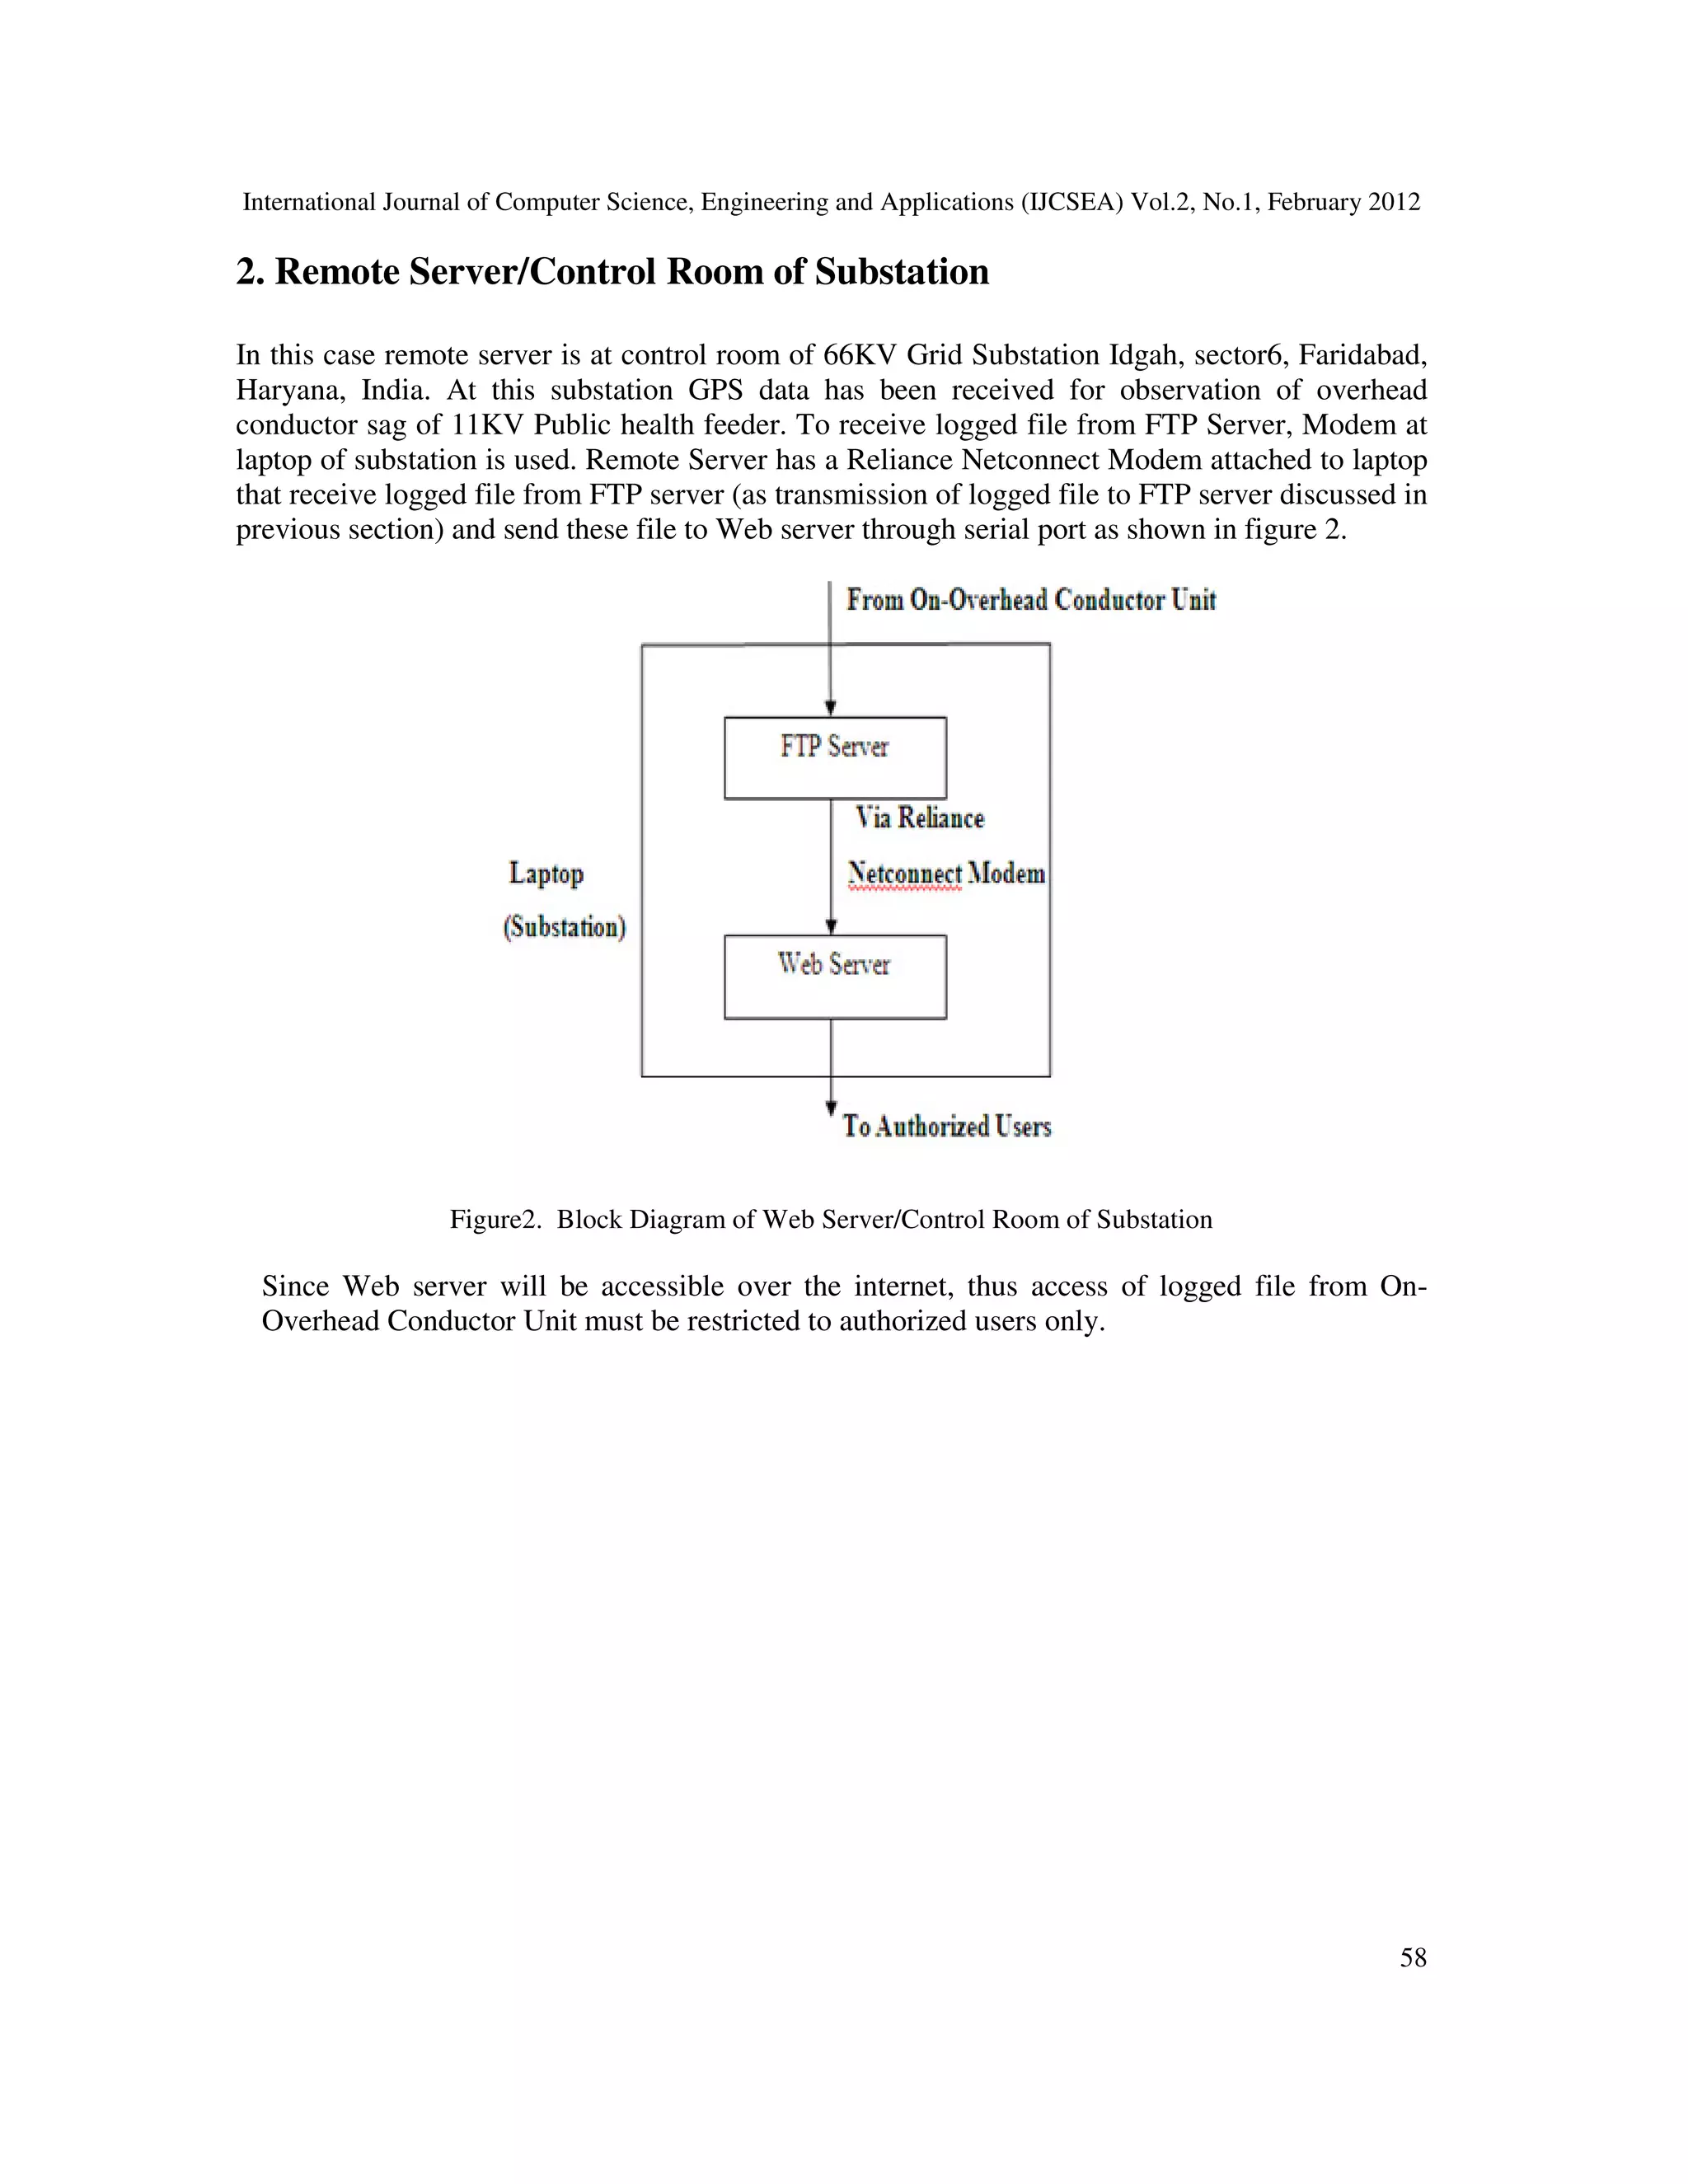
II. WEB BASED SYSTEM DESIGN AND IMPLEMENTATION
The overhead conductor position is determined using GPS and transmission mechanism could be
a satellite, terrestrial radio or cellular connection from overhead conductor to a radio receiver,
satellite or nearby cell tower of power substation. The main aim of the transmission of GPS data
from overhead conductor to remotely located server is as follows:
• Exploring GPS based sag observation at substation for monitoring purposes.
• Designing System for GPS data transmission through TCP/IP with following features.
• Acquisition of overhead conductor’s position in terms of latitude, longitude and altitude
after specified interval of time at control room of substation.
• Transmission of GPS data provided by GPS receiver to be placed on overhead conductor
to Web Server so that authorized users can access the GPS data via website over the
internet.
Overall Web Based System is partitioned into two major design units:
1. On-Overhead Conductor Unit
2. Remote Server/Control Room of Substation
1. On-Overhead Conductor Unit
This is major part of the system. It is responsible for acquiring the current position of overhead
conductor (latitude, longitude and altitude). This unit is also responsible for transmitting the
current position of overhead conductor to Web Server located anywhere in the world. The current
position of overhead conductor provided by GPS receiver needs to be processed using any GPS
logging software. Thus current position of overhead conductor provided by GPS receiver is
transferred to NMEA/GPS logger software through serial interface via Bluetooth link. GPS
receiver can also provide other information such as time of GPS fix, status of GPS fix and](https://image.slidesharecdn.com/2112ijcsea06-180626115827/75/REAL-TIME-WEB-BASED-SYSTEM-FOR-OBSERVING-SAG-AT-SUBSTATION-2-2048.jpg)
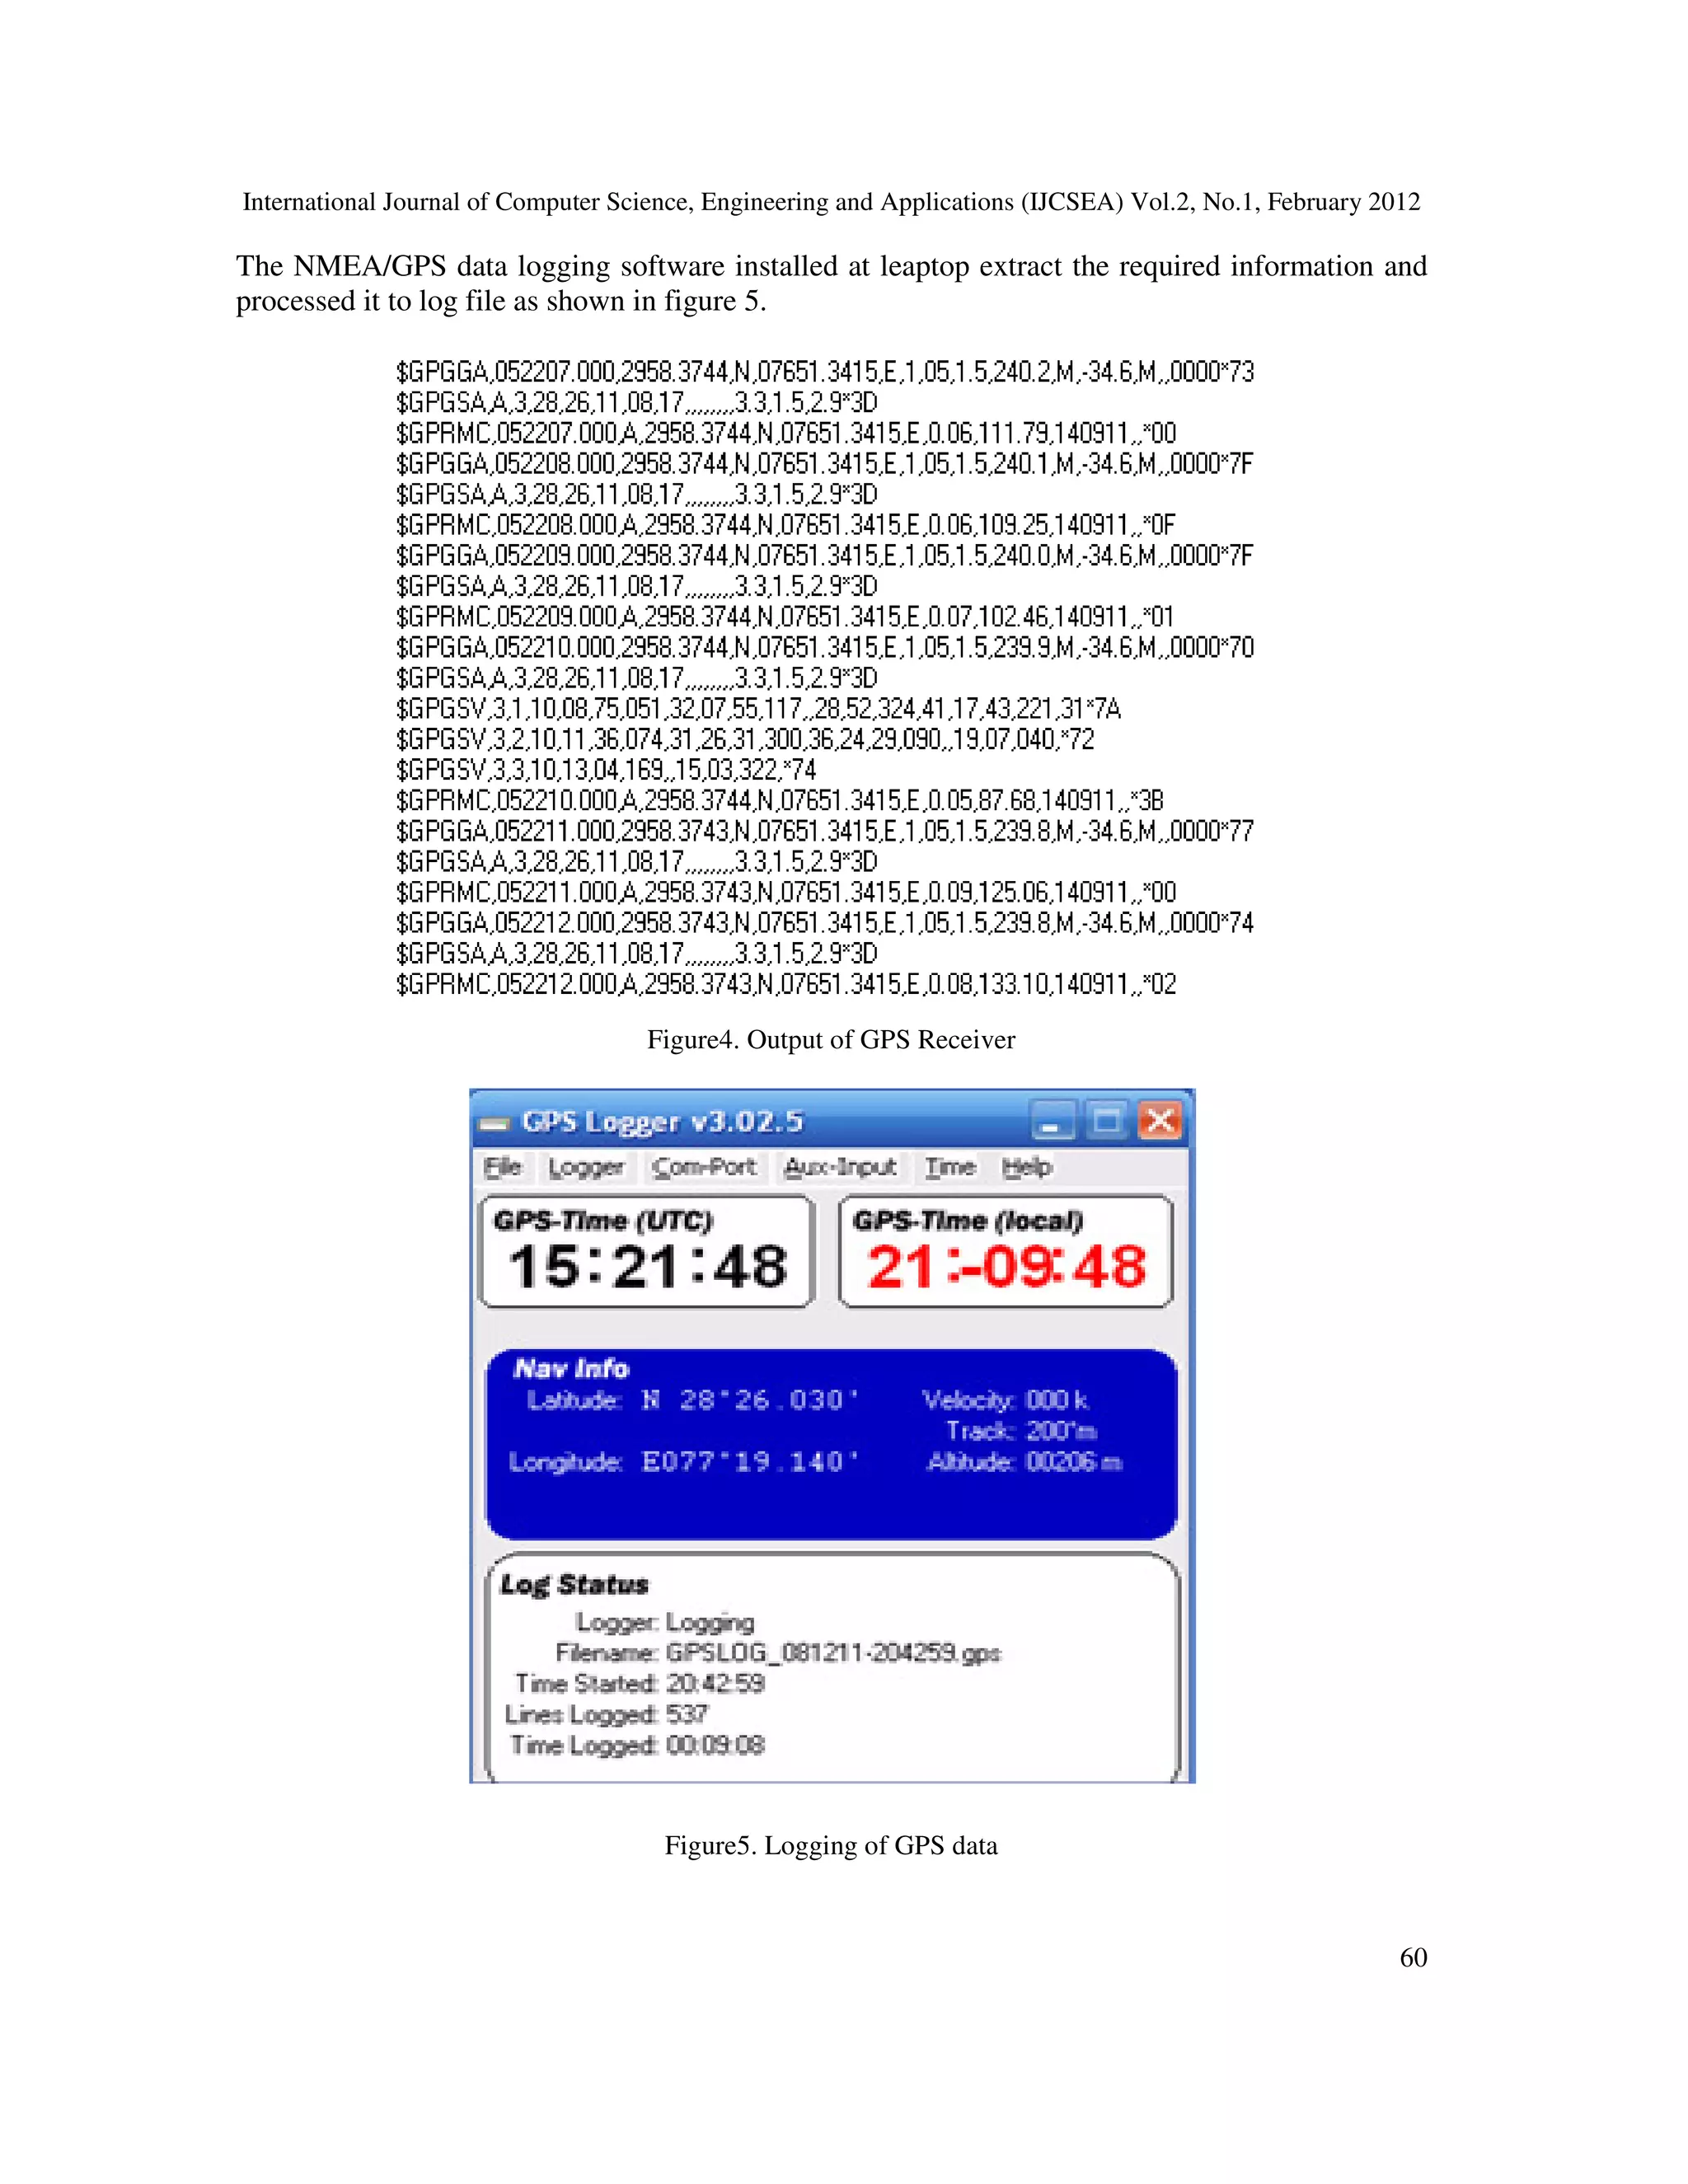
![International Journal of Computer Science, Engineering and Applications (IJCSEA) Vol.2, No.1, February 2012
63
Figure9. Raw GPS altitude measurements at Pole
B. Processing of Altitude measurements obtained using GPS
In the raw altitude measurements obtained using GPS as shown in figure 9 error has been
experienced with respect to its physical measured altitude of conductor. The error in altitude
measurements obtained using GPS has been reduced with various signal processing techniques
such as LSPE method and HWT with LSPE method [10]. As raw GPS altitude measurements has
been processed using LSPE method, error in raw altitude measurements obtained using GPS has
been reduced to greater extent. The figure10 depicts processed altitude measurements of
conductor obtained using GPS resulting from LSPE method at pole. It has been observed that an
maximum absolute error of 6.1m in raw altitude measurements obtained using GPS technique has
been reduced to error of 0.2m after using LSPE method . It can be seen from figure 10. Also it
can be observed from figure 10 that the estimated altitude measurements obtained using GPS
resulting from LSPE method doesn’t very much close to physical measured altitude of
conductor. This could be due to further error in estimated altitude measurements obtained using
GPS resulting from LSPE method.](https://image.slidesharecdn.com/2112ijcsea06-180626115827/75/REAL-TIME-WEB-BASED-SYSTEM-FOR-OBSERVING-SAG-AT-SUBSTATION-9-2048.jpg)
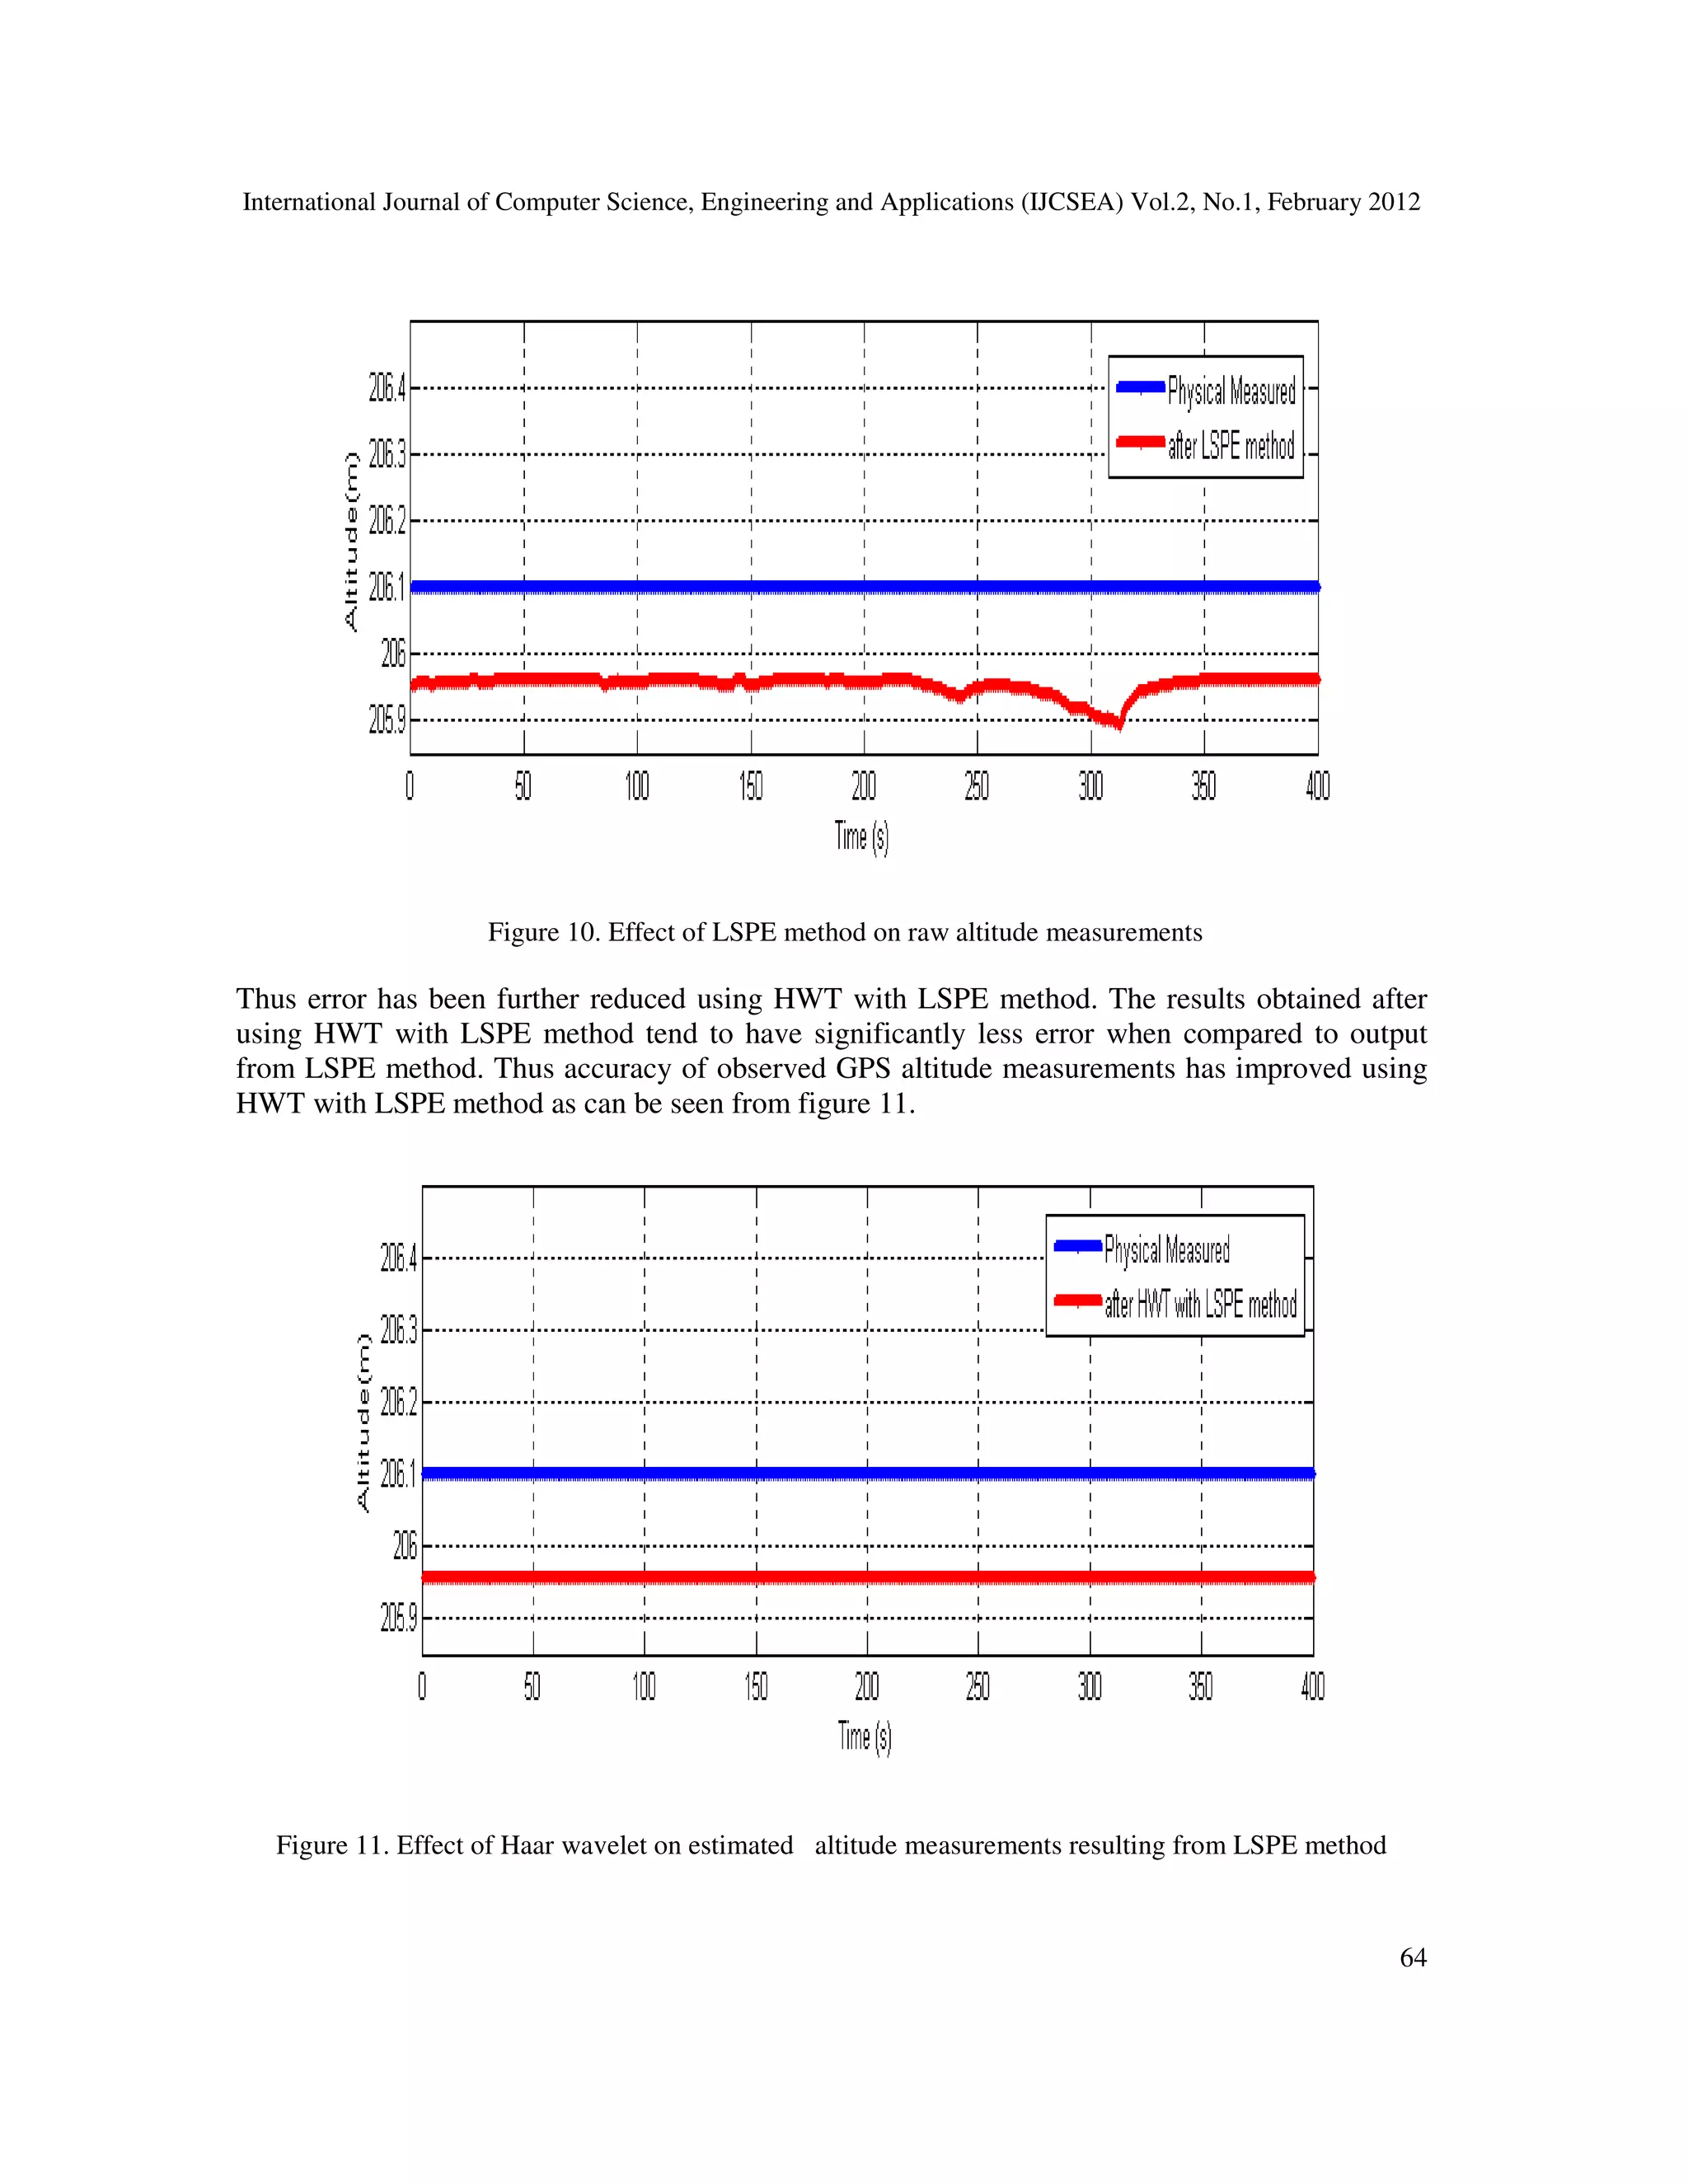
![International Journal of Computer Science, Engineering and Applications (IJCSEA) Vol.2, No.1, February 2012
65
Thus use of Wavelet analysis to further reduce errors in estimated GPS altitude measurements
resulting from LSPE method gives better accuracy of raw GPS altitude measurements taken for
overhead conductor sag measurement in power line.
V. CONCLUSION
It can be concluded that Web based system may be used for online overhead conductor sag
measurement of power transmission line using GPS at substation. It is concluded from the test
results that user can access GPS data transmitted using TCP/IP for overhead conductor sag
measurement at anywhere in the world using internet connection. The LSPE and HWT with
LSPE method have been used to improve accuracy of GPS altitude measurements. These
methods reduce error significantly. Better results are found using HWT method if it is used to
process estimated GPS altitude measurements resulting from LSPE method. The DGPS receiver
may also be used to get better accuracy as compared to handheld GPS receiver.
ACKNOWLEDGEMENT
We acknowledge the cooperation of Assistant Executive Engineer Hansraj, HVPNL, Faridabad,
Haryana, India to carry out work.
REFERENCES
[1] Chris Mensah – Bonsu, Ubaldo Fernandez Krekeler, Gerald Thomas Heydt, Yuri Hoverson, John
Schilleci, Baj. A. Agarwal, “Application of the Global Positioning System to the Measurement of
Overhead Power Transmission Conductor Sag”, IEEE Transactions on Power Delivery, Vol. 17, No.
1. pp 273 – 278, January 2002.
[2] Peter H.Dana, “Global Positioning System(GPS) Time Dissemination for Real Time applications”,
Real Time Systems, pp 9-46, 1997.
[3] T. Pratt, C. Bostain, J. Allnutt, Satellite communication, Singapore: John Wiley & Sons, 2005.
[4] “Introduction to the Global Positioning System for GIS and TRAVERSE”, Corvallis
Microtechnology, Inc. 413 S.W. Jefferson Avenue Corvallis, U.S. Publication, June, 1996.
[5] B. J. Cory, P. F. Gale, "Satellites for Power System Applications”, IEE Power Engineering Journal,
Vol. 7, No. 5, October 1993.
[6] Z. Q. Bo, G. Weller, F. Jiang, Q. X. Yang, “Application of GPS Based Fault Location Scheme for
Distribution System”, POWERCON, Vol. 1, pp. 53-57, 1998.
[7] Muruganandham, P.R.Mukesh, “Real Time Web based Vehicle Tracking using GPS”, World
Academy of Science, Engineering and Technology, 2010.
[8] Alberto J., “VideoMon Mobile – Vehicle Monitoring System Based On Video, GPS, GSM/GPRS/3G
AND GOOGLE MAPS”, Patent PI0605735-7A2,17 November 2006.
[9] S.Kamboj, R.Dahiya, “Real Time Sag Measurement of Overhead Conductor for 11KV Power Line
using Global Positioning system”,IJSAT,Vol.1,No.3,May2011.
[10] S. Kamboj, R. Dahiya, “Evaluation of DTLR of Power Distribution Line from Sag Measured using
GPS”, IEEE conference, ICEAS, 28-30Dec. 2011, Bhuneshwar, India.](https://image.slidesharecdn.com/2112ijcsea06-180626115827/75/REAL-TIME-WEB-BASED-SYSTEM-FOR-OBSERVING-SAG-AT-SUBSTATION-11-2048.jpg)

The paper presents a web-based system designed for real-time monitoring of overhead conductor sag in power transmission lines using GPS measurements. It explores the transmission of GPS data to a remote server and employs signal processing techniques, such as least square parameter estimation (LSPE) and Haar wavelet transform (HWT), to enhance accuracy. Test results show significant improvements in measurement accuracy, allowing users to access GPS data remotely for effective monitoring.