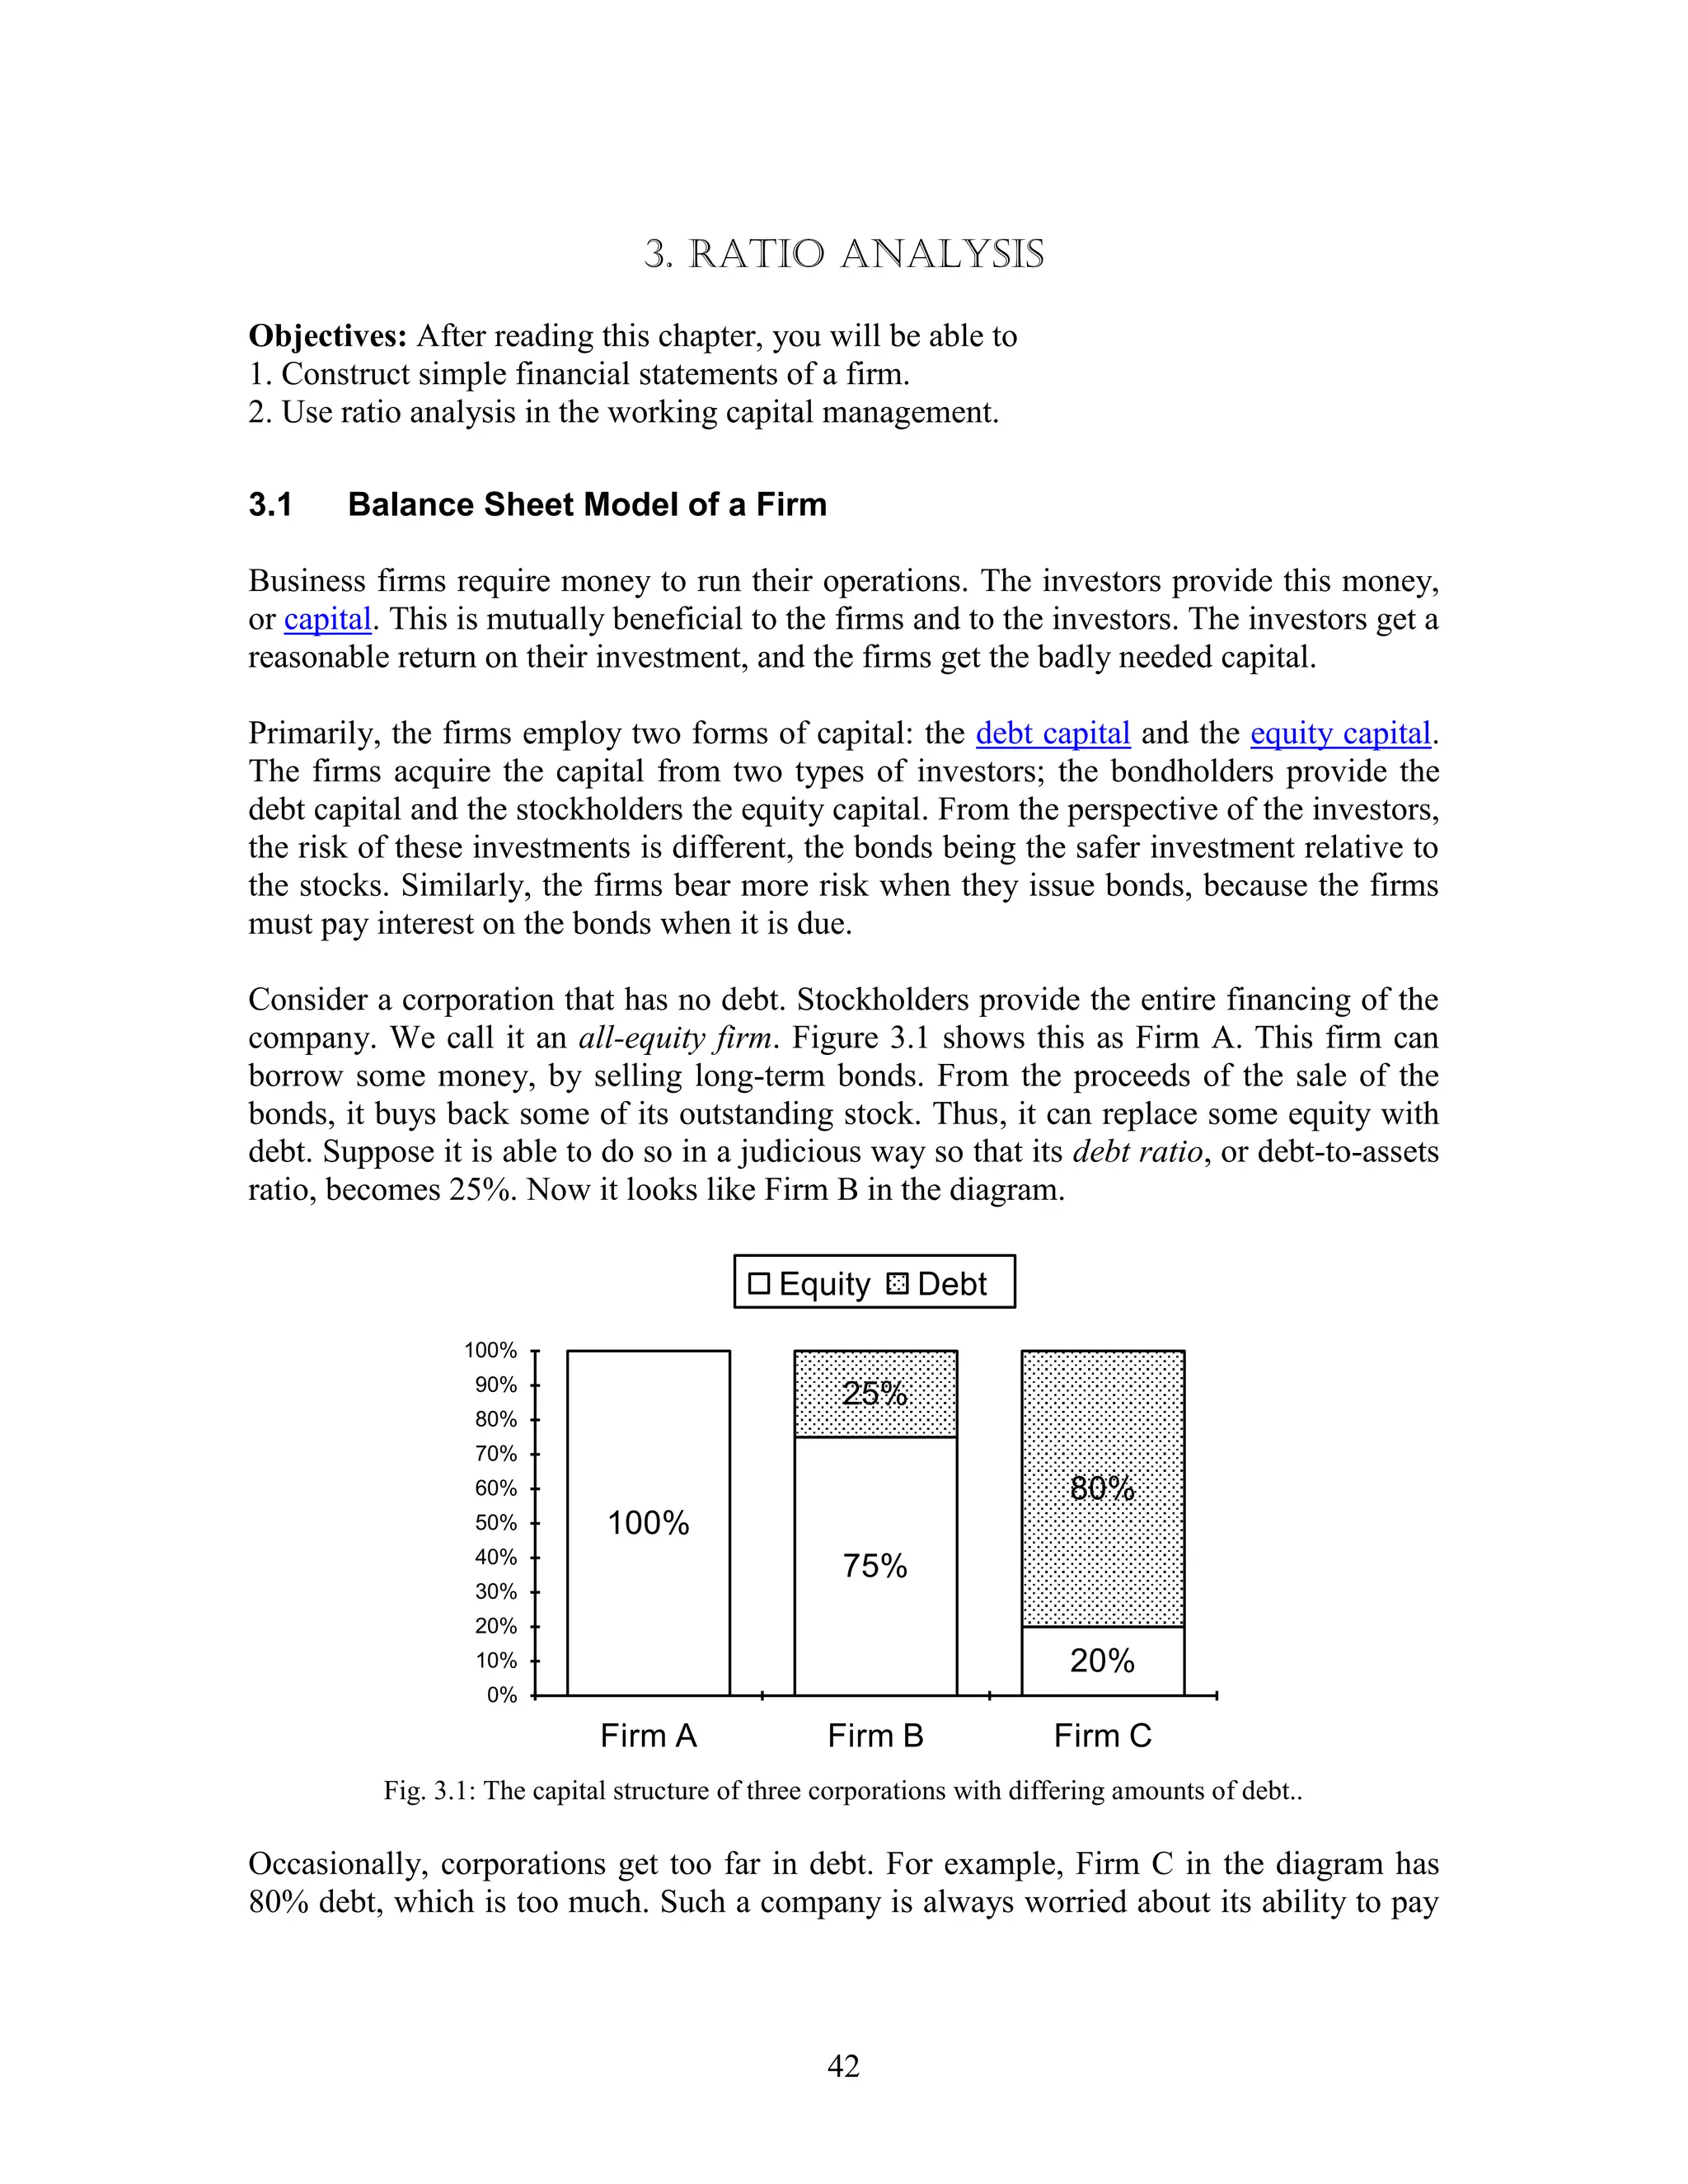
Ratio analysis advantages and limitations (Complete Chapter)Syed Mahmood Ali
The aim of this PPT's to provide complete knowledge of Ratio Analysis chapter covering all the formula's for any university student of B.com, M.com, BBA and MBA.
Ratio analysis advantages and limitations (Complete Chapter)Syed Mahmood Ali
The aim of this PPT's to provide complete knowledge of Ratio Analysis chapter covering all the formula's for any university student of B.com, M.com, BBA and MBA.
Ratio Analysis is a part of Financial Statement Analysis that is used to obtain a quick indication of a firm's financial performance in several key areas.
Liquidity ratios
Activity ratios
Solvency ratios
Profitability ratios
It is an analysis of strength and weakness of an organisation by establishing the quantitative relation among the items of Balance Sheet or Income Statement of such an organisation
Ratio: It is the quantitative relation between two amounts showing the number of times one value contains or is contained within the other.
Accounting Ratio: It means ratio calculated on the basis of accounting information.
Ratio analysis: A ratio analysis is a quantitative analysis of information contained in a company's financial statements. Ratio analysis is used to evaluate various aspects of a company's operating and financial performance such as its efficiency, liquidity, profitability and solvency.
Ratios are categorized into following basic categories:
1. Liquidity Ratios
2. Solvency Ratios
3. Activity or Turnover Ratios
4. Profitability Ratios
Accounting Principle 6th Edition Weygandt Test BankGaybestsarae
Full download : https://alibabadownload.com/product/accounting-principle-6th-edition-weygandt-test-bank/ Accounting Principle 6th Edition Weygandt Test Bank , Accounting Principle,Weygandt,6th Edition,Test Bank
Complete a 2-part assignment in which you classify cash inflows ChantellPantoja184
Complete a 2-part assignment in which you classify cash inflows and outflows and prepare a cash flow statement.
The balance sheet and income statement do not necessarily show a complete picture of the financial condition of an organization. In most organizations cash is king, and without a sizable amount of cash, an organization can become insolvent (that is, not having enough ready cash to meet its current obligations or purchase merchandise or materials). When this happens, creditors, bankers, and other external stakeholders (people and organizations that have a vested interest in the survival of a business) might become impatient and force the business into bankruptcy.
By successfully completing this assignment , you will demonstrate your proficiency in the following course competencies and assessment criteria:
Competency 1: Define accounting and its application to accounting principles.
Analyze accounting data to classify cash inflow and outflows.
Competency 2: Apply accounting cycle strategies to manage business financial events.
Apply the appropriate activity for each business transaction.
Competency 3: Prepare financial statements from accounting system data.
Prepare a cash flow statement using appropriate financial data.
This assignment includes two parts. Complete both parts using the templates provided. Both templates are linked in the Resources under the Required Resources heading. Submit both completed templates for the assignment .
Part 1: Types of Cash Inflows and Outflows
You know that the cash flow statement classifies cash receipts and cash payments as operating, investing, and financing activities. Before preparing the cash flow statement, accounting data must be analyzed to locate transactions in both the cash account and other locations. After the transactions have been located, it should be determined whether each one affects operating, investing, or financing cash flow. Last, whether the transaction results in a cash inflow or outflow must be ascertained. Accountants consider this statement to be foundational for a business to continuously operate.
For this part of the assessment, use the Assessment 3, Part 1 Template to classify each of the following cash inflows and outflows as operating, investing, or financing activities:
Sale of a piece of company equipment.
Sale of common stock.
Payment to suppliers for merchandise purchased.
Payment to lenders for interest on note payable.
Sale of investments in other companies.
Purchase of land to expand plant size.
Payment to stockholders as cash dividends.
Sale of goods or services.
Payment to employees for wages and salaries.
Lending of money to other business entities.
Payment to government for property and income taxes.
Collection of principal on loans to other entities.
Interest and dividends received.
Issue of bonds to support company growth.
Purchase of investments in debt or equity of other entities.
Payment to other ...
Equity in Accounting: Meaning, Types, & Practical Examples | Academy Tax4wealth Academy Tax4wealth
The value of equity can be determined through the current share price or a valuation established by professionals or investors. Enroll now, and make your career.
For more information, visit us at:-
https://academy.tax4wealth.com/blog/what-is-equity-in-accounting
Financial accounting & analysis nmims latest solved assignmentssmumbahelp
Dear students get fully solved assignments
Send your semester & Specialization name to our mail id :
help.mbaassignments@gmail.com
or
Call us at : 08263069601
Balance sheetBalance sheet provides a basis for computing rate of .pdfanupambedcovers
Balance sheet
Balance sheet provides a basis for computing rate of return & evaluating the capital structure of
the enterprise. It also helps users to assess a company’s liquidity, solvency & financial
flexibility.The balance sheet provides information about the nature and amounts of investments
in enterprise resources, obligations to enterprise creditors, and the owners’equity in net enterprise
resources. That information not only complements information about the components of income,
but also contributes to financial reporting by providing a basis for (1) computing rates of return,
(2) evaluating the capital structure of the enterprise, and (3) assessing the liquidity and financial
flexibility of the enterprise.
Solvency: It refers to the ability of an enterprise to pay its debts as they mature.
Current assets and liability of the company helps the users to assess the company’ solvency.
Liquidity: Liquidity of the company will be assessing through the amount of time that is
expected to elapse until an assets is converted to cash or liability has to be paid.
Financial Flexibility: Financial flexibility is the ability of an enterprise to take necessary
actions to change the amount and timing of cash flows. An enterprise with a high degree of
financial flexibility is better able to survive bad times, to recover from unexpected setbacks, and
to take advantage of profitable and unexpected investment opportunities. Generally, the greater
the financial flexibility, the lower the risk of enterprise failure.
Solution
Balance sheet
Balance sheet provides a basis for computing rate of return & evaluating the capital structure of
the enterprise. It also helps users to assess a company’s liquidity, solvency & financial
flexibility.The balance sheet provides information about the nature and amounts of investments
in enterprise resources, obligations to enterprise creditors, and the owners’equity in net enterprise
resources. That information not only complements information about the components of income,
but also contributes to financial reporting by providing a basis for (1) computing rates of return,
(2) evaluating the capital structure of the enterprise, and (3) assessing the liquidity and financial
flexibility of the enterprise.
Solvency: It refers to the ability of an enterprise to pay its debts as they mature.
Current assets and liability of the company helps the users to assess the company’ solvency.
Liquidity: Liquidity of the company will be assessing through the amount of time that is
expected to elapse until an assets is converted to cash or liability has to be paid.
Financial Flexibility: Financial flexibility is the ability of an enterprise to take necessary
actions to change the amount and timing of cash flows. An enterprise with a high degree of
financial flexibility is better able to survive bad times, to recover from unexpected setbacks, and
to take advantage of profitable and unexpected investment opportunities. Generally, the greater
.
The first chapter introduces us to Corporate finance is essential .docxoreo10
The first chapter introduces us to Corporate finance is essential to all managers as it provides all the skills managers need to; Identify corporate strategies and individual projects that add value to the organization and come up with plans for acquiring the funds. The types of business forms are; sole proprietorship, corporation and partnerships. A sole proprietorship form of business possesses different advantages and disadvantages. A partnership maintains roughly similar pros and cons of a sole proprietorship. A corporation is a legal entity that is separate from its owners and managers. Advantages include a smooth transfer of ownership, limited liability, ease of raising capital. The disadvantages include; double taxation, and a high cost of set-up and report filing. The chapter then deals with Objective of the firm, which is to maximize wealth. The final topic is an in-depth look at Financial Securities, which are markets and institutions.
In the second chapter, we are introduced to financial statements, Cash flow and taxes. Financial statements include; the Income statement and the Balance sheet. An income statement is a financial statement that shows a company’s financial performance regarding revenues and expenses, over a particular period, mostly one year. A balance sheet, on the other hand, is a financial statement that states a company’s assets, liabilities and capital at a particular point in time. Under the cash flow, the chapter covers on the Statement of cash flows, indicates how various changes in balance sheet and income statement accounts affect cash and analyses financing, investing and operating activities. A free cash flow shows the cash that an organization is capable of generating after investment to either maintain or expand its database. Under taxes, Corporate and personal taxes are well explained and the scenarios under which they apply.
Chapter Three analyzes Financial Statements. This analysis is broken down into; Ratio Analysis, DuPont equation. The effects of improving ratios, the limitations of ratio analysis and the Qualitative factors. Ratios help in comparison of; one company over time and one company versus other companies. Ratios are used by; Stockholders to estimate future cash flows and risks, lenders to determine their creditworthiness and managers to identify areas of weaknesses and strengths. Liquidity ratios show whether a company can meet its short-term commitments using the resources it has at that particular time. Asset management ratios exemplify how well an organization utilize its assets. Debt management ratios, leverage ratios as well as profitability ratios are explained.
The DuPont equation focuses on several issues. These are; Debt Utilization, Asset utilization and the Expense Control. Consequently, Ratio analysis has various problems and limitations. These include; Distortion of ratios from seasonal factors, various operating and accounting practices can distort comparisons and also it i ...
Chapter 3 ANALYZING AND RECORDING TRANSACTIONSPrinciples of EstelaJeffery653
Chapter 3 ANALYZING AND RECORDING TRANSACTIONS
Principles of Accounting, Volume 1: Financial Accounting
PowerPoint Image Slideshow
Chapter Outline
3.1 Describe Principles, Assumptions, and Concepts of Accounting and Their Relationship to Financial Statements
3.2 Define and Describe the Expanded Accounting Equation and Its Relationship to Analyzing Transactions
3.3 Define and Describe the Initial Steps in the Accounting Cycle
3.4 Analyze Business Transactions Using the Accounting Equation and Show the Impact of Business Transactions on Financial Statements
3.5 Use Journal Entries to Record Transactions and Post to T-Accounts
3.6 Prepare a Trial Balance
Module 3.1 Describe Principles, Assumptions, and Concepts of
Accounting and Their Relationship to Financial Statements
The Financial Accounting Standards Board (FASB) is an independent, nonprofit organization that sets the standards for financial accounting and reporting, including generally accepted accounting principles (GAAP), for both public- and private-sector businesses in the United States.
GAAP are the concepts, standards, and rules that guide the preparation and presentation of financial statements.
US accounting rules are called US GAAP.
International accounting rules are called International Financial Reporting Standards (IFRS).
Some companies that operate on a global scale may be able to report their financial statements using IFRS.
Publicly traded companies (those that offer their shares for sale on exchanges in the United States) have the reporting of their financial operations regulated by the Securities and Exchange Commission (SEC).
Teacher Notes: By having proper accounting standards such as US GAAP or IFRS, information presented publicly is considered comparable and reliable. As a result, financial statement users are more informed when making decisions.
3
The conceptual framework is a set of concepts that guide financial reporting. These concepts help ensure information is comparable and reliable to stakeholders.
Revenue recognition principle: directs a company to recognize revenue in the period in which it is earned; is earned when a product or service has been provided
Expense recognition (matching) principle: states that we must match expenses with associated revenues in the period in which the revenues were earned
Cost principle: states that virtually everything the company owns or controls (assets) must be recorded at its value at the date of acquisition
Full disclosure principle: states that a business must report any business activities that could affect what is reported on the financial statements
The Conceptual Framework
Teacher Notes: Revenue recognition is not dependent on when cash is received.
Expense recognition is not dependent on when cash is paid.
Matching is important so as not to overstate or understate income.
4
Separate entity concept: prescribes that a business may only report activities on financial statements that are specifically rela ...
when will pi network coin be available on crypto exchange.DOT TECH
There is no set date for when Pi coins will enter the market.
However, the developers are working hard to get them released as soon as possible.
Once they are available, users will be able to exchange other cryptocurrencies for Pi coins on designated exchanges.
But for now the only way to sell your pi coins is through verified pi vendor.
Here is the telegram contact of my personal pi vendor
@Pi_vendor_247
how to sell pi coins in all Africa Countries.DOT TECH
Yes. You can sell your pi network for other cryptocurrencies like Bitcoin, usdt , Ethereum and other currencies And this is done easily with the help from a pi merchant.
What is a pi merchant ?
Since pi is not launched yet in any exchange. The only way you can sell right now is through merchants.
A verified Pi merchant is someone who buys pi network coins from miners and resell them to investors looking forward to hold massive quantities of pi coins before mainnet launch in 2026.
I will leave the telegram contact of my personal pi merchant to trade with.
@Pi_vendor_247
what is the future of Pi Network currency.DOT TECH
The future of the Pi cryptocurrency is uncertain, and its success will depend on several factors. Pi is a relatively new cryptocurrency that aims to be user-friendly and accessible to a wide audience. Here are a few key considerations for its future:
Message: @Pi_vendor_247 on telegram if u want to sell PI COINS.
1. Mainnet Launch: As of my last knowledge update in January 2022, Pi was still in the testnet phase. Its success will depend on a successful transition to a mainnet, where actual transactions can take place.
2. User Adoption: Pi's success will be closely tied to user adoption. The more users who join the network and actively participate, the stronger the ecosystem can become.
3. Utility and Use Cases: For a cryptocurrency to thrive, it must offer utility and practical use cases. The Pi team has talked about various applications, including peer-to-peer transactions, smart contracts, and more. The development and implementation of these features will be essential.
4. Regulatory Environment: The regulatory environment for cryptocurrencies is evolving globally. How Pi navigates and complies with regulations in various jurisdictions will significantly impact its future.
5. Technology Development: The Pi network must continue to develop and improve its technology, security, and scalability to compete with established cryptocurrencies.
6. Community Engagement: The Pi community plays a critical role in its future. Engaged users can help build trust and grow the network.
7. Monetization and Sustainability: The Pi team's monetization strategy, such as fees, partnerships, or other revenue sources, will affect its long-term sustainability.
It's essential to approach Pi or any new cryptocurrency with caution and conduct due diligence. Cryptocurrency investments involve risks, and potential rewards can be uncertain. The success and future of Pi will depend on the collective efforts of its team, community, and the broader cryptocurrency market dynamics. It's advisable to stay updated on Pi's development and follow any updates from the official Pi Network website or announcements from the team.
The European Unemployment Puzzle: implications from population agingGRAPE
We study the link between the evolving age structure of the working population and unemployment. We build a large new Keynesian OLG model with a realistic age structure, labor market frictions, sticky prices, and aggregate shocks. Once calibrated to the European economy, we quantify the extent to which demographic changes over the last three decades have contributed to the decline of the unemployment rate. Our findings yield important implications for the future evolution of unemployment given the anticipated further aging of the working population in Europe. We also quantify the implications for optimal monetary policy: lowering inflation volatility becomes less costly in terms of GDP and unemployment volatility, which hints that optimal monetary policy may be more hawkish in an aging society. Finally, our results also propose a partial reversal of the European-US unemployment puzzle due to the fact that the share of young workers is expected to remain robust in the US.
Empowering the Unbanked: The Vital Role of NBFCs in Promoting Financial Inclu...Vighnesh Shashtri
In India, financial inclusion remains a critical challenge, with a significant portion of the population still unbanked. Non-Banking Financial Companies (NBFCs) have emerged as key players in bridging this gap by providing financial services to those often overlooked by traditional banking institutions. This article delves into how NBFCs are fostering financial inclusion and empowering the unbanked.
what is the best method to sell pi coins in 2024DOT TECH
The best way to sell your pi coins safely is trading with an exchange..but since pi is not launched in any exchange, and second option is through a VERIFIED pi merchant.
Who is a pi merchant?
A pi merchant is someone who buys pi coins from miners and pioneers and resell them to Investors looking forward to hold massive amounts before mainnet launch in 2026.
I will leave the telegram contact of my personal pi merchant to trade pi coins with.
@Pi_vendor_247
how can I sell pi coins after successfully completing KYCDOT TECH
Pi coins is not launched yet in any exchange 💱 this means it's not swappable, the current pi displaying on coin market cap is the iou version of pi. And you can learn all about that on my previous post.
RIGHT NOW THE ONLY WAY you can sell pi coins is through verified pi merchants. A pi merchant is someone who buys pi coins and resell them to exchanges and crypto whales. Looking forward to hold massive quantities of pi coins before the mainnet launch.
This is because pi network is not doing any pre-sale or ico offerings, the only way to get my coins is from buying from miners. So a merchant facilitates the transactions between the miners and these exchanges holding pi.
I and my friends has sold more than 6000 pi coins successfully with this method. I will be happy to share the contact of my personal pi merchant. The one i trade with, if you have your own merchant you can trade with them. For those who are new.
Message: @Pi_vendor_247 on telegram.
I wouldn't advise you selling all percentage of the pi coins. Leave at least a before so its a win win during open mainnet. Have a nice day pioneers ♥️
#kyc #mainnet #picoins #pi #sellpi #piwallet
#pinetwork
Poonawalla Fincorp and IndusInd Bank Introduce New Co-Branded Credit Cardnickysharmasucks
The unveiling of the IndusInd Bank Poonawalla Fincorp eLITE RuPay Platinum Credit Card marks a notable milestone in the Indian financial landscape, showcasing a successful partnership between two leading institutions, Poonawalla Fincorp and IndusInd Bank. This co-branded credit card not only offers users a plethora of benefits but also reflects a commitment to innovation and adaptation. With a focus on providing value-driven and customer-centric solutions, this launch represents more than just a new product—it signifies a step towards redefining the banking experience for millions. Promising convenience, rewards, and a touch of luxury in everyday financial transactions, this collaboration aims to cater to the evolving needs of customers and set new standards in the industry.
What price will pi network be listed on exchangesDOT TECH
The rate at which pi will be listed is practically unknown. But due to speculations surrounding it the predicted rate is tends to be from 30$ — 50$.
So if you are interested in selling your pi network coins at a high rate tho. Or you can't wait till the mainnet launch in 2026. You can easily trade your pi coins with a merchant.
A merchant is someone who buys pi coins from miners and resell them to Investors looking forward to hold massive quantities till mainnet launch.
I will leave the telegram contact of my personal pi vendor to trade with.
@Pi_vendor_247
NO1 Uk Black Magic Specialist Expert In Sahiwal, Okara, Hafizabad, Mandi Bah...Amil Baba Dawood bangali
Contact with Dawood Bhai Just call on +92322-6382012 and we'll help you. We'll solve all your problems within 12 to 24 hours and with 101% guarantee and with astrology systematic. If you want to take any personal or professional advice then also you can call us on +92322-6382012 , ONLINE LOVE PROBLEM & Other all types of Daily Life Problem's.Then CALL or WHATSAPP us on +92322-6382012 and Get all these problems solutions here by Amil Baba DAWOOD BANGALI
#vashikaranspecialist #astrologer #palmistry #amliyaat #taweez #manpasandshadi #horoscope #spiritual #lovelife #lovespell #marriagespell#aamilbabainpakistan #amilbabainkarachi #powerfullblackmagicspell #kalajadumantarspecialist #realamilbaba #AmilbabainPakistan #astrologerincanada #astrologerindubai #lovespellsmaster #kalajaduspecialist #lovespellsthatwork #aamilbabainlahore#blackmagicformarriage #aamilbaba #kalajadu #kalailam #taweez #wazifaexpert #jadumantar #vashikaranspecialist #astrologer #palmistry #amliyaat #taweez #manpasandshadi #horoscope #spiritual #lovelife #lovespell #marriagespell#aamilbabainpakistan #amilbabainkarachi #powerfullblackmagicspell #kalajadumantarspecialist #realamilbaba #AmilbabainPakistan #astrologerincanada #astrologerindubai #lovespellsmaster #kalajaduspecialist #lovespellsthatwork #aamilbabainlahore #blackmagicforlove #blackmagicformarriage #aamilbaba #kalajadu #kalailam #taweez #wazifaexpert #jadumantar #vashikaranspecialist #astrologer #palmistry #amliyaat #taweez #manpasandshadi #horoscope #spiritual #lovelife #lovespell #marriagespell#aamilbabainpakistan #amilbabainkarachi #powerfullblackmagicspell #kalajadumantarspecialist #realamilbaba #AmilbabainPakistan #astrologerincanada #astrologerindubai #lovespellsmaster #kalajaduspecialist #lovespellsthatwork #aamilbabainlahore #Amilbabainuk #amilbabainspain #amilbabaindubai #Amilbabainnorway #amilbabainkrachi #amilbabainlahore #amilbabaingujranwalan #amilbabainislamabad
how to sell pi coins on Bitmart crypto exchangeDOT TECH
Yes. Pi network coins can be exchanged but not on bitmart exchange. Because pi network is still in the enclosed mainnet. The only way pioneers are able to trade pi coins is by reselling the pi coins to pi verified merchants.
A verified merchant is someone who buys pi network coins and resell it to exchanges looking forward to hold till mainnet launch.
I will leave the telegram contact of my personal pi merchant to trade with.
@Pi_vendor_247
1. 3. RATIO ANALYSIS
Objectives: After reading this chapter, you will be able to
1. Construct simple financial statements of a firm.
2. Use ratio analysis in the working capital management.
3.1
Balance Sheet Model of a Firm
Business firms require money to run their operations. The investors provide this money,
or capital. This is mutually beneficial to the firms and to the investors. The investors get a
reasonable return on their investment, and the firms get the badly needed capital.
Primarily, the firms employ two forms of capital: the debt capital and the equity capital.
The firms acquire the capital from two types of investors; the bondholders provide the
debt capital and the stockholders the equity capital. From the perspective of the investors,
the risk of these investments is different, the bonds being the safer investment relative to
the stocks. Similarly, the firms bear more risk when they issue bonds, because the firms
must pay interest on the bonds when it is due.
Consider a corporation that has no debt. Stockholders provide the entire financing of the
company. We call it an all-equity firm. Figure 3.1 shows this as Firm A. This firm can
borrow some money, by selling long-term bonds. From the proceeds of the sale of the
bonds, it buys back some of its outstanding stock. Thus, it can replace some equity with
debt. Suppose it is able to do so in a judicious way so that its debt ratio, or debt-to-assets
ratio, becomes 25%. Now it looks like Firm B in the diagram.
Equity
Debt
100%
90%
25%
80%
70%
80%
60%
50%
100%
40%
75%
30%
20%
20%
10%
0%
Firm A
Firm B
Firm C
Fig. 3.1: The capital structure of three corporations with differing amounts of debt..
Occasionally, corporations get too far in debt. For example, Firm C in the diagram has
80% debt, which is too much. Such a company is always worried about its ability to pay
42
2. Working Capital Management
3. Ratio Analysis
_____________________________________________________________________________
interest to the bondholders. If it is unable to pay interest on time, the bondholders can
force it into bankruptcy. It is the possibility of bankruptcy that makes it a risky company.
Figure 3.1 shows the relative amounts of money invested by the two types of investors,
the stockholders, and the bondholders. Their stakes in the company are represented by the
two areas, white and gray. We know that the company should employ the debt and the
equity in proper proportions. Too much debt can lead to financial failure of a company.
The capital is invested in the assets of the firms. If the debt capital is B, and the equity
capital S, then the total capital of the company is B + S. This must also be equal to the
total value of the company, V,
V=B+S
(3.1)
Now we may look at the financial condition of a company from a different angle. This
time we look at its balance sheet. The balance sheet of a company lists its assets and
liabilities at a particular time. For example, we may be looking at the balance sheet of a
company as of December 31, 1998. The stockholders equity, or just equity, by definition,
is
Stockholders Equity = Assets − Liabilities
(3.2)
When a corporation is set up, it clearly spells out the rights and expectations of both types
of investors. The bondholders are lending their money to the corporation at a certain rate
of interest. They expect to receive their interest on time, along with the final payment of
the bonds when they mature. The stockholders cannot demand dividends from the firm.
The stockholders, even though they are owners of the firm, have limited liability in case
the company gets into serious financial or legal difficulties. They are also the holders of a
call option on the assets of the firm, with an exercise price equal to the face value of the
bonds of a company. In case of liquidation, they receive whatever the company is left
with after all other creditors are satisfied. In this sense, they are the last ones in line to
receive the benefits from the company. This concept leads us to equation (3.2). We may
rewrite this equation as
Assets = Liabilities + Equity
(3.3)
This is exactly the same as (3.1). The above equation may also be represented by a pie
chart, with two pieces belonging to the stockholders and bondholders. The total value of
the assets of the firm is simply the whole pie, the sum of liabilities and equity.
What makes up the assets of a firm? First, the obvious physical ones: buildings and lands;
factories and warehouses; machinery and equipment; inventories of merchandise and
finished goods. Second, we consider the financial assets: money in checking accounts and
marketable securities; the money it expects to receive from its customers. The less
obvious assets include the expertise of its managers, the quality of its products, and the
reputation of its brand name.
43
3. Working Capital Management
3. Ratio Analysis
_____________________________________________________________________________
The liabilities of a firm include the money it has borrowed from bondholders, and other
lenders. It also includes the money it owes to its suppliers, or any other unpaid bills.
Accountants spend a considerable amount of effort in classifying and measuring the
assets and liabilities of a corporation.
Assets
Liabilities and
Equity
Current
Assets
Current
Liabilities
Long-term
Assets
Long-term
Liabilities
and Equity
Fig. 3.2. A snapshot of the corporation's financial condition on a given date
One way to classify the assets and liabilities is whether they are long-term, or short-term.
The distinction between long-term and short-term is rather arbitrary. Generally, the assets
that are going to last for more than a year are considered to be long-term assets.
Similarly, long-term liabilities are due after more than a year. Based on this
differentiation, we may slice the balance sheet into four quadrants, as indicated in the
following diagram. Again, it is just an aid in visualizing the capital structure of a
corporation, with the added dimension of time.
Assets
Liabilities and Equity
Current Assets
Cash
Marketable Securities
Accounts Receivable
Inventories
Long-term Assets
Plant and Equipment
Less Accumulated
Depreciation
= Net Plant and Equipment
Total Assets
Current Liabilities
Accounts Payable
Accruals
Notes Payable
Long-term Liabilities
Long-term bonds
Owners' Equity
Common Stock
Preferred Stock
Retained Earnings
Total Liabilities and Equity
Fig. 3.3: A more detailed picture of assets and liabilities
Figure 3.3 shows the financial condition of a company in terms of its assets and
liabilities, but classifies them whether they are short-term or long-term.
44
4. Working Capital Management
3. Ratio Analysis
_____________________________________________________________________________
Next, we fill out additional details in the picture. We may do so by looking at the assets
and liabilities more closely. In the above table, the assets are listed in order of their
accounting liquidity, that is, the ease with which the assets can be converted into cash.
Cash is the lifeblood of a corporation. If a company does not have enough cash on hand
to pay its workers on time, or its suppliers, it can run into serious problems. This can lead
to a liquidity crisis, otherwise known as a cash crunch. Careful management of the cash
position of a company is one of the basic problems in the working capital management.
Let us revisit equation (3.3) to develop another important concept, namely the cash
equation. Let us write
Assets = Liabilities + Equity
(3.3)
as follows:
Cash + Current assets (except cash) + Fixed assets
= Short-term liabilities + Long-term debt + Equity
Rearranging terms, we find
Cash = Short-term liabilities + Long-term debt + Equity − Fixed assets
− Current assets (except cash) (3.4)
The above equation isolates cash as one factor, and the other financial parameters that
cash depends upon. By examining the above equation, we notice, for example, increasing
long-term debt and equity will increase the cash position of a company. Further,
increasing the fixed assets, or the net working capital (except cash) will decrease the cash
position of a company.
3.2
Net Working Capital
By definition, the net working capital of a company is the difference between the current
assets and the current liabilities of a firm:
Net working capital = Current assets – Current liabilities
(4.1)
The changes in current assets and current liabilities will create a change in the net
working capital of a company. We also recall that the four main items in the current
assets of a firm are: (1) cash
(3) accounts receivable
(2) marketable securities
(4) inventories
The three principal items in the current liabilities are:
(1) accounts payable, (2) accrued wages, taxes, and other accrued expenses,
(3) notes payable.
Any change in these seven items will lead to a change in the net working capital of a
corporation.
45
5. Working Capital Management
3. Ratio Analysis
_____________________________________________________________________________
3.3
Ratio Analysis
It is possible to look at the financial health of a corporation by looking at some of its key
financial ratios. Ratio analysis can also be used as a diagnostic tool to find the sources of
financial trouble at a company.
The ratios may be divided into these types:
1. Liquidity ratios focus on the availability of cash for operations.
2. Asset management ratios evaluate the efficient utilization of the resources.
3. Debt management ratios keep track of debt to be within reasonable bounds, and keep
the debt level at its optimal level.
4. Profitability ratios measure the degree of accounting profits.
5. Market value ratios help investors discriminate between overvalued and undervalued
securities while making investment decisions.
Let us review these ratios and their significance.
Liquidity Ratios:
First we look at the liquidity ratios of a company. These ratios focus on the availability of
cash to manage the day-to-day operations of the company. In particular, we define the
current ratio as
Total current assets
Current ratio = Total current liabilities
(3.5)
The current ratio of a company gives us a quick way to look at its current assets and
current liabilities. They should be nearly equal to one another. Next, we look at a more
stringent ratio that gives us the cash position of the firm more accurately by removing the
value of the inventories from the current assets. This gives us the quick ratio, or the acid
test ratio, as follows:
Current assets inventories
Quick, or Acid Test, ratio =
(3.6)
Current liabilities
Asset Management Ratios:
The asset management ratios evaluate the efficiency of use of the principal assets of a
company, such as its inventory.
Cost of goods sold
Inventory Turnover = Inventories (average)
46
(3.7)
6. Working Capital Management
3. Ratio Analysis
_____________________________________________________________________________
This ratio measures the efficient use of inventories. A firm should have a high turnover
ratio, which is managed through a small amount of inventories. This means that a firm
should have a small inventory and try to sell it as quickly as possible. Unfortunately, a
small inventory also means lower sales.
Closely related to the inventory management is the management of receivables. A
company should have a small amount invested in the receivables. That is, the company
should try to sell the goods for cash. To measure the efficiency of this operation, we
define the Days Sales Outstanding as
Receivables
Days sales outstanding = Sales per day
(3.8)
A broader measure of the efficiency of use of assets is the fixed assets turnover. This
ratio is defined as follows.
Annual sales
Fixed assets turnover = Net fixed assets (average)
(3.9)
Some corporations have a huge investment in fixed assets, plant and equipment. This is
the case of electric utilities or real estate investment trusts, for instance. Other
corporations, such as software development companies, may have a rather small
investment in equipment. It is proper to compare firms with one another that are in the
same line of business.
A broader measure of asset utilization is the following ratio
Annual sales
Total assets turnover = Total assets (average)
(3.10)
This ratio looks at the aggregate assets of a company and measures the way the company
utilizes them.
Debt Management Ratios:
The corporations borrow money to do their business because debt capital is cheaper than
the equity capital. On the other hand, excessive amount of debt can create problems for
the company. To see the debt level of a company, we define its debt ratio, or leverage
ratio as follows
Total debt
Debt ratio =
(3.11)
Total assets
Of course, the companies must maintain their debt at an optimal level.
Another ratio that looks at the ability of a company to pay its interest when due is its
interest coverage ratio, or times interest earned. This is defined as
47
7. Working Capital Management
3. Ratio Analysis
_____________________________________________________________________________
EBIT
Interest coverage = Interest charges
(3.12)
If this ratio is 4, then for each dollar of interest due, the company has $4 available. This is
a fairly safe ratio, and the probability of default is quite low.
Profitability Ratios:
The next set of ratios measure the ability of a company to generate profits. These ratios
are of interest to investors who would like to invest in the most profitable companies
around. The first ratio is the net profit margin, defined as
Net profit margin =
Net income
Total operating revenue
(3.13)
In this ratio, net income is defined to be the income after taxes, available to the
stockholders of the company.
The next ratio looks at the profitability from the point of view of the management of a
firm. In this case, the denominator is EBIT, meaning earnings before interest and taxes. If
the EBIT is too small, then the financial managers at a corporation will have difficulty in
paying the interest on time. We define gross profit margin as follows:
EBIT
Gross profit margin = Total operating revenue
(3.14)
Another ratio that the investors like to review is net return on assets. We may define it as
Net income
Net return on assets = Total average assets
(3.15)
The similar ratio that the management wants to review is gross return on assets, defined
as follows
EBIT
Gross return on assets = Total average assets
(3.16)
The stockholders are particularly interested in the following three ratios. First, return on
common equity, that measures the return to the stockholders on stockholders' investment
in the company. This is defined as
Net income to stokholders
Return on common equity = Average common equity
(3.17)
Second, is the dividend payout ratio. This represents the fraction of money paid to the
stockholders out of the income after taxed. We may define it as
48
8. Working Capital Management
3. Ratio Analysis
_____________________________________________________________________________
Dividend payout ratio =
Total cash dividends
Net income
(3.18)
The dividend payout ratio is important to the management as well. They cannot afford to
pay large dividends when the company needs the money to finance new profitable
projects. The growth of a company depends upon the retention rate, that is, the money
that is not paid out as dividends. We define the third quantity, the sustainable growth rate
as
Sustainable growth rate = ROE Retention ratio
(3.19)
where ROE stands for the return on equity for a firm.
Market Value:
From an investor's point of view, it is important to see the difference between the market
value of the stock of a company, and its accounting value, or book value. To get a
perspective on this difference, we define the Market/Book ratio as
Market price/share
Market/Book ratio = Book value/share
(3.21)
Investors, hunting for bargains, like to see this ratio as small as possible. We complete
our list by including two more ratios, defined as follows:
P-E ratio =
Market price/share
Earnings/share
(3.22)
and
Dividend per share
Dividend yield = Market price per share
3.4
(3.23)
Sources of Information
Internet is by far the best source of information. There are many sources of information
on the Internet. The information is quite reliable, current, and accurate. If you cannot find
it on the Internet, there are still several print media to fall back on. The information about
Microsoft was taken from the Internet. You may want to check the following sources:
Internet
Print
http://cbs.marketwatch.com The Wall Street Journal
http://www.yahoo.com
The New York Times
http://www.google.com
Standard and Poors
49
9. Working Capital Management
3. Ratio Analysis
_____________________________________________________________________________
Microsoft Profile, January 1, 2001
One Microsoft Way
Redmond, WA 98052
Tel: (452) 882-8080, Fax: (425) 936-7329
Website - http://www.microsoft.com
Company Calendar
Earnings report announcement: January 15, 2001
Profile
Microsoft Corporation, incorporated in 1981, develops, manufactures, licenses and supports a wide range
of software products for a multitude of computing devices. Microsoft software includes scalable operating
systems for servers, personal computers (PCs) and intelligent devices, server applications for client/server
environments, knowledge worker productivity applications, and software development tools. The
Company's online efforts include the MSN network of Internet products and services and alliances with
companies involved with broadband access and various forms of digital interactivity. Microsoft also
licenses consumer software programs, sells hardware devices, provides consulting services, trains and
certifies system integrators, and researches and develops advanced technologies for future software
products.
The Company is divided into three main areas: the Business Divisions, the Sales, Marketing and Support
Group, and the Operations Group. The Business Divisions work in close partnership in order to create
powerful software services and solutions built around the Internet, Windows and new devices. The product
segments, based on these business divisions, are the Windows Platforms segment, the Business
Productivity Applications and Developer segment, and the Consumer and other segment. The Sales,
Marketing and Support Group is responsible for building long-term business relationships with original
equipment manufacturers (OEMs), enterprises, small and medium-sized businesses, application developers,
educational institutions and consumers. Enterprises are offered tailored license programs, enterprise-wide
support, consulting services and other specialized services. The Operations Group is responsible for
managing business operations and overall business planning. This includes the process of manufacturing
and delivering finished goods and licenses, corporate functions such as finance, administration, human
resources and legal.
Windows Platforms
The Windows Platforms segment is responsible for the development of PC and server platforms, including
the Microsoft Windows and Windows 2000 operating systems. The segment is also responsible for
developing the Microsoft Internet Explorer browsing software and Microsoft Windows Media
Technologies. Specific products of the Windows Platforms segment include the Windows Millennium
Edition (Me) operating system, Windows 2000 Professional operating system, Windows NT Workstation
and Windows 2000 Server, Advanced Server and Datacenter Server. Other products in this segment include
Windows NT Server, other servers (Microsoft Proxy Server, Microsoft SNA Server and Microsoft Systems
Management Server), and Windows Media Technologies.
Productivity Applications and Developer
The Productivity Applications and Developer segment has two primary divisions, the Business Productivity
Group and the Developer Group. The Business Productivity Division delivers integrated business
productivity solutions for the knowledge worker, including the Office family of products, other desktop
applications, server applications and the Windows CE operating system for productivity appliances.
Specific products include the Microsoft Office (Microsoft Word, Microsoft Excel, Microsoft Outlook,
Microsoft PowerPoint, Microsoft Access, etc), other desktop application products (such as Microsoft
Project, Microsoft Visio and Microsoft Publisher), server applications (Microsoft BackOffice family of
servers), Microsoft Exchange Server, Windows CE and bCentral.
50
10. Working Capital Management
3. Ratio Analysis
_____________________________________________________________________________
The Developer Group provides software development tools and distributed application platforms to
developers of Windows-based applications and Internet applications. These products and services empower
independent software developers, corporate developers, solutions developers and Webmasters to create a
broad spectrum of applications. Microsoft Windows Distributed interNet Applications (DNA) Architecture
is the application development model for the Windows platform. Specific products include Developer
Tools (Microsoft Visual C++, Microsoft Visual Basic, Microsoft Visual InterDev), Microsoft Visual J++,
and Microsoft Visual Studio, and the Microsoft SQL Server.
Consumer
The Consumer Group supplies services and content to consumers over the Internet including MSN Internet
Access, WebTV Internet Service, MSN Portal and vertical properties, and develops software and hardware
products that are designed to meet the needs of consumers in the home environment. MSN Internet Access
provides dial-up Internet access, free Web-based e-mail through MSN Hotmail and Microsoft MSN
Messenger Service. WebTV Networks is an online service that enables consumers to experience the
Internet through their televisions via set-top terminals based on WebTV technologies. The MSN Portal
business provides services on the Internet, encompassing the home page as well as the vertical services, and
includes the Microsoft CarPoint online automotive service, Microsoft HomeAdvisor online real estate
service, Expedia, Inc., MSNBC, Microsoft Passport and TransPoint.
Major product categories include learning, productivity, entertainment and hardware peripherals. Learning
titles include Microsoft Encarta multimedia encyclopedia and Microsoft Bookshelf CD-ROM reference
library. Microsoft's productivity offerings include Microsoft Works, Microsoft Money and the Works Suite.
The Company offers a line of entertainment products from classical software games to online games
(Microsoft Internet Gaming Zone), simulations, sport products and strategy games. These products include
the Microsoft Flight Simulator, Combat Flight Simulator, Age of Empires, Monster Truck Madness racing
simulation, Microsoft Baseball, Microsoft Links and other sports and action titles. Hardware peripherals
include the Microsoft Mouse, Microsoft IntelliMouse, Microsoft Natural Keyboard and Microsoft
SideWinder game controllers.
Microsoft Press
Microsoft Press offers comprehensive learning and training resources to help new users, power users and
professionals get the most from Microsoft technology through books, CDs, self-paced training kits and
videos that are created to accommodate different learning styles and preferences. Microsoft Press books are
authored by professional and technical writers, Microsoft employees and independent authors. Books are
marketed by independent sales representatives and by Microsoft Press sales personnel. Internationally,
Microsoft Press has numerous agreements with publishers for the worldwide distribution of its books.
Microsoft Press has granted a publisher in England the right to distribute English language versions of its
books in all countries except the United States, Canada, Latin America and certain Asian countries.
The Company's sales and marketing group seeks to build long-term relationships with customers of
Microsoft products. The OEM sales group includes the sales force that works with original equipment
manufacturers that preinstall Microsoft software on their PCs. In addition to the OEM channel, Microsoft
has three major geographic sales and marketing organizations: the South Pacific and Americas, Europe,
Middle East and Africa, and Asia. The Company's customers include consumers, small and medium-sized
organizations, enterprises, dotcoms, educational institutions, ISPs, application developers and OEMs. Most
consumers of Microsoft products are individuals in businesses, government agencies, educational
institutions and at home.
Microsoft's most significant competitors include IBM, Sun Microsystems, Oracle and AOL.
51
11. Working Capital Management
3. Ratio Analysis
_____________________________________________________________________________
Microsoft Profile, January 1, 2001
Ratios & Statistics
Ratios
P/E Ratio (TTM)
P/E High - Last 5 Yrs.
P/E Low - Last 5 Yrs.
Beta
Price to Sales (TTM)
Price to Book (MRQ)
Price to Tangible Book (MRQ)
Price to Cash Flow (TTM)
Price to Free Cash Flow (TTM)
% Owned Institutions
Company
27.81
86.12
32.43
1.80
11.67
5.77
5.77
26.07
20.86
41.01
Industry
28.93
85.56
27.35
1.71
17.04
13.25
16.20
28.65
45.99
38.20
S&P 500
32.46
48.25
17.13
1.00
5.48
7.84
11.63
25.43
45.81
57.72
Dividends
Dividend Yield
Dividend Yield - 5 Year Avg.
Dividend 5 Year Growth Rate
Payout Ratio
Company
0.00
0.00
0.00
Industry
0.27
0.02
( 10.39)
0.21
S&P 500
1.60
1.26
8.87
24.73
Company Industry
37.28
40.76
Revenue - 5 Yr. Growth Rate
30.46
43.19
EPS (MRQ) vs Qtr. 1 Yr. Ago 17.72
34.94
EPS (TTM) vs TTM 1 Yr. Ago 17.78
19.15
EPS - 5 Yr. Growth Rate
42.42
47.91
Capital Spending - 5 Yr. Growth Rate 12.17
20.35
S&P 500
22.83
22.34
19.73
31.16
26.31
20.41
17.18
Financial Strength
Quick Ratio (MRQ)
Current Ratio (MRQ)
LT Debt to Equity (MRQ)
Total Debt to Equity
Interest Coverage (TTM)
Company
3.00
3.37
0.00
0.00
-
Industry
2.99
3.22
0.11
0.12
( 12.55)
S&P 500
1.21
1.71
0.60
0.91
10.65
Profitability Ratios (%)
Gross Margin (TTM)
Gross Margin 5 Yr. Avg.
EBITD Margin (TTM)
EBITD - 5 Yr. Avg.
Operating Margin (TTM)
Operating Margin 5 - Yr. Avg
Company
86.53
2.23
49.54
47.92
46.74
42.91
Industry
77.35
74.98
25.17
23.78
19.38
16.07
S&P 500
50.12
48.27
23.77
21.69
18.53
17.64
Growth Rates (%)
Revenue (MRQ) vs Qtr 1 Yr. Ago 7.73
Revenue (TTM) vs TTM 1 Yr Ago 16.25
52
12. Working Capital Management
3. Ratio Analysis
_____________________________________________________________________________
Profitability Ratios (%)
Pre-Tax Margin (TTM)
Pre-Tax Margin - 5 Yr. Avg.
Net Profit Margin (TTM)
Net Profit Margin - 5 Yr. Avg.
Effective Tax Rate (TTM)
Effective Tax Rate - 5 Yr. Avg.
Company
63.35
50.18
41.98
32.62
33.74
35.10
Industry
9.00
21.62
23.41
13.23
36.86
35.23
S&P 500
18.49
16.86
13.07
10.64
34.64
35.38
Management Effectiveness (%)
Return On Assets (TTM)
Return On Assets 5 Yr. Avg.
Return On Investment (TTM)
Return On Investment - 5 Yr. Avg.
Return on Equity (TTM)
Return on Equity - 5 Yr. Avg.
Company
20.11
24.86
25.17
24.86
25.61
35.09
Industry
17.21
12.33
6.86
24.58
7.17
28.90
Efficiency
Revenue/Employee (TTM)
Net Income/Employee (TTM)
Receivable Turnover (TTM)
Inventory Turnover (TTM)
Asset Turnover (TTM)
Industry
394,756.81
167,225.70
6.29
26.85
0.68
S&P 500
677,268.23
103,161.13
8.76
9.53
0.99
Company
597,749.00
250,921.00
7.89
0.48
S&P 500
9.83
8.55
13.76
13.57
23.16
22.06
MRQ = Most Recent Quarter, TTM = Trailing Twelve Months
Note: Reported in Thousands of U.S. Dollars
Key Terms
Accounts payable, 31
Accounts receivable, 31
Accruals, 31
all-equity firm, 29
Asset management ratios, 32
Assets, 30
Balance sheet, 29
Bondholders, 29
Capital, 29
Cash, 31
Common stock, 31
Debt capital, 29
Debt management ratios, 33
debt ratio, 29
Equity, 30
Equity capital, 29
Inventories, 31
Liabilities, 30
Liquidity, 32
Liquidity crisis, 32
Liquidity ratios, 32
Long-term bonds, 31
Market value ratios, 33
Marketable securities, 31
Notes payable, 31
Preferred stock, 31
Profitability ratios, 33
Retained earnings, 31
Risk, 29
Stockholders, 29
Examples
3.1. Danube Trucking and Storage Company had revenue of $11.12 million in 1999 from
transportation operations, and $1.23 million in warehousing fees. The main expenses
were, diesel fuel $2.55 million, salary of the truck drivers $6.96 million, truck repairs
$1.03 million, tires and other parts $1.73 million. The company had depreciation of $1.45
million. The company has a $2.5 million note at the bank, with 8% interest rate. The
company had income tax rate of 28%. Prepare an income statement of Danube.
53
13. Working Capital Management
3. Ratio Analysis
_____________________________________________________________________________
Revenues
Transportation
Warehouse fees
Total Revenues
$ million
11.12
1.23
12.35
Expenses
Diesel fuel
Salaries
Repairs
Tires, parts
Depreciation
$ million
2.55
6.96
1.03
1.73
1.45
EBIT
12.35 13.72 = 1.37
Interest .08*2.5 = 0.2
EBT
1.57
Taxes paid 0
Earnings after taxes
1.57
Note that the depreciation is a non-cash expense. The company had to use some of its
cash reserves, or perhaps sell marketable securities to pay the $0.2 million in interest. The
company had a net loss of $1.57 million.
3.2. Elbe Chemical Company sold 8672 tons of ammonium sulfate in 1999 at $155 a ton.
The production cost of the chemical was $102 a ton, on the average. Mr. Elbe, the owner,
took a salary of $55,000, while the workers were paid $283,000. The company paid
$24,000 in warehouse rent, and $38,000 in office expenses. The company has a $100,000
note at the bank, with 8% interest rate. The company had income tax rate of 28%. Prepare
an income statement of Elbe.
A compact income statement is shown as following.
Elbe Chemical Company
Income Statement, 1999
Quantity
Calculation
Revenues 8672 tons * $155/ton
Production cost
8672 tons * $102/ton
Salaries
Owner $55,000
Workers $283,000
Rent
Office expense
EBIT
Interest
$100,000 @ 8%
EBT
Income tax
.28 * EBT
Net income
54
Amount
$1,344,160
-$884,544
-$338,000
-$24,000
-$38,000
$59,616
-$8,000
$51,616
-$14,452
$37,164
14. Working Capital Management
3. Ratio Analysis
_____________________________________________________________________________
3.3. The following information is available about Don Company.
Accounts payable
Accounts receivable
Average inventory
Buildings and land
Cash
Cost of goods sold
EBIT
Long-term bonds
Price per share
Price/Earnings ratio
Stockholders equity
Total assets
Total sales
$10 million
$5.48 million
$30 million
?
$5 million
$80 million
$18 million
$25 million with 10% coupon
$72
18
?
$100 million
$125 million
(A) Calculate the following:
1. Days sales outstanding
2. Interest coverage ratio
3. Debt ratio
4. Inventory turnover ratio
5. Earnings per share
(B) Prepare a balance sheet for Don Company.
(A) 1. By definition,
Receivables
Receivables
Days sales outstanding = Sales per day = 365×Annual sales = 365*5.48/125 = 16 days ♥
EBIT
2. By definition, Interest coverage ratio = Interest charges = 18/(25*.1) = 7.2 ♥
Total debt
3. By definition, Debt ratio = Total assets = 25/100 = 25% ♥
The debt of a corporation consists of its long-term bonds, and its short-term notes.
Although a company may also have other short-term obligations, such as accounts
payable, they are not included in its debt.
Cost of goods sold
4. By definition, Inventory turnover = Inventories (average) = 80/30 = 2.67 ♥
5. By definition, Earnings/share =
Market price/share
= 72/18 = $4 ♥
P-E ratio
55
15. Working Capital Management
3. Ratio Analysis
_____________________________________________________________________________
(B)
Don Company
Current Assets
Cash
Accounts receivable
Inventory
Total current assets
Long-term Assets
Buildings & land
Total assets (V)
$million
Current Liabilities
5.00 Accounts payable
5.48
30.00
40.48 Total current liabilities
Long-term liabilities
59.52 Bonds (B)
Stockholders equity (S)
100.00
Total (B + S)
$million
10.00
10.00
25.00
65.00
100.00
The above balance sheet has the following features:
1. It is simple and easy to read. It has all items given in the problem and includes the
unknown quantities, buildings and land, and stockholders equity.
2. It separates the items in terms of time: long-term and short-term.
3. It shows that the total assets of the company are equal to its liabilities and stockholders
equity.
3.4. The following information is available about Dnieper Company.
Number of shares = 100,000
EBIT = $200,000
Long-term debt = $1 million
Income tax rate = 30%
Price per share = $4.20
Coupon rate on bonds = 8%
Find its (A) P/E ratio, (B) Interest coverage ratio, and (C) Debt ratio
(A) The interest on the bonds is .08*1,000,000 = $80,000. From EBIT, we first pay the
interest on the bonds. This gives us 200,000 – 80,000 = $120,000. This is earnings before
taxes. The taxes due on this amount are .3*120,000 = $36,000. After paying taxes, we are
left with 120,000 – 36,000 = $84,000. This is earnings after taxes. If we divide it by the
number of shares, 100,000, we get the EPS as 84,000/100,000 = $0.84.
A short-cut method is to use the formula
EPS =
(EBIT − I)(1 − t) (200‚000 − .08*1‚000‚000)(1 − .3)
=
= $0.84
N
100‚000
The P/E ratio is $4.20/$0.84 = 5 ♥
(B) The interest coverage ratio is EBIT/I = 200,000/80,000 = 2.5 ♥
The total assets of the firm = total debt + total equity = 1,000,000 + 4.2*100,000 =
$1,420,000
56
16. Working Capital Management
3. Ratio Analysis
_____________________________________________________________________________
total debt
1‚000‚000
The debt ratio = Total assets = 1‚420‚000 = 70.42% ♥
Problems
3.5. Income statement: Drava Salt Company sold 8672 tons of common salt in 2008 at
$55 a ton. The purchase price of the salt was $32 a ton, on the average. Mr. Drava, the
owner, took a salary of $55,000, while the workers were paid $63,000. The company paid
$24,000 in warehouse rent, and $10,000 in office expenses. The company has a $100,000
note at the bank, with 8% interest rate. The company had income tax rate of 33%. Prepare
an income statement of Drava Salt.
3.6. Balance sheet: Prepare the balance sheet of Isar Company using the following data:
Accounts payable
Accounts receivable
Accumulated retained earnings
Bonds payable
Capital surplus
Cash
Machinery
Patents
Taxes payable
$6,000
8,000
6,000
7,000
19,000
4,000
34,000
82,000
2,000
3.7. Balance sheet: A portion of Maritsa Company's balance sheet as of 12/31/2008 is
shown below:
Long-term debt
Preferred stock
Common stock
Retained earnings
12/31/2008
$50 million
$30 million
$100 million
$20 million
12/31/2009
In 2009, the company sold $10 million of new bonds, but also bought back $5 million of
its common stock. It had net income of $14 million, and paid out $4 million in dividends.
Indicate the changes in its balance sheet as of 12/31/2009.
3.8. Cash flows: We have the following information about Moselle Company:
Moselle Company
Income statement
Revenues
Expenses
Depreciation
Net Income
Dividends
57
2008
$800
500
100
200
100
17. Working Capital Management
3. Ratio Analysis
_____________________________________________________________________________
Balance Sheet, Moselle Company
Assets
Current assets
Net fixed assets
Total assets
Liabilities and equity
Current liabilities
Long-term debt
Stockholders' equity
Total liabilities and equity
12/31/08
$300
400
$700
12/31/08
$150
150
400
$700
12/31/07
$200
200
$400
12/31/07
$100
0
300
$400
A. Find the change in the net working capital in 2008.
3.9. Cash position: Indicate whether the following actions will increase, decrease, or
make no change in the cash position of Neva Company:
1. The firm collects payments from previous sales.
2. The company buys a piece of machinery by using long-term debt.
3. The company buys raw material for inventory on credit.
4. The company issues common stock.
5. The firm sells merchandise on credit.
6. The company declares a dividend.
7. The company purchases raw materials for inventory and pays in cash.
8. The firm pays interest on long-term debt.
9. This year's tax liability is increased.
10. The firm pays last year's taxes.
11. The firm uses retained earnings to buy marketable securities.
12. The corporation buys a piece of furniture using a short-term note.
13. The company increases the allowance for bad debts.
14. The company buys back its own stock.
15. The firm borrows on a short-term note.
16. The company pays for a previous purchase.
17. The company sells some merchandise for cash.
18. The firm increases the accumulated depreciation.
19. The firm gives away some merchandise to charity.
20. The firm receives an insurance payment after a fire loss.
3.10. Financial ratios: The following information is available about Rhine Company.
EBIT = $800,000
Total assets = $10 million
Number of shares = 200,000
Dividend payout ratio = 50%
Short-term liabilities = $1 million
Income tax rate = 30%
Coupon rate on bonds = 8%
Long-term debt = $4 million
Short-term assets = $2 million
Find its (A) Current ratio, (B) Dividend per share, and (C) Price per share
(A) 2 (B) $0.84 (C) $25 ♥
58
18. Working Capital Management
3. Ratio Analysis
_____________________________________________________________________________
3.11. Financial ratios: The following information is available about Seine Company.
Number of shares = 400,000
EBIT = $3 million
Total assets = $18 million
Short-term liabilities = $2 million
COGS = $6 million
Long-term debt = $6 million
Income tax rate = 35%
Coupon rate on bonds = 6%
Average inventory = $1.5 million
4.00 ♥
8.333 ♥
$4.29 ♥
$25.00 ♥
5.83 ♥
Find its (A) Inventory turnover ratio
(B) Interest coverage ratio
(C) Earnings per share
(D) Price per share
(E) P-E ratio
3.12. Financial ratios: The following information is available about Marne Company for
2010. All sales are on credit.
Average cash and marketable securities = $1 million
Average inventory = $5 million
Average accounts payable = $3 million
Average accounts receivable = $3 million
EBIT = $2 million
COGS = $15 million
Long-term bonds = $8 million
Coupon rate on bonds = 10%
Total Sales = $20 million
3.00 ♥
54.75 days ♥
2.50 ♥
3.00 ♥
1.333 ♥
Find its (A) Inventory turnover ratio
(B) Number of days sales outstanding
(C) Interest coverage ratio
(D) Current ratio
(E) Quick ratio
3.13. Financial ratios: Ider Corp expects to have $3.73 as earnings per share next year.
The cost of equity for Ider is 16%, whereas its dividend yield is 4%. The price per share
of Ider is $40. Find its dividend payout ratio. Find its current P/E ratio.
DPR = 42.9%, P/E = 12.01 ♥
3.14. Financial ratios: Archer Corporation has 12 million shares of common stock
selling at $30 each. Archer has a dividend payout ratio of 55%, and its dividend per share
is $2.50. It has no debt and its tax rate is 32%. Find the EBIT of Archer. $80.214 million ♥
3.15. Financial ratios: Capricorn Company has income tax rate of 40% and its expected
EBIT next year is $4.4 million. It has $12 million (face value) of bonds with a coupon of
9%, and has 3 million shares of common selling at $10 each. Calculate the expected
price-earnings ratio for Capricorn.
15.06 ♥
3.16. Financial ratios: James Corp has EBIT of $40 million. It has $50 million in debt at
8% average interest rate, and 45% dividend payout ratio. James has $12.276 million in
retained earnings from its current EBIT. Find the income tax rate of James.
38% ♥
59
19. Working Capital Management
3. Ratio Analysis
_____________________________________________________________________________
3.17. Financial ratios: Athol Corp has EBIT of $45 million and has 12 million shares of
stock. It has $120 million face value of bonds with a coupon of 11%, and its tax rate is
32%. If its P-E ratio is 12, find the price of one share of stock.
$21.62 ♥
3.18. Financial ratios: Andover Co has debt/assets ratio of .35, and its tax rate is 32%.
Andover has 2 million shares, each selling for $25. The Andover bonds have a coupon of
8% and they sell at par. If the EPS of Andover is $2, find its EBIT.
$8.036 million ♥
3.19. Financial ratios: Evans Co has dividend payout ratio of 65% and tax rate of 30%.
It has paid $18 million in interest, and $4 dividend per share for this year. If Evans has 6
million shares, find its EBIT for the current year.
$70.747 million ♥
3.20. Financial ratios: Everly Co has EBIT of $40 million and P-E ratio of 12. The total
value of the stock of Everly is $240 million, and it has to pay $10 million in interest. Find
the income tax rate of Everly.
33.33% ♥
3.21. Financial ratios: Colombo Corporation has EBIT of $4.4 million, tax rate 30%,
and 60% dividend payout ratio. Colombo pays $1.68 million in total dividends and has $4
million in debt. Find the cost of debt for Colombo.
10% ♥
3.22. Which two of the following would be preferable to the bondholders of a company?
I. A debt ratio of 50% rather than 20%
II. A debt ratio of 20% rather than 50%
III. A times-interest-earned of 2.0 rather than 5.0
IV. A times-interest-earned 5.0 rather than 2.0
(A) I and III
(B) I and IV
(C) II and III
(D) II and IV
3.23. All else being equal, which of the following will increase a company’s current
ratio?
(A) An increase in accounts receivable.
(B) An increase in accounts payable.
(C) An increase in net fixed assets.
(D) A decrease in long-term debt.
3.24. Mini-Case: The information about Microsoft, given earlier in this chapter, is quite
old. You have just found a good position in the finance department at Microsoft, at their
headquarters office in Redmond, WA. Your first assignment is to find the current values
of the financial ratios. You should focus on the ratios related to the short-term financial
management of the company. Do you find any significant changes in these values,
compared to the numbers for 2001? Comment on the significance of these changes.
60