Downloaded 734 times

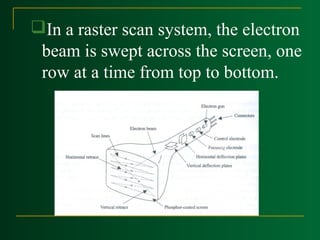
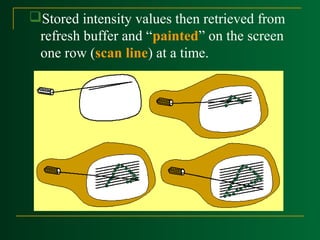
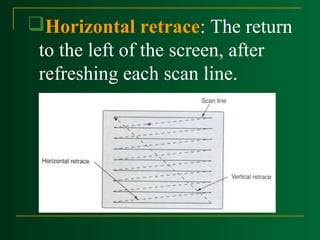
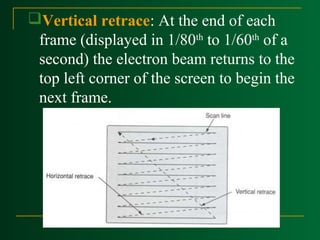

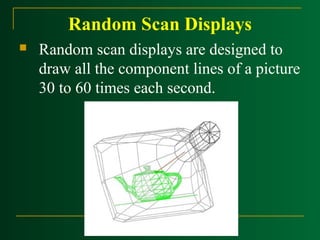

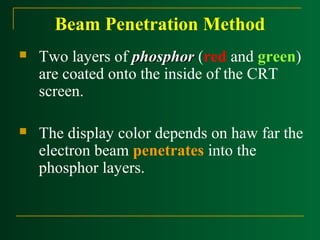

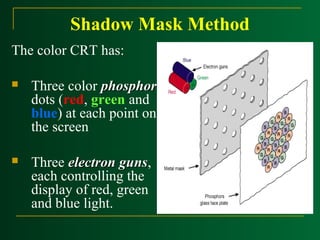
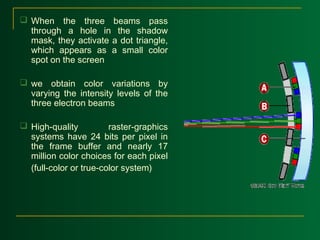


Raster scan displays work by sweeping an electron beam across the screen one row at a time, turning the beam on and off to illuminate spots and form an image. The intensity values for each screen point are stored in a refresh buffer and then retrieved to paint the image on the screen. Refresh rates are typically 60-80 frames per second. Random scan displays draw images using geometric primitives and store picture definitions as drawing commands in a refresh display file. Color CRT monitors use either beam penetration or a shadow mask method to display color images by emitting light from red, green, and blue phosphor dots.