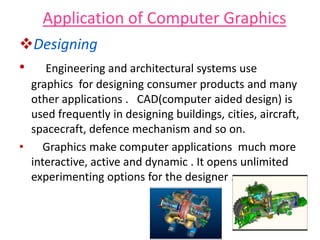
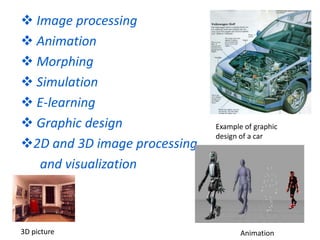
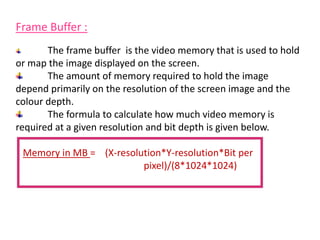
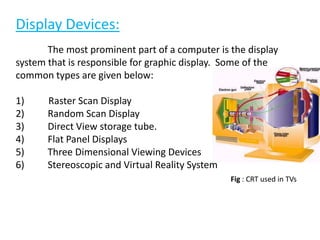
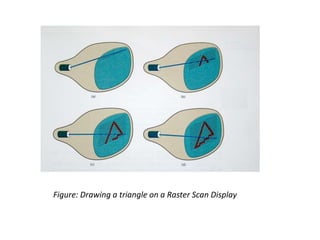
This document provides an introduction to computer graphics. It defines computer graphics as the creation, storage, and manipulation of pictures and drawings using digital computers. Computer graphics is used across diverse fields such as engineering, medicine, education, entertainment, and more. The document discusses basic terms related to display devices such as pixels, resolution, color depth, and frame buffers. It also describes different types of display devices including raster scan displays, random scan displays, direct view storage tubes, flat panel displays, and stereoscopic displays. Applications of computer graphics such as design, image processing, animation, simulation, and medical imaging are also summarized.
Introduction, graphics primitives :Pixel, resolution, aspect ratio, a frame buffer. Display devices, and applications of computer graphics.
Scan conversion - Line drawing algorithms: Digital Differential Analyzer (DDA), Bresenham’s Circle drawing algorithms: DDA, Bresenham’s, and Midpoint.
Computer Graphics and its applications, Elements of a Graphics, Graphics Systems: Video Display Devices, Raster Scan Systems, Random Scan Systems, Input devices.
: Introduction of Rendering, Raytracing, Antialiasing, Fractals
State of ICS and IoT Cyber Threat Landscape Report 2024 previewPrayukth K V
The IoT and OT threat landscape report has been prepared by the Threat Research Team at Sectrio using data from Sectrio, cyber threat intelligence farming facilities spread across over 85 cities around the world. In addition, Sectrio also runs AI-based advanced threat and payload engagement facilities that serve as sinks to attract and engage sophisticated threat actors, and newer malware including new variants and latent threats that are at an earlier stage of development.
The latest edition of the OT/ICS and IoT security Threat Landscape Report 2024 also covers:
State of global ICS asset and network exposure
Sectoral targets and attacks as well as the cost of ransom
Global APT activity, AI usage, actor and tactic profiles, and implications
Rise in volumes of AI-powered cyberattacks
Major cyber events in 2024
Malware and malicious payload trends
Cyberattack types and targets
Vulnerability exploit attempts on CVEs
Attacks on counties – USA
Expansion of bot farms – how, where, and why
In-depth analysis of the cyber threat landscape across North America, South America, Europe, APAC, and the Middle East
Why are attacks on smart factories rising?
Cyber risk predictions
Axis of attacks – Europe
Systemic attacks in the Middle East
Download the full report from here:
https://sectrio.com/resources/ot-threat-landscape-reports/sectrio-releases-ot-ics-and-iot-security-threat-landscape-report-2024/
Builder.ai Founder Sachin Dev Duggal's Strategic Approach to Create an Innova...Ramesh Iyer
In today's fast-changing business world, Companies that adapt and embrace new ideas often need help to keep up with the competition. However, fostering a culture of innovation takes much work. It takes vision, leadership and willingness to take risks in the right proportion. Sachin Dev Duggal, co-founder of Builder.ai, has perfected the art of this balance, creating a company culture where creativity and growth are nurtured at each stage.
JMeter webinar - integration with InfluxDB and GrafanaRTTS
Watch this recorded webinar about real-time monitoring of application performance. See how to integrate Apache JMeter, the open-source leader in performance testing, with InfluxDB, the open-source time-series database, and Grafana, the open-source analytics and visualization application.
In this webinar, we will review the benefits of leveraging InfluxDB and Grafana when executing load tests and demonstrate how these tools are used to visualize performance metrics.
Length: 30 minutes
Session Overview
-------------------------------------------
During this webinar, we will cover the following topics while demonstrating the integrations of JMeter, InfluxDB and Grafana:
- What out-of-the-box solutions are available for real-time monitoring JMeter tests?
- What are the benefits of integrating InfluxDB and Grafana into the load testing stack?
- Which features are provided by Grafana?
- Demonstration of InfluxDB and Grafana using a practice web application
To view the webinar recording, go to:
https://www.rttsweb.com/jmeter-integration-webinar
Connector Corner: Automate dynamic content and events by pushing a buttonDianaGray10
Here is something new! In our next Connector Corner webinar, we will demonstrate how you can use a single workflow to:
Create a campaign using Mailchimp with merge tags/fields
Send an interactive Slack channel message (using buttons)
Have the message received by managers and peers along with a test email for review
But there’s more:
In a second workflow supporting the same use case, you’ll see:
Your campaign sent to target colleagues for approval
If the “Approve” button is clicked, a Jira/Zendesk ticket is created for the marketing design team
But—if the “Reject” button is pushed, colleagues will be alerted via Slack message
Join us to learn more about this new, human-in-the-loop capability, brought to you by Integration Service connectors.
And...
Speakers:
Akshay Agnihotri, Product Manager
Charlie Greenberg, Host
Accelerate your Kubernetes clusters with Varnish CachingThijs Feryn
A presentation about the usage and availability of Varnish on Kubernetes. This talk explores the capabilities of Varnish caching and shows how to use the Varnish Helm chart to deploy it to Kubernetes.
This presentation was delivered at K8SUG Singapore. See https://feryn.eu/presentations/accelerate-your-kubernetes-clusters-with-varnish-caching-k8sug-singapore-28-2024 for more details.
Search and Society: Reimagining Information Access for Radical FuturesBhaskar Mitra
The field of Information retrieval (IR) is currently undergoing a transformative shift, at least partly due to the emerging applications of generative AI to information access. In this talk, we will deliberate on the sociotechnical implications of generative AI for information access. We will argue that there is both a critical necessity and an exciting opportunity for the IR community to re-center our research agendas on societal needs while dismantling the artificial separation between the work on fairness, accountability, transparency, and ethics in IR and the rest of IR research. Instead of adopting a reactionary strategy of trying to mitigate potential social harms from emerging technologies, the community should aim to proactively set the research agenda for the kinds of systems we should build inspired by diverse explicitly stated sociotechnical imaginaries. The sociotechnical imaginaries that underpin the design and development of information access technologies needs to be explicitly articulated, and we need to develop theories of change in context of these diverse perspectives. Our guiding future imaginaries must be informed by other academic fields, such as democratic theory and critical theory, and should be co-developed with social science scholars, legal scholars, civil rights and social justice activists, and artists, among others.
UiPath Test Automation using UiPath Test Suite series, part 4DianaGray10
Welcome to UiPath Test Automation using UiPath Test Suite series part 4. In this session, we will cover Test Manager overview along with SAP heatmap.
The UiPath Test Manager overview with SAP heatmap webinar offers a concise yet comprehensive exploration of the role of a Test Manager within SAP environments, coupled with the utilization of heatmaps for effective testing strategies.
Participants will gain insights into the responsibilities, challenges, and best practices associated with test management in SAP projects. Additionally, the webinar delves into the significance of heatmaps as a visual aid for identifying testing priorities, areas of risk, and resource allocation within SAP landscapes. Through this session, attendees can expect to enhance their understanding of test management principles while learning practical approaches to optimize testing processes in SAP environments using heatmap visualization techniques
What will you get from this session?
1. Insights into SAP testing best practices
2. Heatmap utilization for testing
3. Optimization of testing processes
4. Demo
Topics covered:
Execution from the test manager
Orchestrator execution result
Defect reporting
SAP heatmap example with demo
Speaker:
Deepak Rai, Automation Practice Lead, Boundaryless Group and UiPath MVP
PHP Frameworks: I want to break free (IPC Berlin 2024)Ralf Eggert
In this presentation, we examine the challenges and limitations of relying too heavily on PHP frameworks in web development. We discuss the history of PHP and its frameworks to understand how this dependence has evolved. The focus will be on providing concrete tips and strategies to reduce reliance on these frameworks, based on real-world examples and practical considerations. The goal is to equip developers with the skills and knowledge to create more flexible and future-proof web applications. We'll explore the importance of maintaining autonomy in a rapidly changing tech landscape and how to make informed decisions in PHP development.
This talk is aimed at encouraging a more independent approach to using PHP frameworks, moving towards a more flexible and future-proof approach to PHP development.
Transcript: Selling digital books in 2024: Insights from industry leaders - T...BookNet Canada
The publishing industry has been selling digital audiobooks and ebooks for over a decade and has found its groove. What’s changed? What has stayed the same? Where do we go from here? Join a group of leading sales peers from across the industry for a conversation about the lessons learned since the popularization of digital books, best practices, digital book supply chain management, and more.
Link to video recording: https://bnctechforum.ca/sessions/selling-digital-books-in-2024-insights-from-industry-leaders/
Presented by BookNet Canada on May 28, 2024, with support from the Department of Canadian Heritage.
Essentials of Automations: Optimizing FME Workflows with ParametersSafe Software
Are you looking to streamline your workflows and boost your projects’ efficiency? Do you find yourself searching for ways to add flexibility and control over your FME workflows? If so, you’re in the right place.
Join us for an insightful dive into the world of FME parameters, a critical element in optimizing workflow efficiency. This webinar marks the beginning of our three-part “Essentials of Automation” series. This first webinar is designed to equip you with the knowledge and skills to utilize parameters effectively: enhancing the flexibility, maintainability, and user control of your FME projects.
Here’s what you’ll gain:
- Essentials of FME Parameters: Understand the pivotal role of parameters, including Reader/Writer, Transformer, User, and FME Flow categories. Discover how they are the key to unlocking automation and optimization within your workflows.
- Practical Applications in FME Form: Delve into key user parameter types including choice, connections, and file URLs. Allow users to control how a workflow runs, making your workflows more reusable. Learn to import values and deliver the best user experience for your workflows while enhancing accuracy.
- Optimization Strategies in FME Flow: Explore the creation and strategic deployment of parameters in FME Flow, including the use of deployment and geometry parameters, to maximize workflow efficiency.
- Pro Tips for Success: Gain insights on parameterizing connections and leveraging new features like Conditional Visibility for clarity and simplicity.
We’ll wrap up with a glimpse into future webinars, followed by a Q&A session to address your specific questions surrounding this topic.
Don’t miss this opportunity to elevate your FME expertise and drive your projects to new heights of efficiency.
Software Delivery At the Speed of AI: Inflectra Invests In AI-Powered QualityInflectra
In this insightful webinar, Inflectra explores how artificial intelligence (AI) is transforming software development and testing. Discover how AI-powered tools are revolutionizing every stage of the software development lifecycle (SDLC), from design and prototyping to testing, deployment, and monitoring.
Learn about:
• The Future of Testing: How AI is shifting testing towards verification, analysis, and higher-level skills, while reducing repetitive tasks.
• Test Automation: How AI-powered test case generation, optimization, and self-healing tests are making testing more efficient and effective.
• Visual Testing: Explore the emerging capabilities of AI in visual testing and how it's set to revolutionize UI verification.
• Inflectra's AI Solutions: See demonstrations of Inflectra's cutting-edge AI tools like the ChatGPT plugin and Azure Open AI platform, designed to streamline your testing process.
Whether you're a developer, tester, or QA professional, this webinar will give you valuable insights into how AI is shaping the future of software delivery.
2. What is computer graphics?
Computer graphics refers to the creation, storage
and manipulation of pictures and drawings using
digital computers
Used in diverse fields to represent data .
Scientific researches, engineering applications,
medicine, business, industry, government, art,
entertainment, advertising, education and other
fields make use of computer graphics.
It enhances the communication between computers
and users.
3. Application of Computer Graphics
Designing
• Engineering and architectural systems use
graphics for designing consumer products and many
other applications . CAD(computer aided design) is
used frequently in designing buildings, cities, aircraft,
spacecraft, defence mechanism and so on.
• Graphics make computer applications much more
interactive, active and dynamic . It opens unlimited
experimenting options for the designer .
4. Image processing
Animation
Morphing
Simulation
E-learning
Graphic design
2D and 3D image processing
and visualization
Example of graphic
design of a car
3D picture Animation
6. Game Industry
• The newest driving force in CG
•Focus on interactivity
•Cost effective solutions
•Avoiding commutating and other tricks
•Games drive the baseline
Medical Imaging and Scientific
Visualization
•Tools for teaching and diagnosis
•New data representations and modalities
•Drive issues of precision and correctness
•Focus on presentation and interpretation
of data
•Construction of models from acquired
data
7. Basic terms related to display devices:
•Pixel: A pixel is defined as the smallest size object or colour spot
that can be displayed and addressed on a monitor. Pixels are
normally arranged in a regular 2-dimensional grid, and are often
represented using dots or squares.
•Resolution: They are two types
1) Image Resolution: It refers to pixel spacing. In
normal PC monitor it ranges between 25 to 80 pixels per inch.
2) Screen Resolution: It is the number of
distinct pixels in each dimension that can be displayed.
•Dot: The internal surface of the coated monitor screen is
arranged into millions of tint cells(red, green, blue) called Dots.
8. •Dot pitch: It is the distance between any two dots of the same
colour. It is the measure of screen resolution. Smaller the dot
pitch, higher will be the resolution, sharpness and detailed.
Note: If the image resolution is more compared to the
inherent resolution, then the displayed image quality gets
reduced.
•Aspect ratio: It is the ratio of the number of X pixels to the Y
pixels. The standard aspect ratio for PCs is 4:3 and 5:4.
Note: 5:4 aspect ratio distorts the image a bit.
9. Resolution Number of
Pixels
Aspect Ratio
320*200 64000 8:5
640*480 307200 4:3
800*600 480000 4:3
1024*768 786432 4:3
1280*1024 1310720 5:4
1600*1200 1920000 4:3
Table 1: Common resolution, respective number of pixels and standard aspect
ratios.
10. Bit Planes, Colour Depth and Colour Palette
The appearance and colour of a pixel of an image is
result of interaction of three primary colour.
When the intensity of all the 3 electron beam is high it
results in a white pixel.
When the intensity of all the 3 electron beam is low it
results in a black pixel.
When the intensity of all the 3 electron beam is in any
other combination it results in a intermediate coloured pixel.
NOTE:
11. •Colour Depth: The number of memory bits required to store
colour information(intensity value for all three primary colour
component) about a pixel is called colour depth or bit depth.
Corresponding to the intensity value 0 or 1,pixel can be black or
white.
•Bit plane or bitmap: The block of memory which stores bi-
level intensity values for each pixel of a full screen pure black and
white image is called a bit map or bit plane.
NOTE:
Colour or grey levels can be achieved using additional bit planes. Hence n-
bits per pixel means colour depth=n and it is a collection of n bit planes allowing 2^n
colours at every pixel.
12. Figure: For colour depth=n, n number of bit planes are used, each
bit plane contribute to the gray shade of pixel.
13. Note:
The more the number of bits used per pixel, the finer the colour detail of
the image. However more memory is used for storage.
Colour Depth Number of
Displayed colour
Bytes of Storage
Per Pixel
Common Name
for Colour Depth
4-Bit 16 0.5 Standard VGA
8-Bit 256 1.0 256-Colour Mode
16-Bit 65536 2.0 High Colour
24-Bit 1,67,77,216 3.0 True Colour
Table: Common colour depths used in PCs
14. For True Colour three bytes of information is used- Red,
Green and Blue .
A byte can hold 256 different values and so 256 voltage
settings are possible for each electron.
Hence each primary colour has 256 intensities.
16 million colour possibilities.
True colour is necessary for doing high quality photo-
editing, graphical design etc.
Primary Colours
True colour:
15. Figure: For Bit depth = 24 (true colour display) , 8 bit planes used for
storing each primary colour component ;of the colour value of a pixel
16. For High Colour two bytes of information are used to store
the intensity values for all three colours.
This is done by dividing 16 bits into 5 bits for blue 5 bits for
red and 6 bits for green.
Hence it has reduced colour precision and loss of visible
picture quality.
It is sometimes preferred as it uses 33% less memory than in
true colour.
256-Colour Mode:
In 265-colour mode the PC uses only 8 bits.
It may use 2 bits for blue, 3 bits for green and red.
There is chances that most of the colours of a picture are
not present.
In such cases we use a palette or look-up table.
High Colour:
17. Palette or Look-up table:
A palette or look-up table is a separate memory block
created containing 256 different colours.
The intensity values stored therein are not constrained
within the range of 0-3 for blue and 0-7 for red and green.
The intensity value finally results in having intensity 0-
256 each.
It is an excellent compromise at the cost of moderate
increase in memory.
It can be reloaded any time with different colour
combination.
18. Frame Buffer :
The frame buffer is the video memory that is used to hold
or map the image displayed on the screen.
The amount of memory required to hold the image
depend primarily on the resolution of the screen image and the
colour depth.
The formula to calculate how much video memory is
required at a given resolution and bit depth is given below.
Memory in MB = (X-resolution*Y-resolution*Bit per
pixel)/(8*1024*1024)
19. Display Devices:
The most prominent part of a computer is the display
system that is responsible for graphic display. Some of the
common types are given below:
1) Raster Scan Display
2) Random Scan Display
3) Direct View storage tube.
4) Flat Panel Displays
5) Three Dimensional Viewing Devices
6) Stereoscopic and Virtual Reality System
Fig : CRT used in TVs
20. Raster Scan Display and Random Scan Display:
Basically there are two types of CRT’s- Raster Scan type and
Random Scan type.
The main difference between the two is the technique with
which the image is generated on the phosphor coated CRT screen.
In Raster scan type the electron beam sweeps the entire
screen from left to right, top to bottom, in the same fashion as we
write on a notebook, word by word.
In Random Scan type the electronic beam is directed
straightway to the particular point(s) on the screen where the
image has to be produced. This technique is also called vector
drawing or stroke writing or calligraphic display.
23. Though the vector drawn images lack in depth and real-
like colour precision, the random display can work at higher
resolution than raster displays.
The images are sharper and have smooth edges unlike the
jagged lines and edges in raster type.
Direct View Storage Tube :
It is rarely used now-a-days as part of display system.
In DVST there is no refresh buffer; the images are created by
drawing vectors or line segment with relatively slow moving
electron beam.
24. It is one of the display devices in which an electron
flood gun and writing gun is present.
The flood gun floods electrons to a wire grid on which
already the writing gun has written some image.
The electrons from the flood gun will be repelled back
by the negatively charged wire grid which has been charged so
by the writing electron beam.
The part of the wire grid which has not been charged
-ve will allow the electrons to pass through and the electrons
will collide on the screen and produce the image.
Advantages-
1)Refreshing CRT is not required.
2)Complex picture can be displayed in high resolution without
flicker
3)It has flat screen
25. In existence since 1964’s,Flat
panel displays are much
thinner and flatter than
traditional TVs
Flat Panel Display:
It refers to a class of video devices
that have a:-
reduced volume, smaller,thinner,
reduced weight and
reduced power requirements
compared to a standard CRT
Examples are LCD, Plasma display panel, LED
panel and thin CRT.
Current usage:
•Small and big TV monitors
•Pocket video games
•Laptop computers
•Advertisement boards in
elevators and showrooms.
•Portable monitors.
26. Thin/Slim CRT:
To produce a thin CRT, the normal CRT is reduced by
bending it in the middle.
The deflection apparatus is modified so that electron
beams can be bend through 90 degrees to focus on the screen
and at the same time can be steered up and down and across the
screen.
Fig:
Thin CRT from Candescent Technologies
27. LCD(LIQUID CRISTAL DISPLAY)
LCD consists of a layer of liquid crystal, sandwiched
between two polarized plates.
The polarizers are aligned perpendicular to each other, so
that light incident on the first polarizer will be blocked by the
second.
The LCD displays are addressed in a matrix fashion.
Rows and Columns are defined by a thin layer of vertical
transparent conductors.
The intersection of the two conductors defines a
pixel position.
28. Figure: There are two thin films of polarizer
glued on both sides of the glass. The purpose
of the polarizer is to allow the right amount of
backlight to pass through it in order to have a
proper display.
29. The liquid crystal material is made up of long
rod shaped crystalline molecules containing cynobiphenyl units.
The individual polar molecules in a nematic LC layer
are normally arranged in a spiral fashion.
Light from an internal source enters the first
polarizer(say horizontal) and is polarized accordingly. As the light
passes through the LC layer it is twisted 90 degrees.
NOTE : The light entering through the front polarizer is not allowed to pass
through the rear polarizer due to mismatch of polarization direction.
The result is ZERO reflection of light and hence the LCD appears black.
In a color LCD there are layers of 3 liquid crystal
panels one on top of other. Each one is filled with a color- Red,
Green or Blue liquid crystal.
31. Advantage of 3 layers:
It helps create as many as screen pixels as intersections.
It has high resolution panels.
Each pixel comprises 3 color cells or sub pixel elements.
Comparison between LCD and CRT:
The image painting operation in LCD panel is different
from CRT.
Both are of Raster scan type.
FIG: LCD and CRT
32. Plasma Panel :
Here a layer of gas usually neon is sandwiched between
two glass plates.
Thin vertical strips of conductor run across one plate,
while horizontal conductors run up and down the other plate.
By applying high voltage to a pair of horizontal and vertical
conductors, a pair of horizontal and vertical conductors, a small
section of gas at the intersection of the conductors breaks down
into glowing plasma of electrons and ions.
In the array of gas bulbs, each one can be set to an ‘on’
state or ‘off ‘state by adjusting the voltage of the pair of
conductor.
34. READYMADE IMAGE
SCANNER:
A graphic device which directly copies images from a
paper or photograph and converts it into the digital format for
display, storage and graphic manipulation is called a scanner.
Types of scanner:
1. Drum scanner : They are the high-end scanners.
2. Sheetfed scanner: They are ordinary type scanner.
3. Flatbed scanner: It strikes a balance between the above two
in quality as well as price.
4. Handheld scanner / bar code readers: They are used for
scanning documents in strips of about 4 inches wide by holding
the scanner in one hand and sliding it over the documents.