Download as PDF, PPTX


![Even Numbered Data Sets
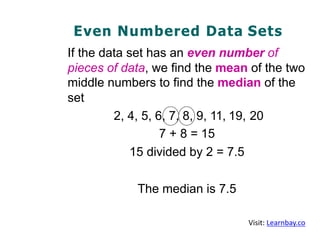
• The median splits the data set in half.
[ 2, 4, 5, 6, 7] 7.5 [8, 9, 11, 19, 20]
• From here we can then find the upper and
lower quartiles as well as the upper and lower
extremes.
Visit: Learnbay.co](https://image.slidesharecdn.com/boxandwhiskerplotswithfivenumbersummary-200812092306/85/Box-and-whisker-plots-with-five-number-summary-13-320.jpg)
![Lower Quartile
• The lower quartile is the median of the bottom
half of the data (to the left of the median).
[ 2, 4, 5, 6, 7] 7.5 [8, 9, 11, 19, 20]
Lower Quartile for this data = 5
Visit: Learnbay.co](https://image.slidesharecdn.com/boxandwhiskerplotswithfivenumbersummary-200812092306/85/Box-and-whisker-plots-with-five-number-summary-14-320.jpg)
![Upper Quartile
• The upper quartile is the median of the top half
of the data (to the right of the median).
[ 2, 4, 5, 6, 7] 7.5 [8, 9, 11, 19, 20]
The upper quartile for this data set = 11
Visit: Learnbay.co](https://image.slidesharecdn.com/boxandwhiskerplotswithfivenumbersummary-200812092306/85/Box-and-whisker-plots-with-five-number-summary-15-320.jpg)
![Interquartile Range
¬ To find the interquartile range, subtract the lower
quartile from the upper quartile.
Upper Quartile – Lower Quartile =
[ 2, 4, 5, 6, 7] 7.5 [8, 9, 11, 19, 20]
11 – 5 =6
The interquartile range for this data = 6
Visit: Learnbay.co](https://image.slidesharecdn.com/boxandwhiskerplotswithfivenumbersummary-200812092306/85/Box-and-whisker-plots-with-five-number-summary-16-320.jpg)
![Lower Extreme
¬ The lower extreme is the lowest number in the
data set.
[ 2, 4, 5, 6, 7] 7.5 [8, 9, 11, 19, 20]
The lower extreme for this data set = 2
Visit: Learnbay.co](https://image.slidesharecdn.com/boxandwhiskerplotswithfivenumbersummary-200812092306/85/Box-and-whisker-plots-with-five-number-summary-17-320.jpg)
![Upper Extreme
¬ The upper extreme is the highest number in the
data set.
[ 2, 4, 5, 6, 7] 7.5 [8, 9, 11, 19, 20]
The upper extreme for this data set = 20
Visit: Learnbay.co](https://image.slidesharecdn.com/boxandwhiskerplotswithfivenumbersummary-200812092306/85/Box-and-whisker-plots-with-five-number-summary-18-320.jpg)
![Range
• The range of the data can be found by
subtracting the lower extreme from the upper
extreme.
[ 2, 4, 5, 6, 7] 7.5 [8, 9, 11, 19, 20]
20 – 2 = 18
The range for this data set = 18
Visit: Learnbay.co](https://image.slidesharecdn.com/boxandwhiskerplotswithfivenumbersummary-200812092306/85/Box-and-whisker-plots-with-five-number-summary-19-320.jpg)
![Even Numbered Data Sets
[ 2, 4, 5, 6, 7] 7.5 [8, 9, 11, 19, 20]
¬ Median = 7.5
¬ Lower Quartile = 5
¬ Upper Quartile = 11
¬ Upper Extreme = 20
¬ Lower Extreme = 2
Visit: Learnbay.co](https://image.slidesharecdn.com/boxandwhiskerplotswithfivenumbersummary-200812092306/85/Box-and-whisker-plots-with-five-number-summary-20-320.jpg)
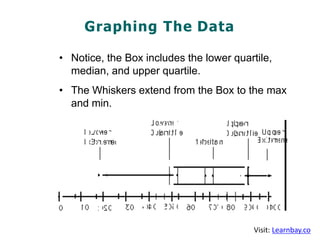
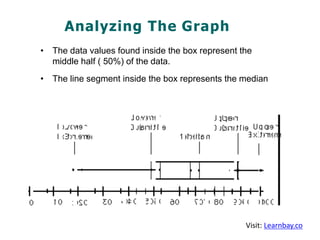
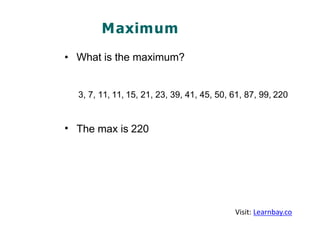

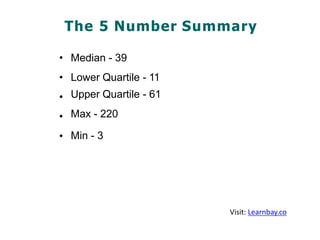


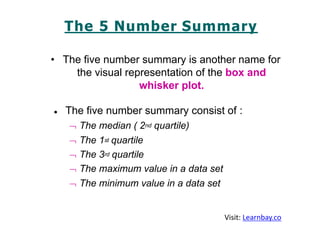
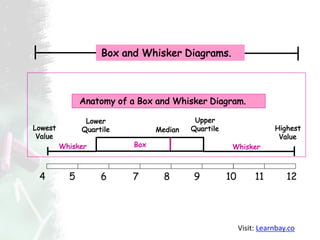
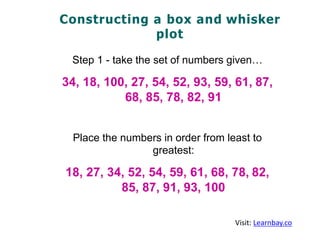
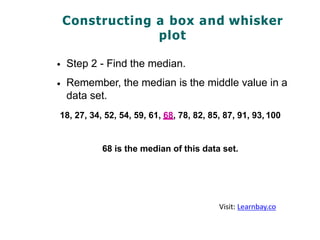
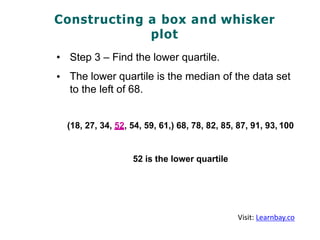
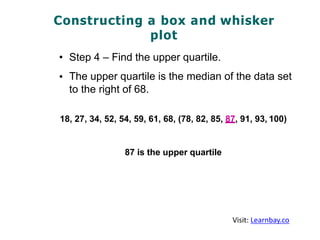
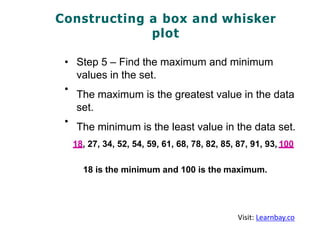
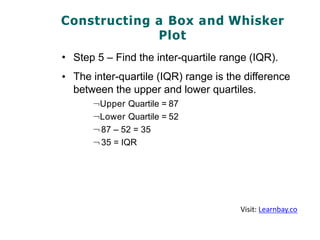
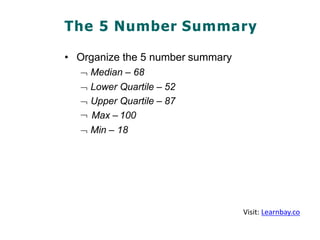
The document discusses box and whisker plots, which summarize data through the five-number summary: median, lower quartile, upper quartile, minimum, and maximum values. It provides a step-by-step guide on constructing these plots using given data sets and explains how to interpret the plots and the information they convey about data distribution. Additionally, it illustrates how to handle even-numbered data sets and perform calculations like the interquartile range and range.