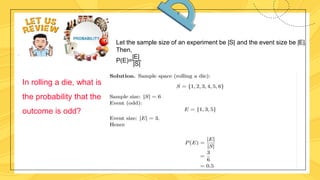
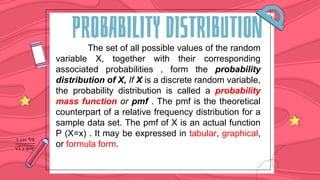
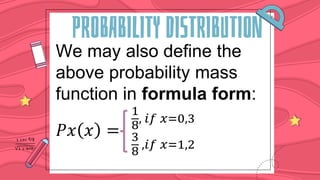
Module 1 - Lesson 1
Random variables and Probabilty
distribution
Statistics and Probability
Jose Karlo Trocio
Guide Questions
● What is random variables?
● What is difference between discrete and
continuous random variable?
● How do we construct probabilty mass function
of a discrete probabilty distribution?
Probability is a measure of chance declared through
reasonable opinion.
Given a random experiment, the set of all possible outcomes is called its sample space. Each
outcome may be referred to as a sample point.
Example: In the experiment of tossing a coin, the sample space is the set
S = {HEADS,TAILS}
and HEADS and TAILS are its two sample points.
In rolling a die, the sample space is
S ={1,2,3,4,5,6}
The event E “odd outcomes” is given by
E ={1,3,5}.
Let the sample size of an experiment be |S| and the event size be |E|.
Then,
P(E)=
|E|
|S|
In rolling a die, what is
the probability that the
outcome is odd?
Let the sample size of an experiment be |S| and the event size be |E|.
Then,
P(E)=
|E|
|S|
Let the sample size of an experiment be |S| and the event size be |E|.
Then,
P(E)=
|E|
|S|
Let the sample size of an experiment be |S| and the event size be |E|.
Then,
P(E)=
|E|
|S|
Let the sample size of an experiment be |S| and the event size be |E|.
Then,
P(E)=
|E|
|S|
Welcome to our Math Mystery Escape Room!!
Here, you will find that Venus has a beautiful
name and is the second planet from the Sun. It’s
terribly hot, even hotter than Mercury, and its
atmosphere is extremely poisonous
About the introduction
Progress:
1
3
2
2
2
1
1
1
0
1
8
1
8
3
8
3
8
Thus, the values of random
variable X are {0,1, 2, & 3}
PROBABILITY DISTRIBUTION
The set of all possible values of the random
variable X, together with their corresponding
associated probabilities , form the probability
distribution of X, If X is a discrete random variable,
the probability distribution is called a probability
mass function or pmf . The pmf is the theoretical
counterpart of a relative frequency distribution for a
sample data set. The pmf of X is an actual function
P (X=x) . It may be expressed in tabular, graphical,
or formula form.
PROBABILITY DISTRIBUTION
Probability Histogram.
Probability Histogram of the Number of Heads
in Tossing Three Coins
0 1 2 3
3
8
2
8
1
8
PROBABILITY DISTRIBUTION
We may also define the
above probability mass
function in formula form:
𝑃𝑥 𝑥 = 3
8
,𝑖𝑓 𝑥=1,2
1
8
, 𝑖𝑓 𝑥=0,3
NOT A DISCRETE RANDOM VARIABLE
DISCRETE RANDOM VARIABLE
She is a very funny Turkish girl. She enjoys reading, playing
with her dogs and visiting her partner every weekend. She
is specially good in psychology and mathematics as she
has a very analytical mind. Her friends describe her as loyal
and loving
This is ana
Progress:
She is a very funny Turkish girl. She enjoys reading, playing
with her dogs and visiting her partner every weekend. She
is specially good in psychology and mathematics as she
has a very analytical mind. Her friends describe her as loyal
and loving
This is ana
Thus, the values of random variable Y are {0,1, 2, 3, 4, & 5}
1
1.2
0
1
2
3
4
5
6
0 1 2 3 4 5
The probability histogram for this expirement is :
Let US SUM IT UP
• A random variable is a discrete random variable if its set of possible
outcomes is countable , such as number of defective chairs produced
in a factory
• A random variable is continuous random variable if it takes a
continuous scale such as heights, weights, and temperature.
Properties of a Probability Distribution
1. The probability of each value of x is a value between 0 and 1.
2. The sum of the probabilities of a value is equal to 1.In symbol,
ΣP(X) = 1.

random variables and probabilty distribution

  • 1.
    Module 1 -Lesson 1 Random variables and Probabilty distribution Statistics and Probability Jose Karlo Trocio
  • 2.
    Guide Questions ● Whatis random variables? ● What is difference between discrete and continuous random variable? ● How do we construct probabilty mass function of a discrete probabilty distribution?
  • 3.
    Probability is ameasure of chance declared through reasonable opinion. Given a random experiment, the set of all possible outcomes is called its sample space. Each outcome may be referred to as a sample point. Example: In the experiment of tossing a coin, the sample space is the set S = {HEADS,TAILS} and HEADS and TAILS are its two sample points. In rolling a die, the sample space is S ={1,2,3,4,5,6} The event E “odd outcomes” is given by E ={1,3,5}.
  • 4.
    Let the samplesize of an experiment be |S| and the event size be |E|. Then, P(E)= |E| |S| In rolling a die, what is the probability that the outcome is odd?
  • 5.
    Let the samplesize of an experiment be |S| and the event size be |E|. Then, P(E)= |E| |S|
  • 6.
    Let the samplesize of an experiment be |S| and the event size be |E|. Then, P(E)= |E| |S|
  • 7.
    Let the samplesize of an experiment be |S| and the event size be |E|. Then, P(E)= |E| |S|
  • 8.
    Let the samplesize of an experiment be |S| and the event size be |E|. Then, P(E)= |E| |S|
  • 10.
    Welcome to ourMath Mystery Escape Room!! Here, you will find that Venus has a beautiful name and is the second planet from the Sun. It’s terribly hot, even hotter than Mercury, and its atmosphere is extremely poisonous About the introduction Progress: 1 3 2 2 2 1 1 1 0 1 8 1 8 3 8 3 8 Thus, the values of random variable X are {0,1, 2, & 3}
  • 11.
    PROBABILITY DISTRIBUTION The setof all possible values of the random variable X, together with their corresponding associated probabilities , form the probability distribution of X, If X is a discrete random variable, the probability distribution is called a probability mass function or pmf . The pmf is the theoretical counterpart of a relative frequency distribution for a sample data set. The pmf of X is an actual function P (X=x) . It may be expressed in tabular, graphical, or formula form.
  • 12.
    PROBABILITY DISTRIBUTION Probability Histogram. ProbabilityHistogram of the Number of Heads in Tossing Three Coins 0 1 2 3 3 8 2 8 1 8
  • 13.
    PROBABILITY DISTRIBUTION We mayalso define the above probability mass function in formula form: 𝑃𝑥 𝑥 = 3 8 ,𝑖𝑓 𝑥=1,2 1 8 , 𝑖𝑓 𝑥=0,3
  • 14.
    NOT A DISCRETERANDOM VARIABLE
  • 15.
  • 16.
    She is avery funny Turkish girl. She enjoys reading, playing with her dogs and visiting her partner every weekend. She is specially good in psychology and mathematics as she has a very analytical mind. Her friends describe her as loyal and loving This is ana Progress:
  • 17.
    She is avery funny Turkish girl. She enjoys reading, playing with her dogs and visiting her partner every weekend. She is specially good in psychology and mathematics as she has a very analytical mind. Her friends describe her as loyal and loving This is ana Thus, the values of random variable Y are {0,1, 2, 3, 4, & 5}
  • 18.
    1 1.2 0 1 2 3 4 5 6 0 1 23 4 5 The probability histogram for this expirement is :
  • 19.
    Let US SUMIT UP • A random variable is a discrete random variable if its set of possible outcomes is countable , such as number of defective chairs produced in a factory • A random variable is continuous random variable if it takes a continuous scale such as heights, weights, and temperature. Properties of a Probability Distribution 1. The probability of each value of x is a value between 0 and 1. 2. The sum of the probabilities of a value is equal to 1.In symbol, ΣP(X) = 1.