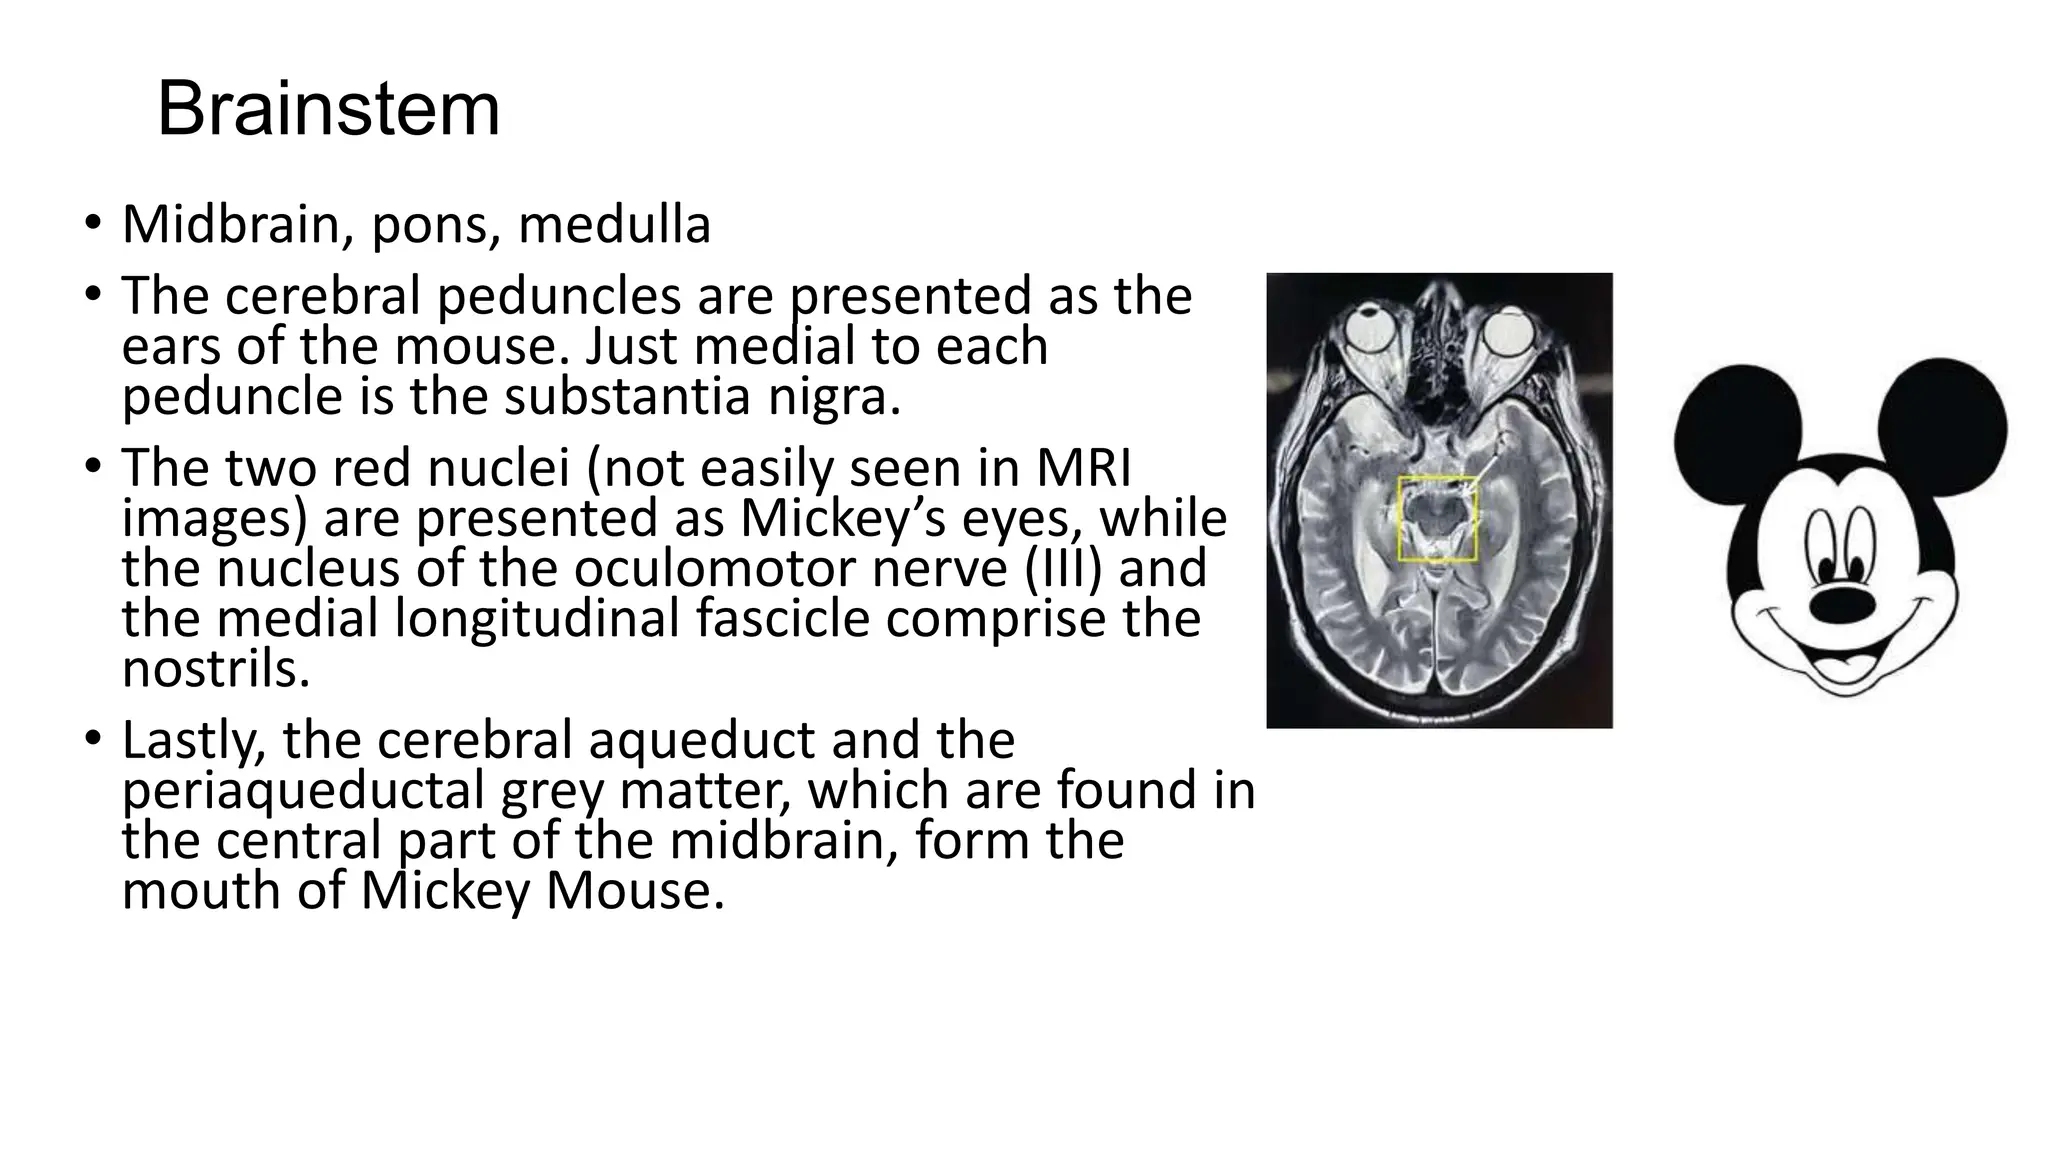
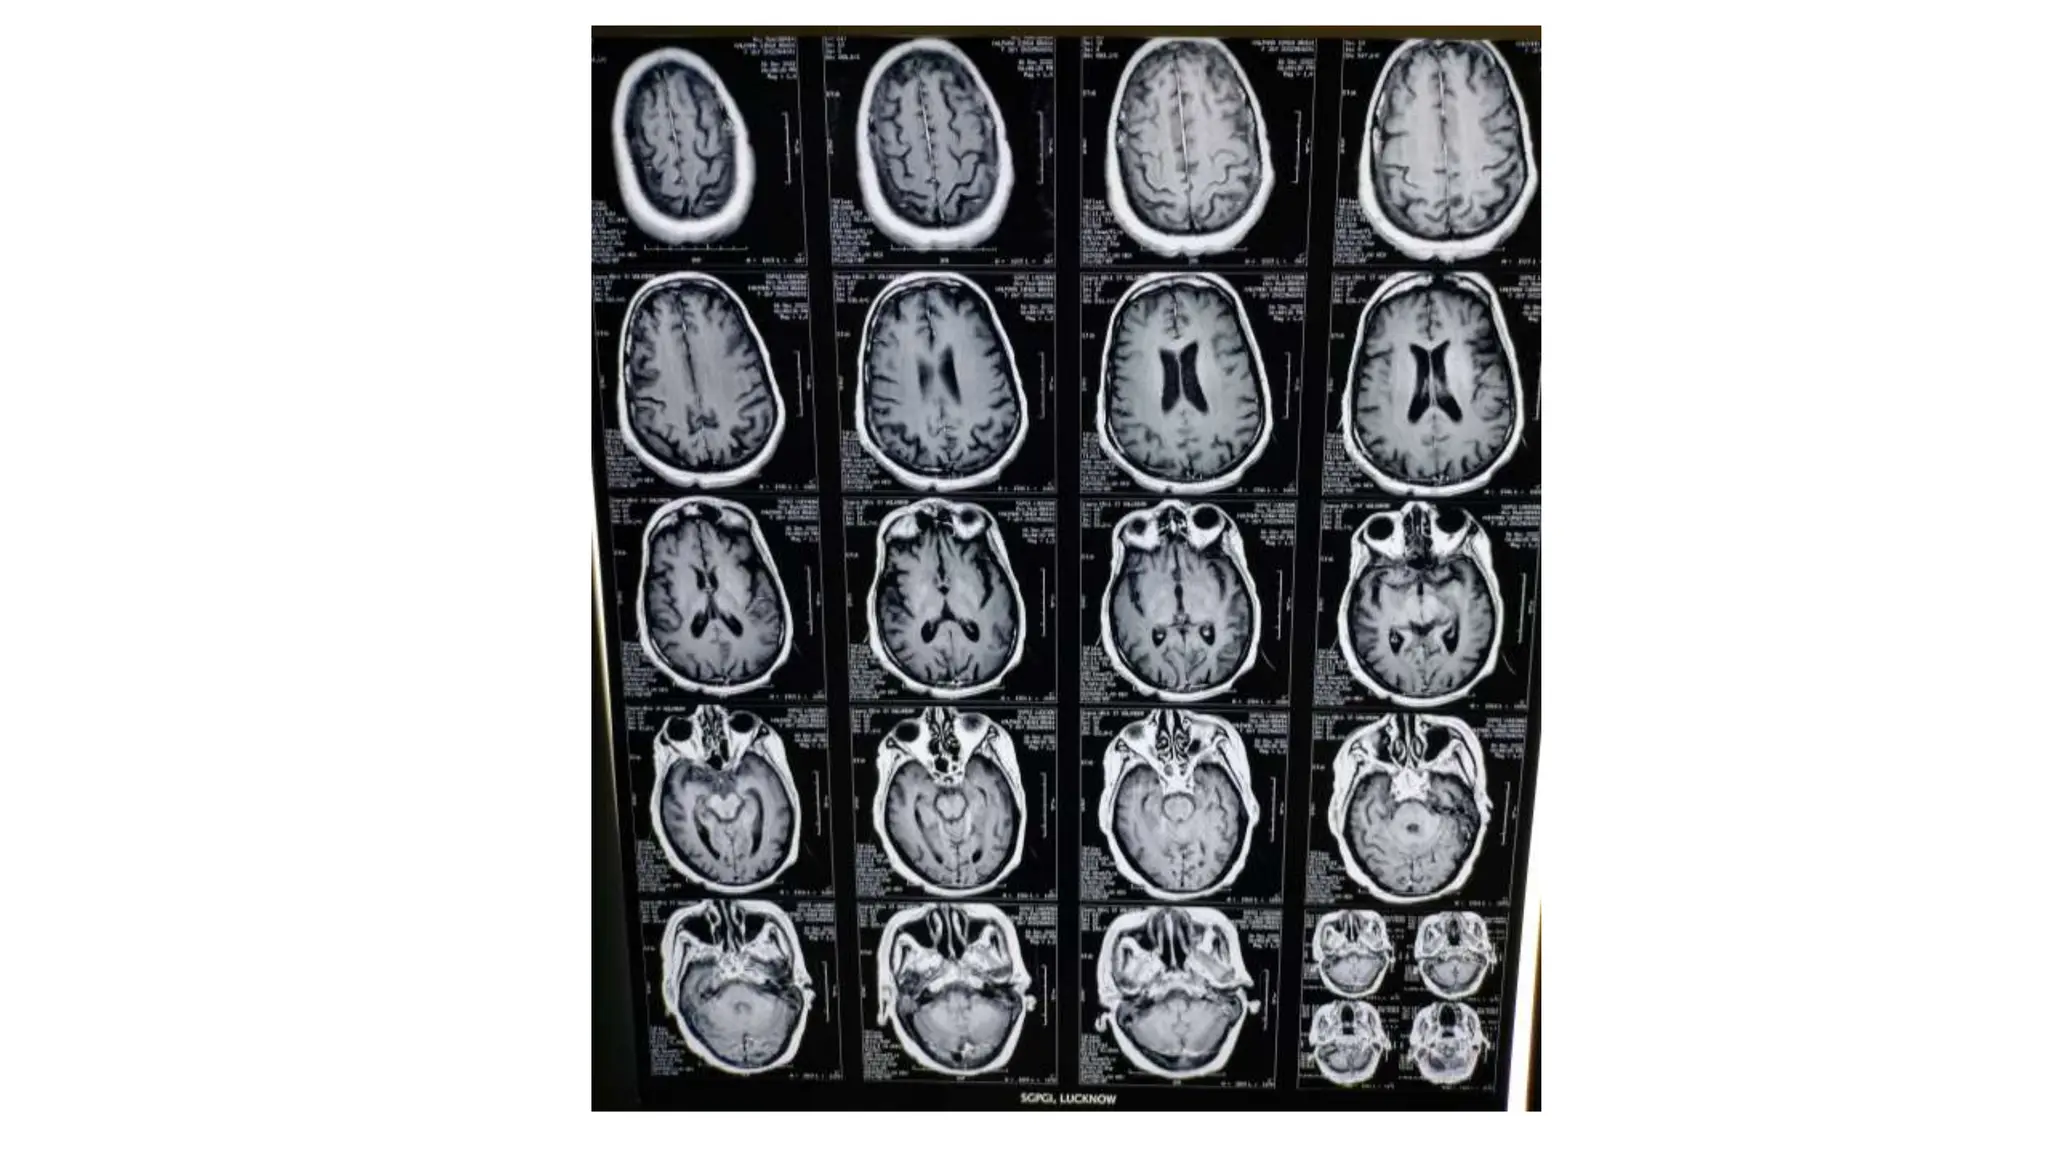
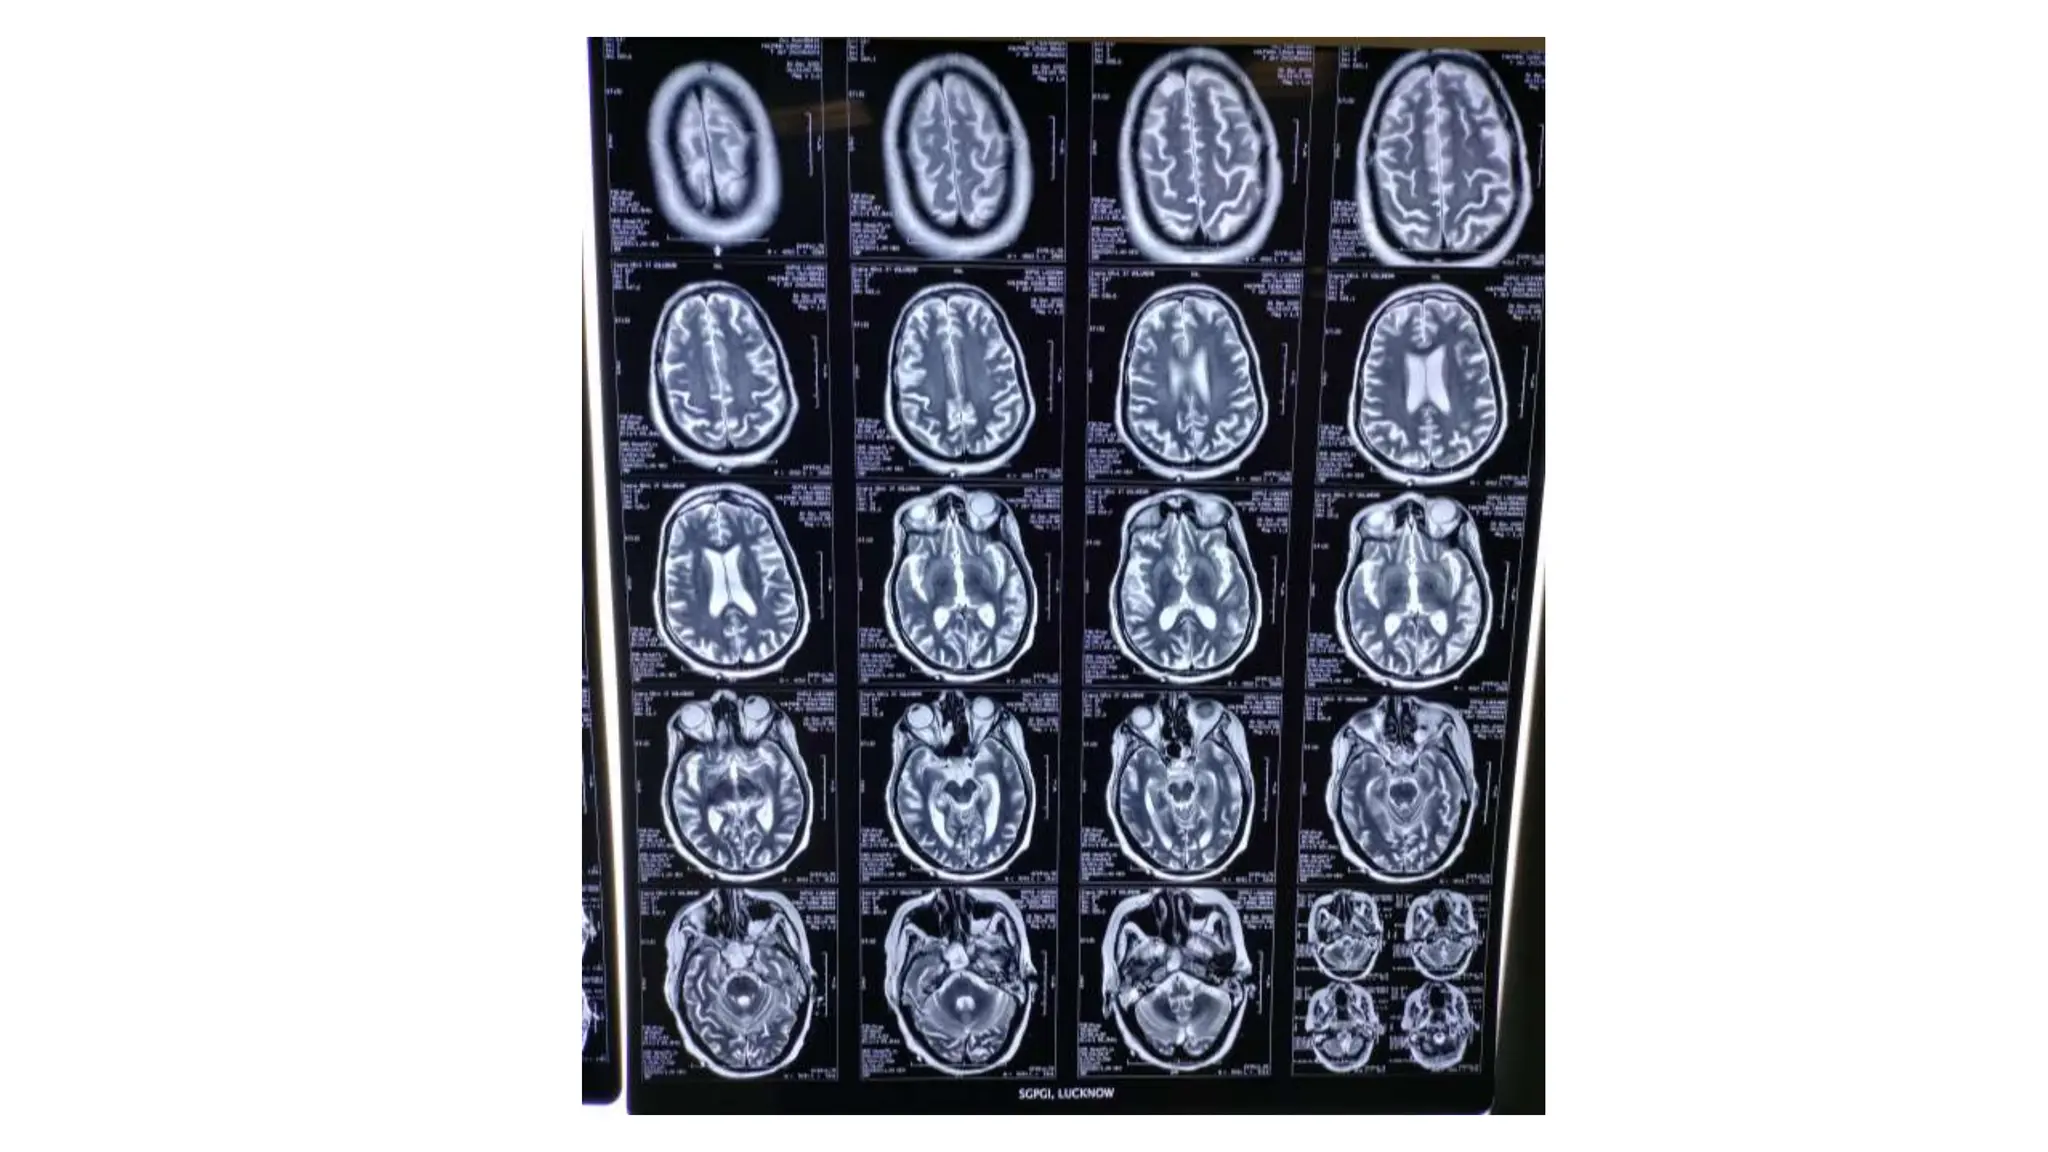
MRI of the brain showed abnormalities in a patient with dengue encephalitis including:
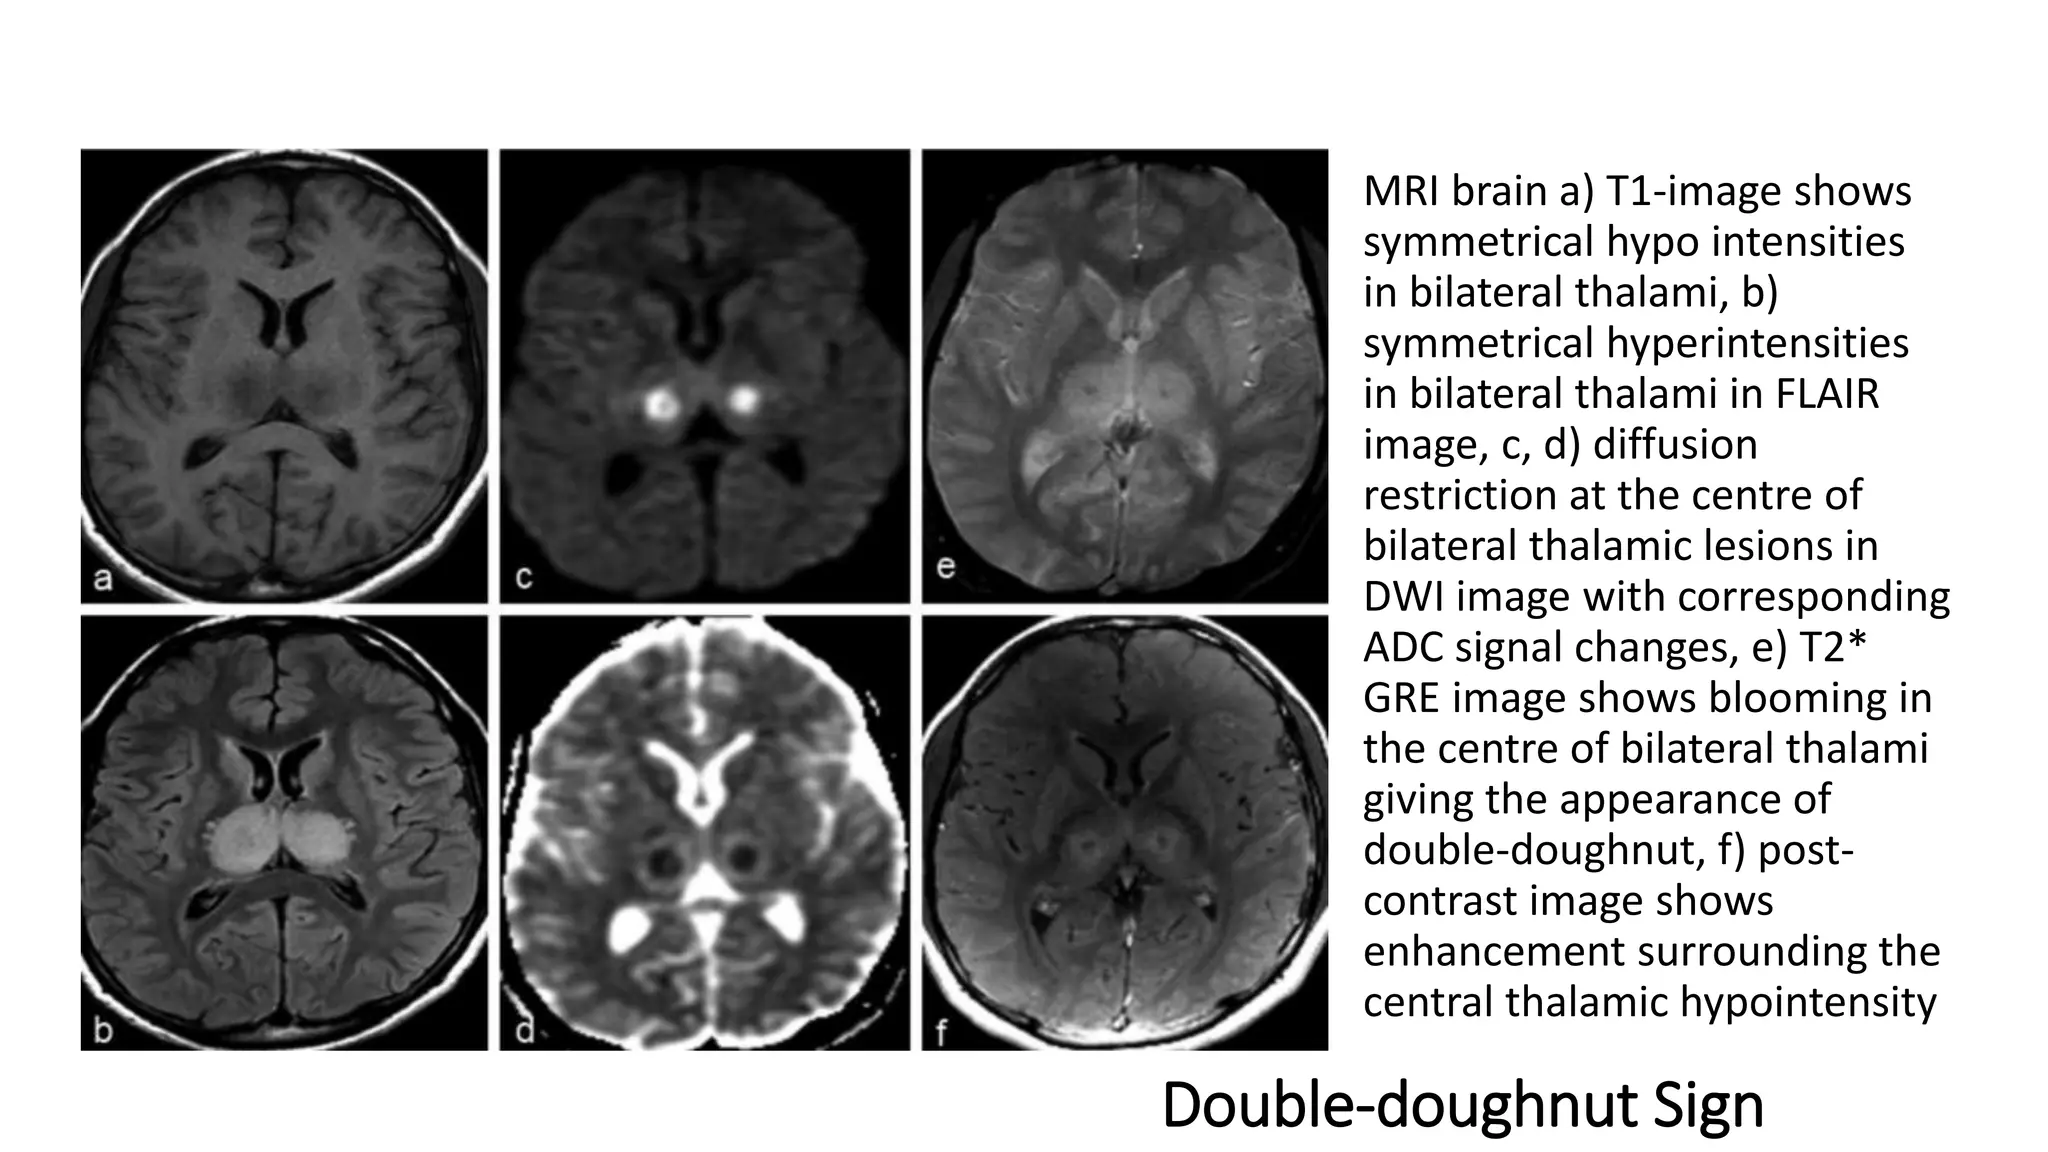
1. Hyperintensities in the bilateral basal ganglia on T1 and T2 FLAIR images.
2. Diffuse areas of diffusion restriction in both cerebral hemispheres, basal ganglia, and caudate nuclei, sparing the thalami and frontal white matter.
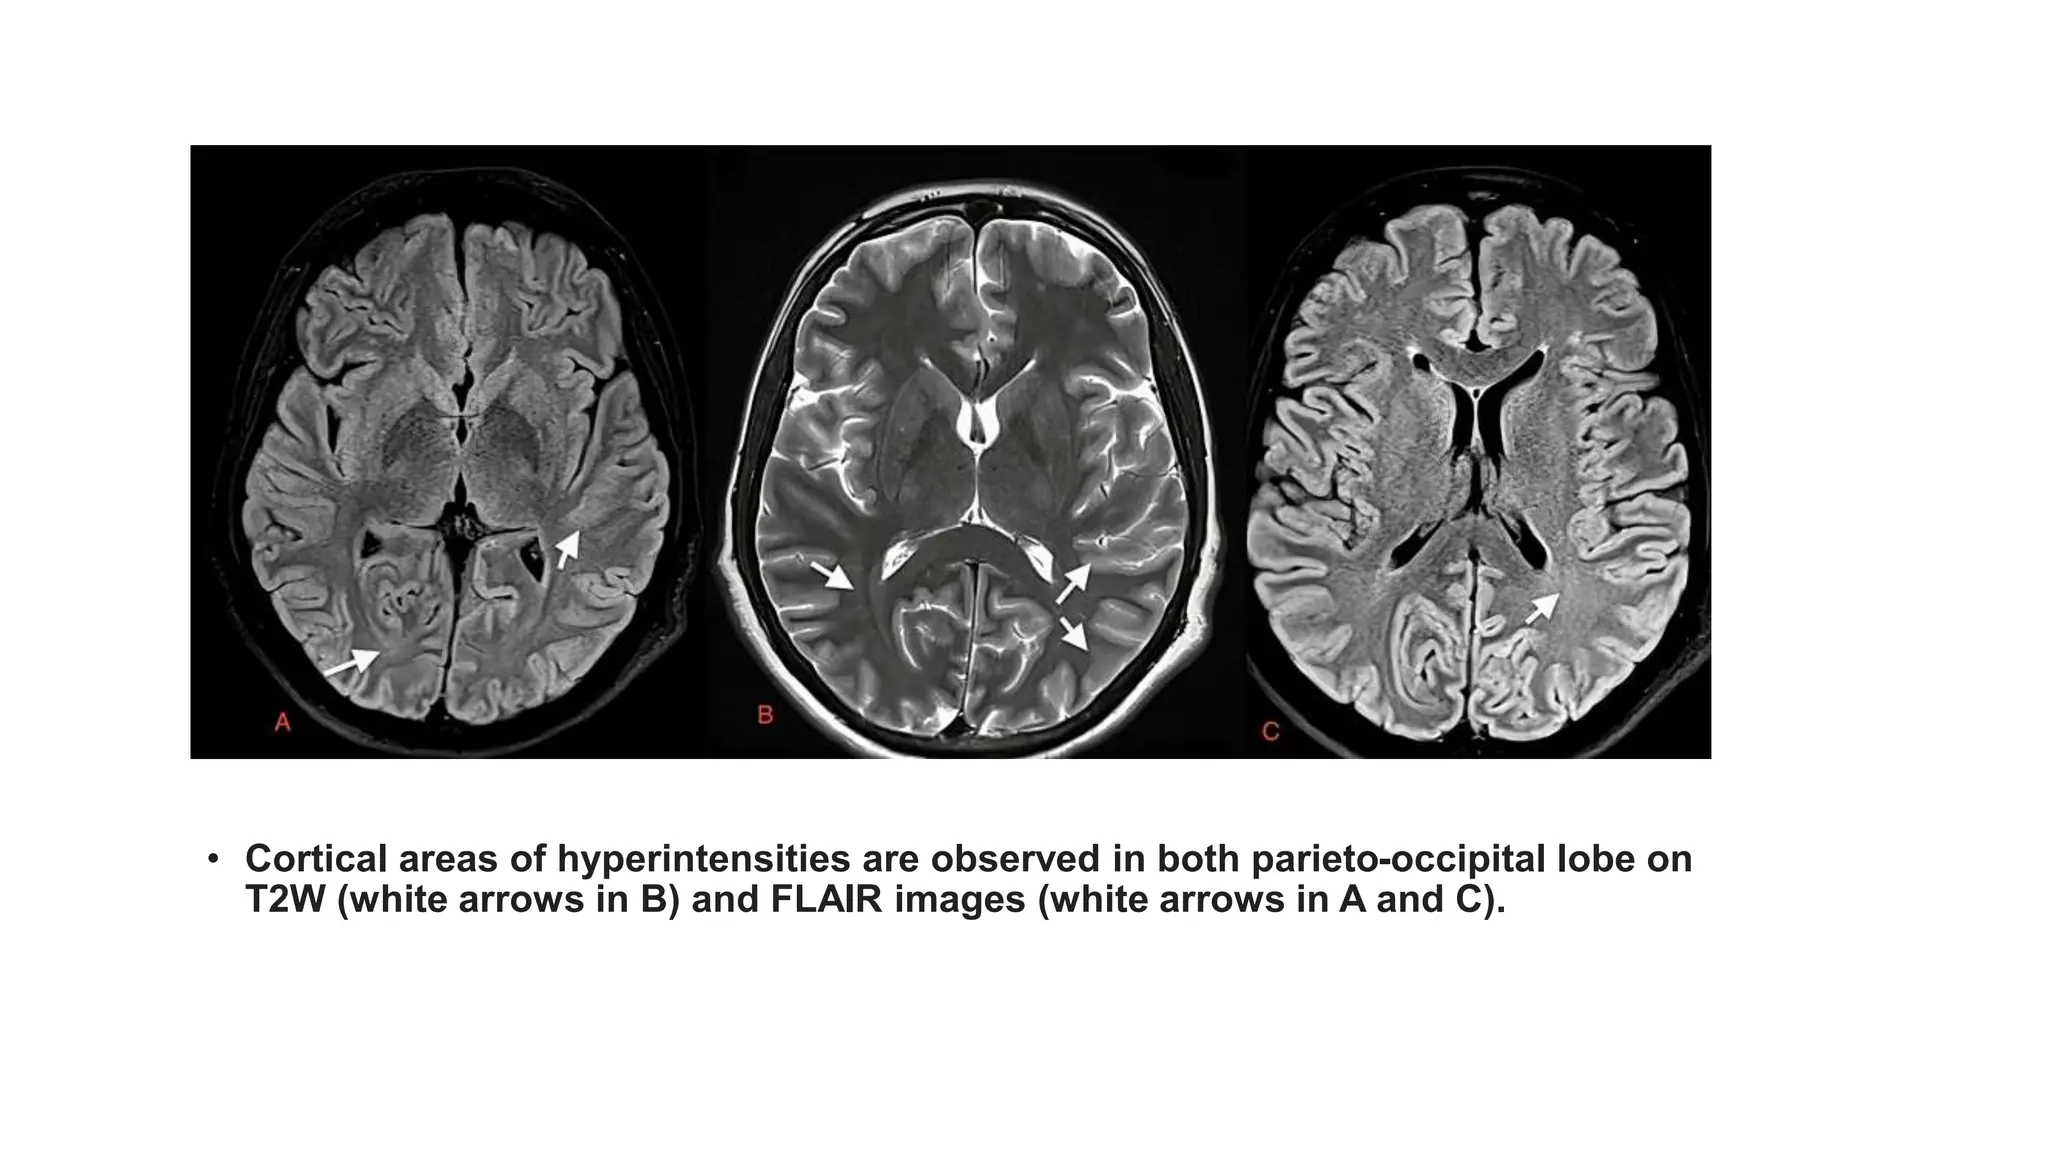
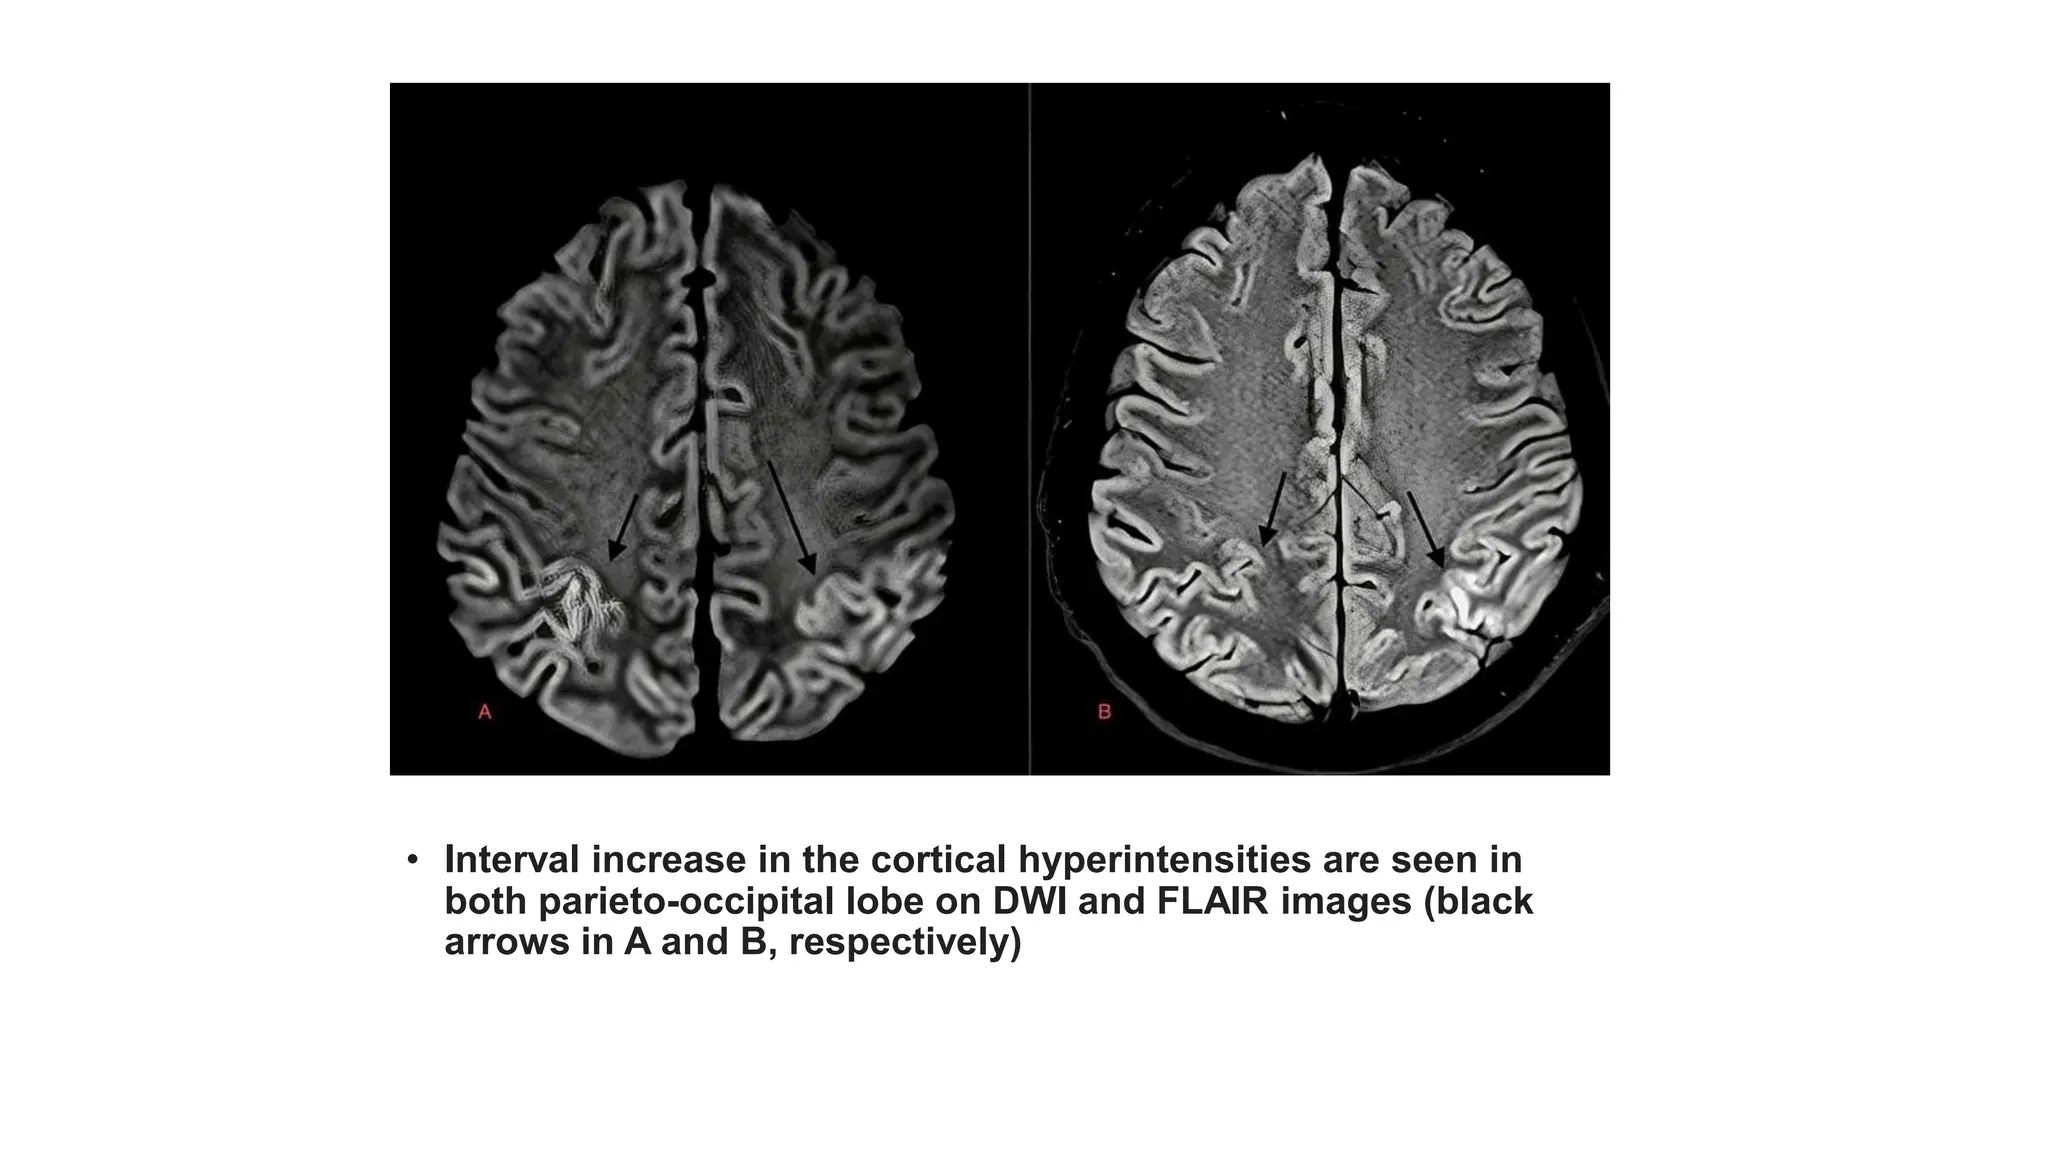
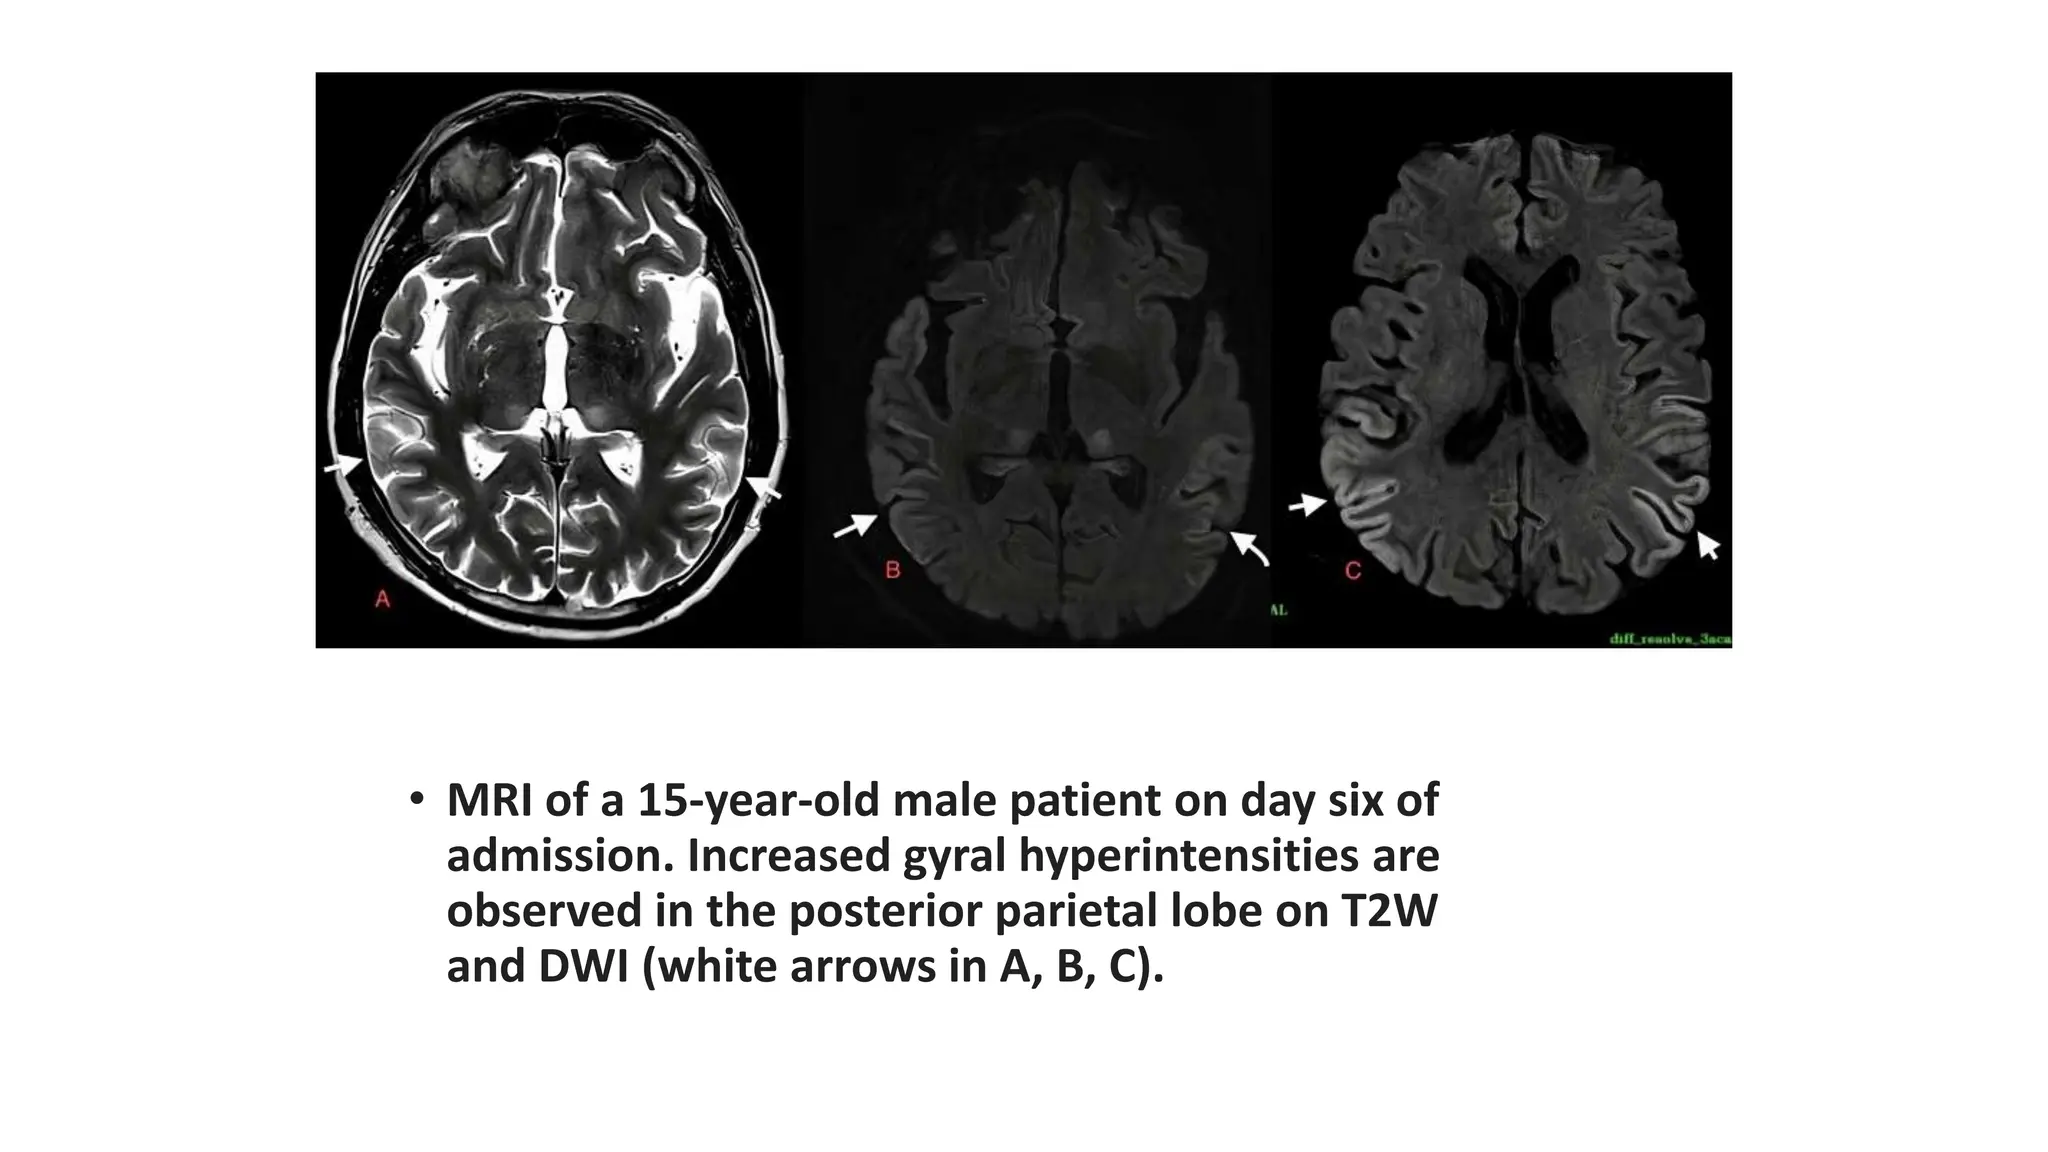
3. Increased cortical hyperintensities over time in the parieto-occipital lobes and thalami.
4. Diffusion restriction and hyperintensities in the pons, thalami, and hippocampi.


![ashish_journal_club[1].pptx](https://cdn.slidesharecdn.com/ss_thumbnails/ashishjournalclub1-230825152847-fcbeeb03-thumbnail.jpg?width=640&height=640&fit=bounds)


