2. investorSCOREcard
Radiant Communications Corp. (RCN-V)
Market Overview and Opportunity
Information technology (IT) has become critical to a business’s success. Establishment and maintenance of a suitable
IT system requires significant capital and human resources as well as licensing expenses that many small and
medium enterprises (SMEs) have difficulty supporting. In this sense, the SME market is largely underserved by
the large telecommunications companies. Radiant has the opportunity to capture a large portion of this market
by offering high quality, reliable IT services for SMEs at a reasonable cost via a single provider. Radiant has already
begun to expand its market reach by growing its portfolio of services and partnering with industry-leading
companies.
Products and Services
Radiant provides businesses with a comprehensive range of IP-based data communications services including
the largest on-net DSL footprint across Canada & the US, T1 and E10/E100 fibre broadband, coupled with
Multiprotocol Label Switching (MPLS), Internet Protocol Security (IPSec), and Secure Sockets Layer (SSL) private
networking. Radiant also delivers cloud computing services connected directly into customers’ private networks.
The cloud computing services include hosting mission-critical applications, disaster recovery/business continuity, and
fully managed Microsoft Exchange.
BroadbandEverywhereTM:
BroadbandEverywhereTM offers a complete range of broadband data communications technologies with
the convenience of a single supplier. Radiant’s BroadbandEverywhereTM provides a variety of connectivity options
including the recently launched SureLink Business Ethernet, Business ADSL, T1 (or Ds1), optical fibre, fixed wireless,
business cable, cellular and failover broadband.
NetGuardTM Private Networking:
NetGuardTM Private Networking offers a combination of major private networking technologies: Multiprotocol Label
Switching (MPLS) and Secure Sockets Layer Virtual Private Network (SSL VPN). Radiant also offers a Managed
Security Service via Internet Protocol Security (IPSec) that creates a VPN over the internet and other public
networks.
AlwaysThereTM Enterprise Cloud Computing:
Radiant offers Cloud Computing services with options such as managed hosting, virtual servers, virtual data centres
and hosted exchanges that can enhance flexibility for business growth and expansion.
3. investorSCOREcard
Radiant Communications Corp. (RCN-V)
Growth Strategy
In the past, Radiant has focused on the national small and medium sized business market, capturing significant
market share by providing a reliable and secure operating environment for business applications at a reasonable
cost. Having established a national service footprint, Radiant is expanding its range of services and solutions
to increase the per location revenue from both new and existing customers.
Radiant entered into an agreement with MTS Allstream Inc. in January 2010, where Radiant and MTS Allstream will
combine resources to offer a new type of broadband service to businesses. More than 300,000 Canadian business
locations across the country will be within the planned service area once the technology is fully deployed. The new
services will allow businesses to cost effectively move up from traditional T1and DSL services to the type of speed
and reliability that today is only available to extremely large users connected to fibre networks. The services will
facilitate the transition to cloud-based applications, new inexpensive voice services, remote back up and disaster
recovery protection, and off site server capacity.
Progress and Milestones
• Entered into a long term Network Investment Agreement with MTS Allstream Inc. in January 2010
to combine resources to offer a new type of broadband service to businesses across Canada
• Commercially launched SureLink, a new Business Ethernet service, and signed up more than 40 new
customers in Q2 2010
• Closed two non-brokered private placements in April 2010 for aggregate gross proceeds of $4.2 million
to be used to fund potential acquisitions and roll-out Ethernet First Mile Equipment across Canada
Investment Highlights
• A single source, cost effective and efficient provider of broadband, private network and cloud computing
services
• Serves more than 4,000customers and has connected more than 20,000 business locations across Canada
and the U.S.
• Entered into an agreement with MTS Allstream, a wholly-owned subsidiary of Manitoba Telecom Services Inc.
to grow its portfolio of services and expand its addressable market
• Strong balance sheet with no debt
• Consistent year-over-year growth
4. investorSCOREcard
Radiant Communications Corp. (RCN-V)
Management
David Buffett
President and CEO, Director
Chuck Leighton
Chief Financial Officer
Adrian Byram
Executive Vice President and CTO
Dale Neilly
Vice President, Sales and Marketing
Thorsten Gutsche
Vice President, Operations
Helen Sheridan
Vice President, People and Culture
Comparables
iWeb Group Inc. (IWB-T)
Peer 1 Network Enterprise, Inc. (PIX-V)
Rackspace Hosting, Inc. (RAX-NYSE)
5. investorSCOREcard
Radiant Communications Corp. (RCN-V)
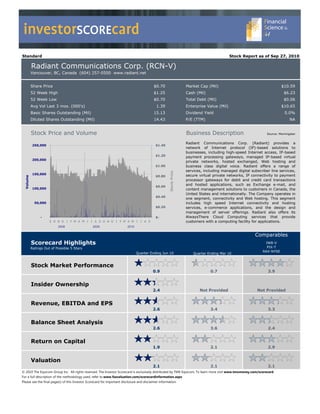
Stock Market Performance Rating 0.9
Stock Market Returns 70,000 $18.00
Return Percentile Rating $16.00
60,000
Three Months (14.6%) 25% 1.3 $14.00
Six Months (30.0%) 12% 0.6 50,000
Stock Price
1 Year (23.9%) 3% 0.2 $12.00
Volume
3 Years (CAGR) (10.0%) 33% 1.6 40,000 $10.00
5 Years (CAGR) (11.9%) 14% 0.7
30,000 $8.00
Market Data $6.00
20,000
Price $0.70
$4.00
Mkt Cap (Mil) $10.59
10,000
Shs Outstanding (Mil) 15.13 $2.00
Dividend Yield % 0.0%
Avg Vol Last 3mos. (000's) 1.39 - $-
2003
2004
2005
2006
2007
2008
2009
2010
P/E (TTM) NA
Insider Ownership Rating 2.4
Value of Shares and Options Percent of Ownership
Shares Options Total Value Rating Percent Rating 10.5% Insiders
* Adjusted 80.9% > 10% Holders
# of # of $ Value if Adjusted $
$ Value $ Value if Rating Percent of Rating 8.5% Other
Shares Options Exercised Value
Exercised (Add all) Mkt. Value (Add all)
David Buffet
49,000 $34,300 500,000 $350,000 $175,000 $209,300 0.1 2.1% 0.4
President and CEO
Chuck Leighton Sep-10
47,733 $33,413 150,000 $105,000 $52,500 $85,913 0.0 0.9% 0.2
CFO
Jul-10
Other Officers
32,000 $22,400 494,525 $346,168 $173,084 $195,484 0.1 1.9% 0.4 May-10
Board of Dir. (excl. CEO & Mar-10
CFO)
518,039 $362,627 605,525 $423,868 $211,934 $574,561 0.2 5.7% 1.1
Jan-10
> 10% Holders Nov-09
10,196,709 $7,137,696 2,965,042 $2,075,529 $1,037,765 $8,175,461 80.9%
For info only Sep-09
Total (excl. >10% Holders) $7,590,437 $3,300,564 $1,650,282 $9,240,719 0.4 10.5% 2.1 0% 20% 40% 60% 80% 100%
(Max of 4) (Max of 4)
CEO CFO
Other Officers Directors
> 10% Holders Public Float
* Adjusted $ Value of Options is 50% of their full value if exercised to account for volatility. Furthermore, our view is that shareholders would rather management owned shares vs. options
Add: Compensation Type
Category Rating Addition Percent of Compensation
Share and Total Perform- Share and
Salary Perform- Unit Option All Other Comp. ance Unit Option
ance Bonus Awards Awards Comp. Bonus Awards Awards 0.0%
0.0%
David Buffet Salary
$200,000 $127,555 $327,555 0.25
President and CEO 33.2% Bonus
Chuck Leighton Shares & Units
$160,000 $95,666 $255,666 0.25
CFO Options
Tom Gillette All Other
$220,000 $53,778 $273,778 0.25
Executive VP Sales and Marketing
66.8%
Adrian Byram $175,000 $114,800 $289,800 0.25
Executive VP
Dale Neilly
$135,000 $50,927 $185,927 0.25
VP
Total $890,000 $442,726 $0 $0 $0 $1,332,726 0.25 0.00 0.00
(Max Score)
Bonus: Net Buying/Selling Last Six Months
Insider Holdings Beginning and Ending Value
Transactions
Adjusted Share and
$10,000,000
Rating
Option Value
$8,000,000
Buying Selling Net Bonus
$6,000,000
David Buffet, President and CEO $0 $0 $0 0.00
$4,000,000
Chuck Leighton, CFO $0 $0 $0 0.00
Other Officers $13,500 $0 $13,500 0.00 $2,000,000
Board of Dir. (excl. CEO & CFO) $0 $0 $0 0.00
$-
> 10% Holders (info only) $7,550,641 $2,519,095 $5,031,546
Total (excl. >10% Holders) $13,500 $0 $13,500 0.00 (Total Score) Beg Trans- Ending
Value actions Value
6. investorSCOREcard
Radiant Communications Corp. (RCN-V)
Balance Sheet Analysis Rating 2.6
Short-Term Liquidity Quadrant 3: Quadrant 1:
"RECOVERING" "OPTIMAL"
+ VE
$ 2.3
Jun-09
$ 1.8
Sep-09
Quadrant Rating Jun-09 Sep-09 Dec-09 Mar-10 Jun-10 $ 1.3 Mar-10
Working Capital $ 0.9 $ 1.1 $ 0.5 $ 0.1 $ 3.3
Dec-09
Cash Flow Ops (Q in mil) $ 0.5 $ 0.4 $ 0.2 $ 0.3 $ 0.1
$ 0.8
Cash Flow
Jun-10
Cash Flow Ops (Ann Q's in mil) $ 1.9 $ 1.5 $ 0.8 $ 1.3 $ 0.5
$ 0.3
Quadrant Rating 4.0 4.0 4.0 4.0 4.0
($0.3)
Addition to Quadrant Rating
($0.8)
Our methodology accounts for the 'nearness' to improving or worsening a Company's quadrant
ranking based on current cash generation/burn rate and working capital position. The ($1.3)
- VE
Company's short term liquidity situation is OPTIMAL. At the current cash generation rate the
($1) $- $1 $2 $3 $4
Company's working capital will double in 72 month(s). Quadrant 2:
Quadrant 4:
"URGENT" "DRAWING DOWN"
Add: 0.0 - VE Working Capital + VE
Short-Term Liquidity Rating 4.0
Debt to Equity
Jun-09 Sep-09 Dec-09 Mar-10 Jun-10 Utilities
Telecom
Equity
Number of Companies
Materials
Common Stock Equity $ 3.8 $ 3.9 $ 3.5 $ 3.7 $ 7.6 Info Tech
Industrials
Total Equity $ 3.8 $ 3.9 $ 3.5 $ 3.7 $ 7.6
Health Care
Energy
Cons Staples
Debt and Equivalents Cons Disc
Pref. Securities of Sub Trust - - - - -
Pref. Equity Outside Stock Equity - - - - -
Preferred Stock Equity - - - - -
Minority Interest (Bal. Sheet) - - - - -
Short-Term Debt $ 0.1 $ 0.1 $ 0.0 $ 0.1 $ 0.0
Long-Term Debt - - - - -
Capital Lease Obligations $ 0.1 $ 0.1 $ 0.0 $ 0.0 $ 0.0
Total Debt and Equivalents $ 0.2 $ 0.1 $ 0.1 $ 0.1 $ 0.1
0.00 1.00 2.00 3.00 4.00
Debt to Equity 0.04 0.03 0.03 0.02 0.01
Debt to Equity Rating 3.0 Low Risk Debt to Equity High Risk
Debt to Equity Rating 3.0
Interest Coverage
Jun-09 Sep-09 Dec-09 Mar-10 Jun-10 25.0 x
EBIT
Interest Coverage
Quarterly $ 0.3 $ 0.2 ($0.0) $ 0.1 ($0.2) 20.0 x
TTM $ 0.2 $ 0.6 $ 0.7 $ 0.6 $ 0.1
15.0 x
Interest Expense
Quarterly $ 0.0 $ 0.0 $ 0.0 $ 0.0 $ 0.0
10.0 x
TTM $ 0.1 $ 0.0 $ 0.0 $ 0.0 $ 0.0
Interest Coverage 5.0 x
Quarterly 23.4 x #N/A #N/A 17.8 x #N/A
TTM 3.7 x 12.5 x 17.5 x 19.7 x 2.4 x
0.0 x
Jun-09 Sep-09 Dec-09 Mar-10 Jun-10
Interest Coverage Rating
Qtrly Interest Coverage Rating 3.2 2.9 Quarterly
TTM Interest Coverage Rating 1.1 2.4 2.9 3.0 0.8 TTM
Interest Coverage Rating 0.8
7. investorSCOREcard
Radiant Communications Corp. (RCN-V)
Revenue, EBITDA and EPS Rating 2.6
Revenue (in millions)
Revenue (in milions) on Rolling TTM
$35.00
$30.00
Annual (Fiscal Year) Dec-05 Dec-06 Dec-07 Dec-08 Dec-09
Revenue $ 17.6 $ 19.3 $ 21.8 $ 24.9 $ 30.0 $25.00
Quarterly Jun-09 Sep-09 Dec-09 Mar-10 Jun-10 $20.00
Basis
Quarter Ending $ 7.4 $ 7.7 $ 7.7 $ 7.8 $ 7.8
$15.00
TTM $ 27.9 $ 29.3 $ 30.0 $ 30.6 $ 31.0
$10.00
Growth Percent Rating Stability R² Rating
Rev. Growth % TTM 11.0% 2.7
$5.00
Rev. Growth % LFY 20.6% 4.1 Revenue Stability Last 2 Yrs 97.8% 4.9
Rev. Growth % 3 Year CAGR 15.0% 3.3 Revenue Stability Last 3 Yrs 98.0% 4.9 $-
Rev. Growth % 5 Year CAGR 9.8% 2.5 Revenue Stability Last 5 Yrs 85.9% 4.3 Jun Jun Jun Jun Jun Jun Jun Jun Jun Jun
Revenue Growth Rating 3.1 Overall Revenue Stability Rating 4.7 01 02 03 04 05 06 07 08 09 10
Revenue Growth and Stability Rating 3.9
EBITDA (in millions)
EBITDA (in milions) on Rolling TTM
$ 3.00
$ 2.00
Annual (Fiscal Year) Dec-05 Dec-06 Dec-07 Dec-08 Dec-09
EBITDA ($0.9) $ 1.0 $ 1.6 $ 0.3 $ 1.7 $ 1.00
$-
Quarterly Jun-09 Sep-09 Dec-09 Mar-10 Jun-10
Basis
Quarter Ending $ 0.6 $ 0.4 $ 0.2 $ 0.4 $ 0.1 ($1.00)
TTM $ 1.3 $ 1.6 $ 1.7 $ 1.6 $ 1.1
($2.00)
Growth Percent Rating Stability R² Rating ($3.00)
EBITDA Growth % TTM -15.9% 0.1
($4.00)
EBITDA Growth % LFY 406.9% 5.0 EBITDA Stability Last 2 Yrs 11.5% 0.3
EBITDA Grwth % 3 Yr CAGR -1.1% 1.1 EBITDA Stability Last 3 Yrs 3.5% 0.2 ($5.00)
EBITDA Grwth % 5 Yr CAGR 200.8% 5.0 EBITDA Stability Last 5 Yrs 62.9% 3.1 Jun Jun Jun Jun Jun Jun Jun Jun Jun Jun
EBITDA Growth Rating 2.8 Overall EBITDA Stablitity Rating 1.2 01 02 03 04 05 06 07 08 09 10
EBITDA Growth and Stability Rating 2.0
Basic Earnings Per Share (EPS*) $1.00
* (excluding acquired in process R&D, restructuring and M&A, special income & charges and discontinued ops)
$-
Annual (Fiscal Year) Dec-05 Dec-06 Dec-07 Dec-08 Dec-09
EPS on Rolling TTM
EPS ($0.59) $ 0.00 $ 0.04 ($0.05) $ 0.01 ($1.00)
Quarterly (TTM) ($2.00)
Basis
Jun-09 Sep-09 Dec-09 Mar-10 Jun-10
Quarter Ending $ 0.02 $ 0.01 ($0.04) $ 0.01 ($0.01)
TTM $ 0.02 $ 0.04 $ 0.01 $ - ($0.03) ($3.00)
($4.00)
Growth Percent Rating Stability R² Rating
EPS Growth % TTM -250.0% 0.0
($5.00)
EPS Growth % LFY 120.0% 5.0 EPS Stability Last 2 Yrs 4.8% 0.1
EPS Grwth % 3 Year CAGR -219.5% 0.0 EPS Stability Last 3 Yrs 11.9% 0.3 ($6.00)
EPS Grwth % 5 Year CAGR 49.6% 4.9 EPS Stability Last 5 Yrs 55.0% 2.7 Jun Jun Jun Jun Jun Jun Jun Jun Jun Jun
EPS Growth Rating 2.5 Overall EPS Stablitity Rating 1.1 01 02 03 04 05 06 07 08 09 10
EPS Growth and Stability Rating 1.8
8. investorSCOREcard
Radiant Communications Corp. (RCN-V)
Return On Capital Rating 1.9
Return On Invested Capital (ROIC)
50%
Annual (Fiscal Year) Dec-05 Dec-06 Dec-07 Dec-08 Dec-09
Invested Capital Period Ending $ 3.1 $ 2.9 $ 3.8 $ 3.5 $ 3.7
Average Invested Capital $ 2.6 $ 3.0 $ 3.4 $ 3.7 $ 3.6 0%
ROIC on Rolling TTM
* Net Income ($3.6) $ 0.0 $ 0.4 ($0.5) $ 0.1
Add Back: After Tax Interest Expense $ 0.6 $ 0.2 $ 0.1 $ 0.1 $ 0.0
Annual ROIC -110.3% 6.5% 15.1% -12.9% 2.8% (50%)
Basis
Level Rating 0.0 2.7 3.6 0.7 2.2
Consistency Rating 1.8
(100%)
Quarterly (TTM) Jun-09 Sep-09 Dec-09 Mar-10 Jun-10
Invested Capital Period Ending $ 4.0 $ 4.1 $ 3.7 $ 3.8 $ 7.7
Average Invested Capital $ 3.6 $ 3.7 $ 3.8 $ 3.9 $ 4.7
(150%)
* Net Income $ 0.3 $ 0.5 $ 0.1 ($0.1) ($0.5)
Add Back: After Tax Interest Expense $ 0.0 $ 0.0 $ 0.0 $ 0.0 $ 0.0
Quarterly ROIC 8.1% 13.9% 2.6% -1.0% -10.0%
Level Rating 2.9 3.5 2.2 1.8 0.9 (200%)
Consistency Rating 2.3 Jun Jun Jun Jun Jun Jun Jun Jun Jun Jun
01 02 03 04 05 06 07 08 09 10
Return on Invested Capital (ROIC) Rating 1.8
Return On Assets (ROA)
20%
Annual (Fiscal Year) Dec-05 Dec-06 Dec-07 Dec-08 Dec-09
Total Assets Period Ending $ 8.6 $ 8.5 $ 9.6 $ 10.3 $ 11.7
0%
Average Total Assets $ 8.1 $ 8.6 $ 9.1 $ 10.0 $ 11.0
ROA on Rolling TTM
* Net Income ($3.6) $ 0.0 $ 0.4 ($0.5) $ 0.1
Add Back: After Tax Interest Expense $ 0.6 $ 0.2 $ 0.1 $ 0.1 $ 0.0 (20%)
Annual ROA -36.1% 2.3% 5.6% -4.7% 0.9%
Basis
Level Rating 0.1 2.3 2.7 1.6 2.2
Consistency Rating 1.8 (40%)
Quarterly (TTM) Jun-09 Sep-09 Dec-09 Mar-10 Jun-10 (60%)
Total Assets Period Ending $ 11.3 $ 11.3 $ 11.7 $ 12.1 $ 15.7
Average Total Assets $ 10.4 $ 10.8 $ 11.1 $ 11.4 $ 12.4
* Net Income $ 0.3 $ 0.5 $ 0.1 ($0.1) ($0.5) (80%)
Add Back: After Tax Interest Expense $ 0.0 $ 0.0 $ 0.0 $ 0.0 $ 0.0
Quarterly ROA 8.1% 13.9% 2.6% -1.0% -10.0%
Level Rating 2.9 3.5 2.4 2.0 1.1 (100%)
Consistency Rating 2.4 Jun Jun Jun Jun Jun Jun Jun Jun Jun Jun
01 02 03 04 05 06 07 08 09 10
Return on Assets (ROA) Rating 1.9
Return On Common Equity (ROE)
2500%
Annual (Fiscal Year) Dec-05 Dec-06 Dec-07 Dec-08 Dec-09 2000%
Total Equity Period Ending $ 1.8 $ 2.0 $ 3.4 $ 3.1 $ 3.5
1500%
Average Common Equity ($0.2) $ 1.9 $ 2.7 $ 3.3 $ 3.3
ROE on Rolling TTM
* Net Income ($3.6) $ 0.0 $ 0.4 ($0.5) $ 0.1 1000%
Add Back: NA $ - $ - $ - $ - $ -
500%
Annual ROE 1941.7% 2.0% 15.6% -16.2% 2.2%
Basis
Level Rating 5.0 2.0 3.1 0.8 2.0 0%
Consistency Rating 2.6
(500%)
Quarterly (TTM) Jun-09 Sep-09 Dec-09 Mar-10 Jun-10 (1000%)
Total Equity Period Ending $ 3.8 $ 3.9 $ 3.5 $ 3.7 $ 7.6
(1500%)
Average Common Equity $ 3.3 $ 3.5 $ 3.6 $ 3.7 $ 4.5
* Net Income $ 0.3 $ 0.5 $ 0.1 ($0.1) ($0.5) (2000%)
Add Back: NA $ - $ - $ - $ - $ - (2500%)
Quarterly ROE 7.5% 14.0% 2.1% -1.6% -10.7%
Level Rating 2.5 3.0 2.0 1.7 1.1 (3000%)
Consistency Rating 2.1 Jun Jun Jun Jun Jun Jun Jun Jun Jun Jun
01 02 03 04 05 06 07 08 09 10
Return on Common Equity (ROE) Rating 2.0
* Net Income - Excludes Net Income from Discontinued Operations, Income Acquired in Process R&D, Income Restructuring And M&A, and Other Special Income/(Charges)
9. investorSCOREcard
Radiant Communications Corp. (RCN-V)
Valuation Rating 2.1
Price to Earnings (P/E)
140.0 x
(Lower numbers receive higher rankings)
120.0 x
Annual (Fiscal Year) Dec-05 Dec-06 Dec-07 Dec-08 Dec-09
* Price $ 1.00 $ 1.26 $ 1.00 $ 0.85 $ 1.15
P/E on Rolling TTM
Earnings Per Share (EPS) ($0.59) $ 0.00 $ 0.04 ($0.05) $ 0.01 100.0 x
Annual P/E 829.3 x 25.0 x 115.0 x 80.0 x
Basis
Annual P/E Rating 1.8 0.0
60.0 x
Quarterly (TTM) Jun-09 Sep-09 Dec-09 Mar-10 Jun-10
* Price $ 0.93 $ 1.00 $ 1.15 $ 0.85 $ 0.70 40.0 x
Earnings Per Share (EPS) $ 0.02 $ 0.04 $ 0.01 $ - ($0.03)
20.0 x
Quarterly (TTM) P/E 46.5 x 25.0 x 115.0 x
Quarterly (TTM) P/E Rating 0.1 1.8 0.0 0.0 x
Jun Jun Jun Jun Jun Jun Jun Jun Jun Jun
01 02 03 04 05 06 07 08 09 10
Price to Earnings (P/E) 0.0
Price to Book (P/Book)
20.0 x
(Lower numbers receive higher rankings)
Annual (Fiscal Year) Dec-05 Dec-06 Dec-07 Dec-08 Dec-09 0.0 x
P/Book on Quarterly
* Price $ 1.00 $ 1.26 $ 1.00 $ 0.85 $ 1.15
Book Equity Per Share $ 0.19 $ 0.20 $ 0.31 $ 0.29 $ 0.32
(20.0x)
Annual P/Book 5.4 x 6.3 x 3.2 x 3.0 x 3.6 x
Basis
Annual P/Book Rating 0.4 0.1 2.1 2.4 1.7 (40.0x)
Quarterly Jun-09 Sep-09 Dec-09 Mar-10 Jun-10 (60.0x)
* Price $ 0.93 $ 1.00 $ 1.15 $ 0.85 $ 0.70
Book Equity Per Share $ 0.34 $ 0.36 $ 0.32 $ 0.34 $ 0.50
(80.0x)
Quarterly P/Book 2.7 x 2.8 x 3.6 x 2.5 x 1.4 x
Quarterly P/Book Rating 2.7 2.6 1.7 2.9 4.0 (100.0x)
Jun Jun Jun Jun Jun Jun Jun Jun Jun Jun
01 02 03 04 05 06 07 08 09 10
Price to Book (P/Book) 2.8
Enterprise Value to EBITDA (EV/EBITDA)
30.0 x
(Lower numbers receive higher rankings)
EV/EBITDA on Rolling TTM
Annual (Fiscal Year) Dec-05 Dec-06 Dec-07 Dec-08 Dec-09 25.0 x
* Enterprise Value $ 11.1 $ 13.3 $ 11.3 $ 9.6 $ 12.7
EBITDA ($0.89) $ 0.95 $ 1.62 $ 0.34 $ 1.73
20.0 x
Annual EV/EBITDA 14.0 x 7.0 x 28.2 x 7.3 x
Basis
Annual EV/EBITDA Rating 1.7 4.0 0.0 3.9 15.0 x
Quarterly (TTM) Jun-09 Sep-09 Dec-09 Mar-10 Jun-10 10.0 x
* Enterprise Value $ 10.3 $ 11.0 $ 12.7 $ 9.4 $ 10.7
EBITDA $ 1.28 $ 1.62 $ 1.73 $ 1.61 $ 1.08
5.0 x
Quarterly (TTM) EV/EBITDA 8.1 x 6.8 x 7.3 x 5.8 x 9.9 x
Quarterly (TTM) EV/EBITDA Rating 3.7 4.0 3.9 4.3 3.1 0.0 x
Jun Jun Jun Jun Jun Jun Jun Jun Jun Jun
01 02 03 04 05 06 07 08 09 10
Enterprise Value to EBITDA (EV/EBITDA) 3.5
* Price - Delayed 60 days to reflect the fact that financial statements are public approximately 60 days after the last day of the reporting period. For the last period the most recent price is used.
10. investorSCOREcard
Disclosure and Disclaimer
The issuer (“Issuer”) covered under this investor scorecard (“Investor Scorecard”) has paid a fee to or has been charged a fee to produce and distribute this
Investor Scorecard. The fee paid or charged for the production and distribution of this Investor Scorecard was not subject to the rankings or information provided
herein, nor was any securities of the Issuer accepted as payment for such fee. FSA Financial Science & Art Ltd. (“FSA”), The Equicom Group Inc. (“Equicom”) and
their respective employees and directors may have had or from time to time acquire, hold or sell an interest in the listed securities of the Issuer.
Unless specified otherwise, all forward looking statements in this Investor Scorecard have been approved by the Issuer, and the Issuer has advised FSA and
Equicom, without independent verification by FSA or Equicom that a reasonable basis exists for such forward looking statements. Other information contained
in this Investor Scorecard has been compiled by FSA or Equicom from sources believed to be reliable, which may include but not limited to, public information,
research reports and discussions with management of the Issuer. Prior to its publication, this Investor Scorecard had been submitted to the management of the
Issuer for review for factual accuracy.
No representation or warranty, express or implied, is made by FSA, Equicom, its affiliates, any other person that provided information or data for this Investor
Scorecard or any person that distributes this Investor Scorecard with respect to the adequacy, accuracy, completeness or timeliness of any information, estimates
or opinions provided in this Investor Scorecard. All estimates, opinions and other information in this Investor Scorecard are provided by FSA, Equicom or another
party as of the date of this Investor Scorecard. Such estimates, opinions and other information are subject to change without notice, and are provided in good
faith but without any legal responsibility. Past performance is no guarantee of future results.
This Investor Scorecard is provided for informational purposes only and does not constitute an offer or solicitation to buy or sell any securities discussed herein
in any jurisdiction. As a result, the securities discussed in this Investor Scorecard may not be eligible for sale in some jurisdictions. This Investor Scorecard is not,
and under no circumstances should be construed as, a solicitation to act as a securities broker, dealer or advisor in any jurisdiction by any person or company
that is not legally permitted to carry on the business of a securities broker, dealer or advisor in that jurisdiction. Neither FSA nor Equicom is a registered
investment dealer, broker or advisor, has investment banking operations or makes markets in any securities.
This Investor Scorecard is prepared for general circulation and to provide an overview of Issuer’s business. This Investor Scorecard does not consider
the investment objectives, financial situation or particular needs of any particular person, and is not tailored to the needs of any person receiving this Investor
Scorecard. Readers of this Investor Scorecard should obtain professional advice based on their own individual circumstances before making an investment
decision. Nothing in this Investor Scorecard constitutes individual investment, legal or tax advice. To the fullest extent permitted by law, FSA, Equicom,
Morningstar Inc., its content providers, any other person that has provided information or data for this Investor Scorecard nor any authorized person that
distributes this Investor Scorecard accepts any liability whatsoever for any direct, indirect, special or consequential loss (whether in contract or tort even if FSA,
Equicom or the other party has been advised of the possibility of such loss) arising from any use of, or reliance on the estimates, opinions or other information
contained in this Investor Scorecard.
Without limiting the generality of the foregoing, you are prohibited from using or disclosing any personal information contained in the Investor Scorecard
for purposes unrelated to the purposes for which the information is made available to you and/or the public under Canadian securities laws, including, without
limitation, for secondary marketing purposes, unless you have obtained any and all consents as required under applicable Canadian privacy laws.
The information contained in this Investor Scorecard is copyrighted, and it may not be sold or licensed for commercial value or altered, in whole or in part,
without prior express written consent of Equicom. Furthermore, Investor Scorecard can only be distributed in its entirety. Information or data herein, including
any trade mark, service mark or logo is the intellectual property of FSA, Equicom, Morningstar Inc. and/or its content providers, Issuer or other persons that have
provided such information or data, including but not limited to the organizations listed below and their respective content providers.
This report was produced in part with information from the following organizations: