Download to read offline
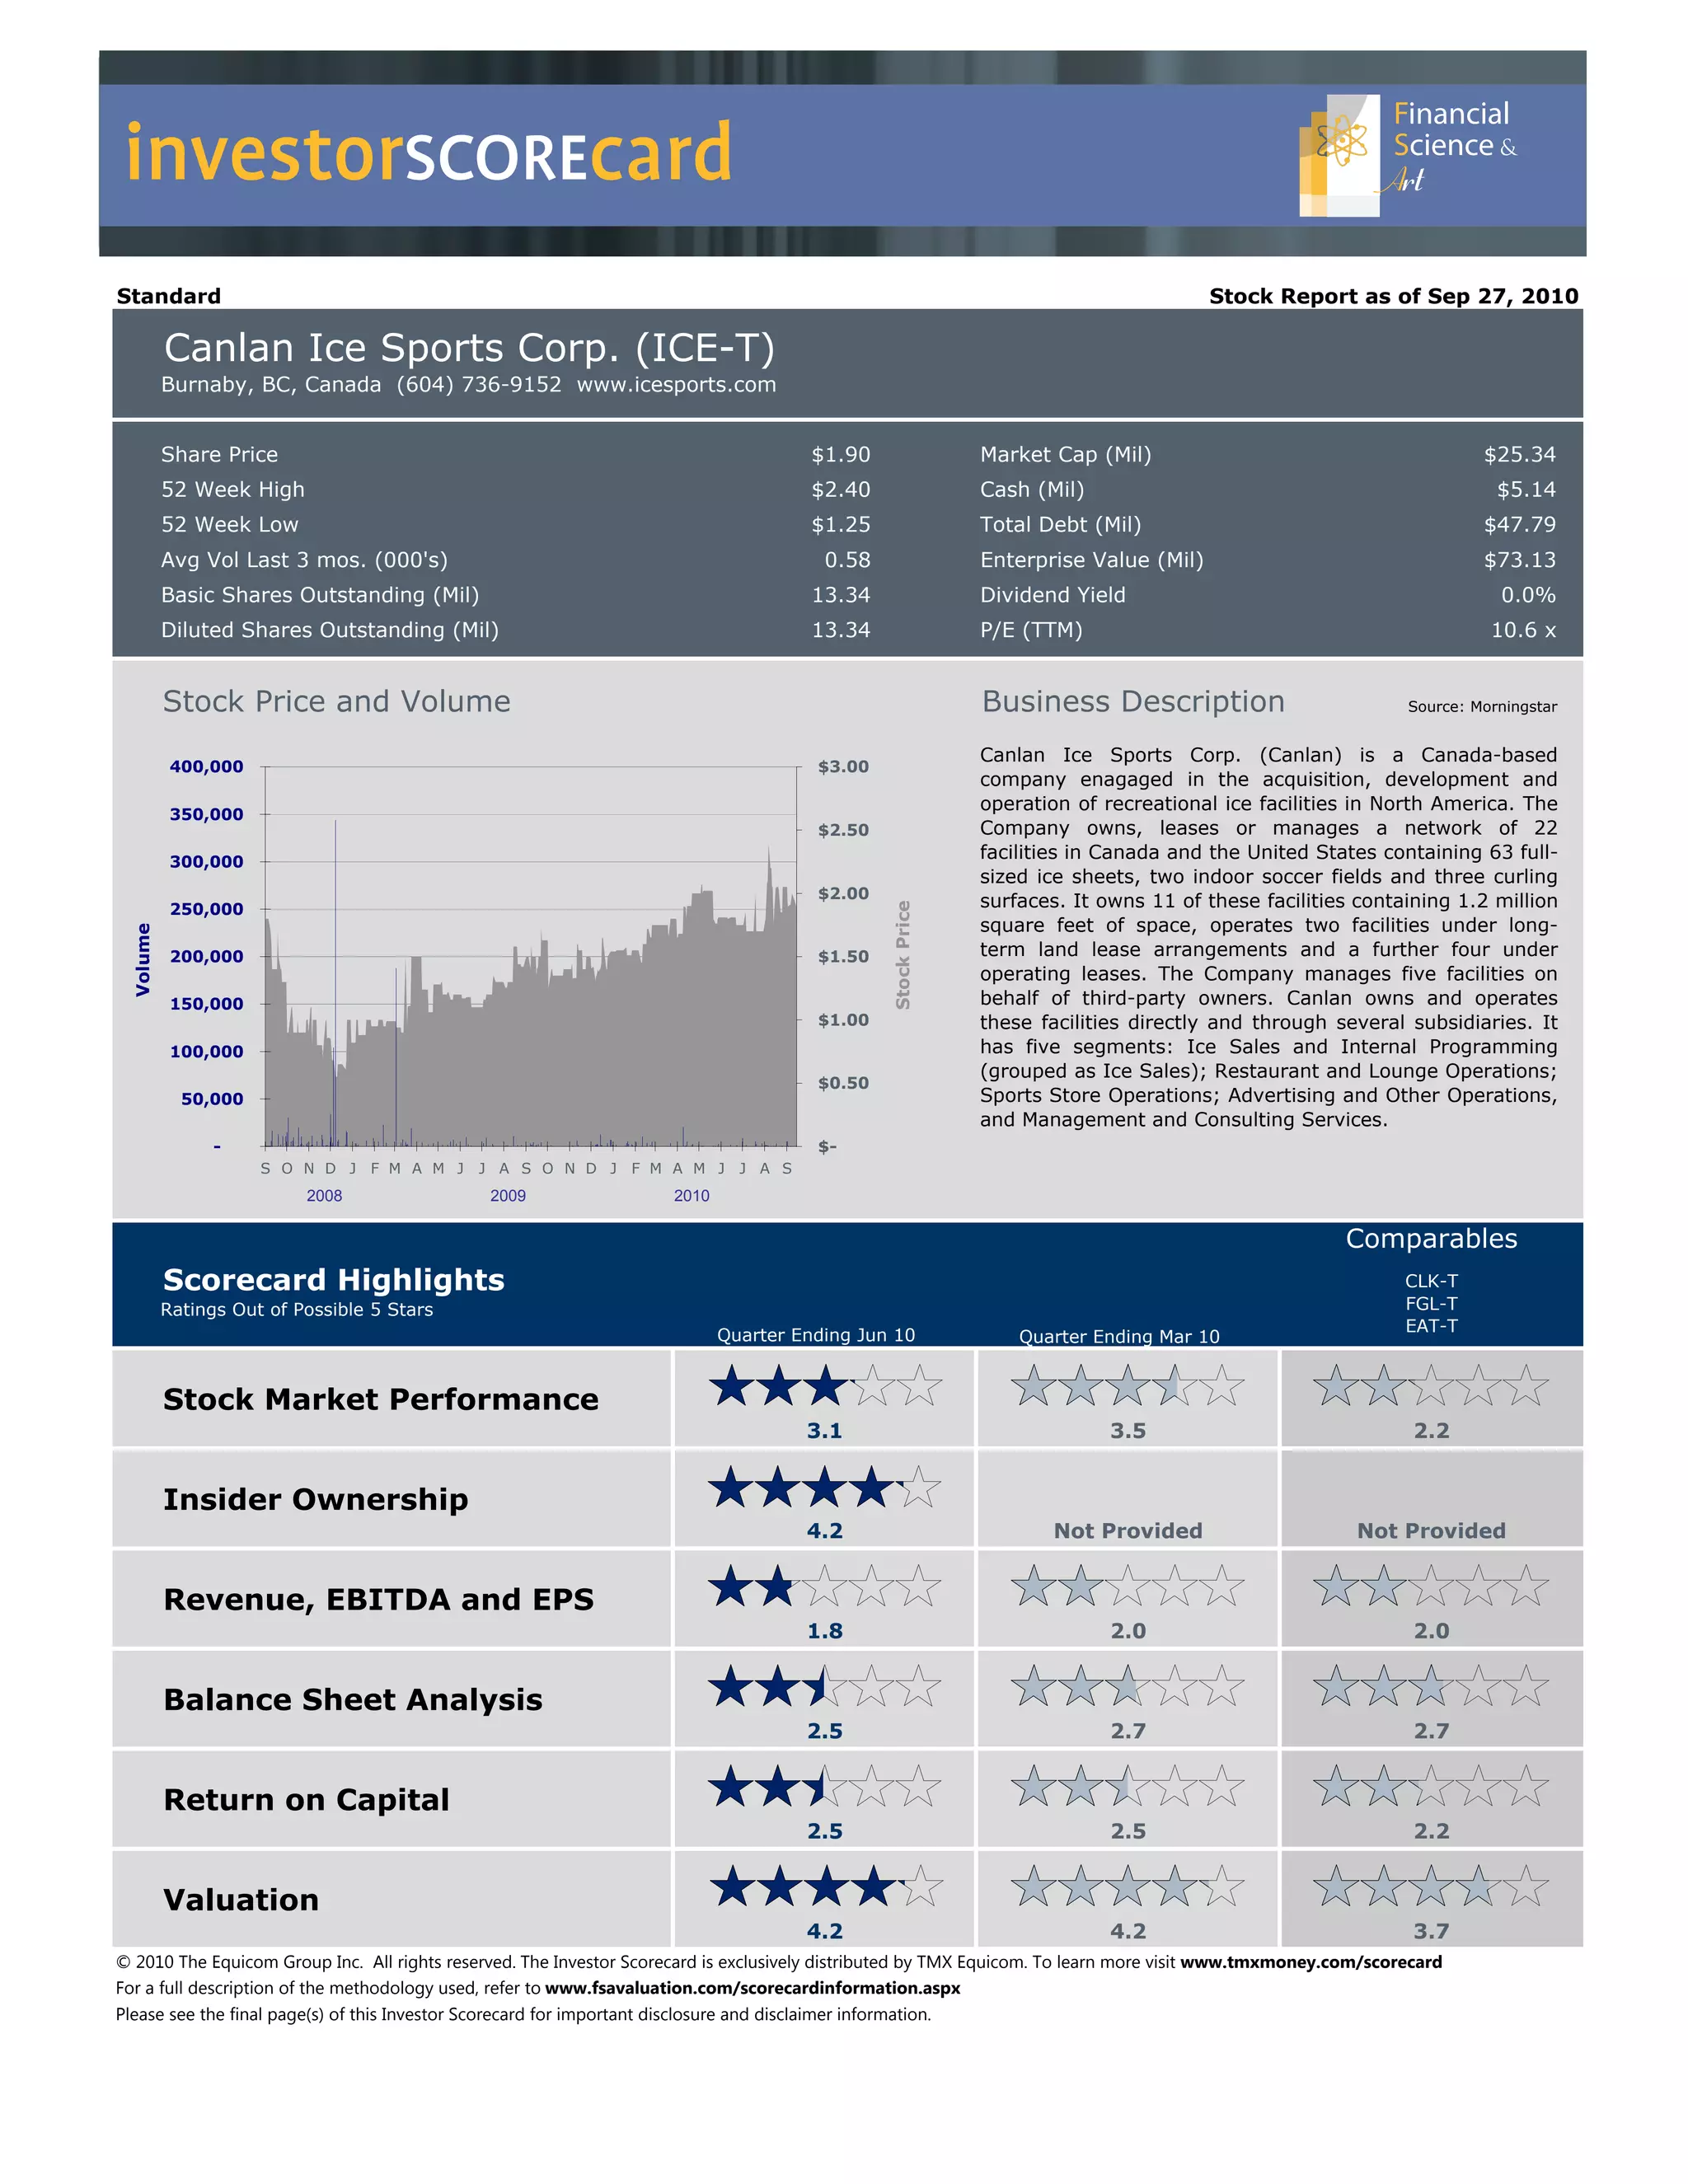
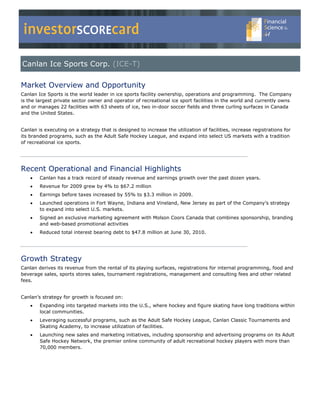

Canlan Ice Sports Corp. is a Canada-based company that owns and operates recreational ice sports facilities across North America. It owns or manages 22 facilities with 63 sheets of ice. Canlan has grown steadily in recent years through expanding into new US markets and leveraging successful programming. Its strategy focuses on further expansion in the US, increasing facility utilization through programs, and new marketing initiatives. As the largest operator of ice facilities, Canlan has strong brand recognition, customer loyalty, and high barriers to entry due to capital requirements.


