2. investorSCOREcard
Dejour Energy Inc. (TSX:DEJ, AMEX:DEJ)
Business Description
Dejour Energy Inc. is an independent energy company engaged on exploration and production of crude oil and
natural gas. The Company’s near-term focus is on developing its two core assets –Woodrush, targeting light crude
oil in the Peace River Arch, on the northern border of Alberta and British Colombia; and Gibson Gulch, a natural
gas project located in Colorado’s prolific Piceance Basin. Longer term, the Company offers significant exploration
upside through a variety of projects with varying risk profiles on its existing land base. Dejour trades as DEJ: TSX,
and DEJ: AMEX.
Market Overview and Opportunity
Crude Oil
As of January 2009, Canada had 178 billion barrels of crude oil reserves (U.S. Energy Information Administration,
2010). The main source of Canadian oil production for the past 50 years has been the Western Canadian
Sedimentary Basin (WCSB), which underlies most of Alberta, parts of British Columbia, Saskatchewan, Manitoba and
the Northwest Territories. The growing maturity of many of the fields in the WCSB has led to a steady decline in
conventional oil production while production from unconventional sources (i.e. oil sands) has steadily increased.
Generally, conventional oil production requires lower development and operating costs, and targets tend to be
medium to light oil, whereas oil sands produce heavy oil which is sold at a discount to lighter oil. The challenge
becomes finding and developing what remains of the conventional oil fields within the maturing basin.
The situation is similar in the U.S. in terms of conventional production but on a much smaller scale. As of January
2009, the U.S. had 20.7 billion barrels of crude oil reserves (U.S. Energy Information Administration, 2010).
Production of crude oil in the U.S. has recently focused on unconventional sources such as shale oil, however,
conventional production has significant benefits.
The improving economic environment has been the main driver of the recent oil rally with prices ranging from $90
to more than $100 per barrel levels. Global oil demand is expected to grow in the near term and beyond, however,
this is offset by high levels of supply for both gasoline and distillate inventories and continued concerns surrounding
persistently weak near-term fundamentals (i.e. value of U.S. dollar, OPEC decisions, concern over global economic
recovery, etc.).
Natural Gas
There is an abundance of natural gas in North America. Canada had 58 trillion cubic feet (TCF) of natural gas
reserves as of January 2009 (U.S. Energy Information Administration, 2010). The reserves are concentrated in the
WCSB and, similar to crude oil, future natural gas production will likely come from unconventional reservoirs (i.e.
coal bed methane, shale gas, arctic frontier, deep basin deposits). Recently, production in the WCSB has begun to
move away from Alberta towards new discoveries in northeast British Columbia.
The development and implementation of horizontal drilling and hydraulic fracturing in shale gas plays have ushered
in a robust resurgence in the U.S.’s domestic natural gas production. As of January 2009, the U.S. had 238 TCF of
natural gas reserves and currently leads the Western Hemisphere in natural gas production (U.S. Energy
Information Administration, 2010). The sheer geographic diversity of U.S. shale gas resources has created a stable
and deliverable natural gas supply for the country. As crude oil has more difficult and more expensive to find, shale
gas production has increased in popularity with energy producers who are looking for ways to produce cheaper,
3. investorSCOREcard
Dejour Energy Inc. (TSX:DEJ, AMEX:DEJ)
cleaner-burning fuels, however, this surge in popularity has also led to a depressed pricing environment for the
commodity.
Though the colder weather in North America has considerably helped with the over-supply of natural gas, the price
environment remains challenged as storage levels remain well above average. The fundamentals of natural gas
remain weak as U.S. production is expected to remain steady while natural gas consumption is anticipated to decline
due to fewer heating-days, although this could be offset by an increasing demand from electric power and industrial
services.
Overview of Projects
Dejour currently participates in projects located in Western Canada (British Columbia) and the Western United
States (Colorado and Utah).
Peace River Arch Basin - Woodrush
Within the Peace River Arch basin, Dejour holds 41,000 gross acres (15,000 net acres) of crude oil and natural gas
acreage. The Company’s 75%-owned and operated, 6,000 gross acre (4,500 net acre) Woodrush project is located
within the Peace River Arch in northeast British Colombia.
Woodrush is a combination of relatively shallow light oil and natural gas targets - the Halfway formation is targeted
for light crude oil and the Notikewin for natural gas. Gross production capacity from the field is approximately 1,260
barrels of oil equivalent per day (BOE/d), of which approximately 800 barrels of oil per day (bbl/d) is light crude oil
and 2.8 million cubic feet per day (mmcf/d) is natural gas. The Company expects production to increase until the
field reaches its peak production capacity of 1,260 BOE/d in twelve to fifteen months.
Woodrush is currently producing from two crude oil wells and six natural gas wells (with plans for an additional 15
producing wells plus injectors). Two injector wells have been recently drilled to implement a water flood, effectively
boosting production (and reserves) from the two wells to their targeted peak production. Sustained production from
Woodrush will allow for a steady stream of cash flow, enabling the Company to internally fund expansions and
exploration initiatives beyond the Halfway and Notikewin prospects.
Dejour is targeting deeper, unconventional Montney crude oil through a strategic joint venture whereby initial
testing in the amount of $1 million was fully funded by the joint venture partner.
Piceance/Uinta Basins – Gibson Gulch
Dejour feels its most compelling near-term crude oil and natural gas assets are held in the Piceance and Uinta
basins of Colorado and Utah. The bulk of the land in these basins is owned by the major exploration and production
companies in North America and Dejour is one of a handful of smaller players in the area with current land holdings
of 190,000 gross acres (127,000 net acres).
The Company holds a 72% interest in 2,200 gross acres (1,585 net acres) in the Gibson Gulch area of the Piceance
basin. The Company’s acreage is strategically positioned, surrounded on all sides by significant existing production,
providing a certain amount of assurance that the acreage is almost certainly located along the producing trend. The
location also provides access to existing infrastructure, leading to lower development costs.
4. investorSCOREcard
Dejour Energy Inc. (TSX:DEJ, AMEX:DEJ)
Near-term plans for Gibson Gulch include a 16-well program targeting shallow, tight gas in the Williams Fork
structure. Longer term plans for Gibson Gulch include a 220-well program. Also within the area, the deeper Niobrara
formation is an unconventional, high-pressure natural gas play representing considerable exploration upside
potential.
South Rangely
In June 2011, Dejour drilled and set casing on an initial vertical well to test the Mancos/Niobrara potential on its
South Rangely leasehold in Rio Blanco County, Colorado. The test well was drilled to a depth of 3863' and
encountered approximately 90 feet of hydrocarbon bearing siltstone in the Lower Mancos “C" sands. After a
thorough review of the well data, the well will be completed, fractured and flow tested to determine the commercial
potential of the Lower Mancos “C” Sand in this area. Definitive results of this test well will be forthcoming in Q3
2011. Dejour has a 30% WI in the test well and an average 56% WI in the surrounding 8000 acres.
In this area, the targeted zones are known to contain both oil and natural gas, estimated at 8 MMBO of Contingent
oil resources. Private operators R. W. Bayless and Foundation Energy are currently exploiting the lower Mancos
zone, approximately six miles to the southwest of Dejour’s proposed well location. A secondary target in the upper
Mancos known as the Castlegate Sand will also be evaluated within this initial test well.
Dejour holds interests in several mid to long-term exploration plays in both crude oil and natural gas. These include:
• Tinsley: 35% interest on 10,000 gross acres (3,500 net acres); conventional high pressure natural gas
• Dinosaur and North Rangely: 72% interest on 64,000 gross acres (46,080 net acres); conventional, high-risk,
deep, Weber crude oil (Rangely crude oil field)
• Tri-County: 25% interest on 40,000 gross acres (10,000 net acres); multiple conventional targets
• Paradox: 25% interest on 16,000 gross acres (4,000 net acres); high pressure crude oil/natural gas resource
• Book Cliffs: 72% interest on 16,000 gross acres (11,520 net acres)
• Meeker/Pinyon: 25% interest on 36,000 gross acres (9,000 net acres)
Reserves Data
As of Light and Medium Natural Gas Natural Gas Liquids Oil Equivalent
December Oil (Mbbl) (MMcf) (Mbbl) (Mbbl)
31, 2010
CAN US Total CAN US Total CAN US Total CAN US Total
Total
Proved 216 558 774 1,125 77,456 78,581 7 - 7 411 13,476 13,878
Dejour Energy's reserve information as at December 31, 2010 and the mid-year updated reserve evaluation report
on its Woodrush oil pool are available on www.sedar.com and www.dejour.com.
5. investorSCOREcard
Dejour Energy Inc. (TSX:DEJ, AMEX:DEJ)
Milestones
• completed a US$2.75 million financing in January 2011 plus an additional $550,000 supplemental financing in
February 2011, intended to fund further exploration and development of crude oil projects at Woodrush, to
commence exploratory drilling at South Rangely (Colorado) and to supplement working capital
• subsequent to the end of the quarter, purchased three additional sections of oil and gas leases in Northeast
B.C. covering approximately 2,500 acres adjacent to its current landholdings of conventional oil/gas
production at the Woodrush project.
• subsequent to the end of the quarter, received a mid-year updated reserve evaluation report on its Woodrush
oil pool valuing the PV-10 proved reserves at C$25 million, with proved and probable reserves valued at C$42
million net to Dejour’s 75% WI. This represented a 350% increase over December 31, 2010 levels.
• targeting Q3/11 for sustained production of approximately 900 BOE/d (gross) at Woodrush via water flood
implementation
• commence drilling of Gibson Gulch natural gas wells in 2012, working towards 17 mmcf/d (net) production
from Williams Fork structure
• combined gross production from Woodrush and Gibson Gulch targeted at 4,000 BOE/d by year-end 2012
Investment Highlights
• development projects underpin higher-risk exploration plays
• balanced commodity risk - exposure to prolific natural gas assets hedged by crude oil developments and
exploration potential in both the Woodrush (Montney) area and South Rangely (Piceance)
• capital risk managed by joint venture partnerships
• strong balance sheet with manageable debt
• high level of operatorship ensures the Company has significant control and influence over timing and
development of its assets
• high level of insider ownership, approximately 25%
6. investorSCOREcard
Dejour Energy Inc. (TSX:DEJ, AMEX:DEJ)
Management
Robert L. Hodgkinson
Chief Executive Officer, President Dejour Energy Alberta (Energy) Ltd.
Harrison Blacker
Chief Operating Operator, Dejour Energy (USA) Corp.
Neyeska Mut
Executive Vice President Operations, Dejour Energy (USA) Corp.
Matthew Wong
Chief Financial Officer
Phil Bretzloff
Vice President and General Counsel
Comparables
Lynden Energy Corp. – LVL-T
Anglio Canadian Oil Corp. – ACG-V
Ember Resources Inc. – EBR-T
7. investorSCOREcard
Dejour Energy (TSX:DEJ, AMEX:DEJ)
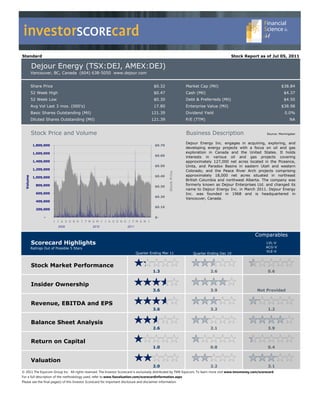
Stock Market Performance Rating 1.3
Stock Market Returns 700,000 $3.00
Return Percentile Rating
600,000 $2.50
Three Months (20.0%) 32% 1.6
Six Months (3.0%) 45% 2.2
500,000
Stock Price
1 Year 3% 25% 1.2 $2.00
Volume
3 Years (CAGR) (43.8%) 0% 0.0 400,000
5 Years (CAGR) $1.50
300,000
Market Data $1.00
Price $0.32 200,000
Mkt Cap (Mil) $38.84
$0.50
Shs Outstanding (Mil) 121.39 100,000
Dividend Yield % 0.0%
Avg Vol Last 3mos. (000's) 17.80 - $-
2008
2009
2010
2011
P/E (TTM) NA
Insider Ownership Rating 3.6
Value of Shares and Options Percent of Ownership
Shares Options Total Value Rating Percent Rating 14.4% Insiders
* Adjusted 11.9% > 10% Holders
# of # of $ Value if Adjusted $
$ Value $ Value if Rating Percent of Rating 73.7% Other
Shares Options Exercised Value
Exercised (Add all) Mkt. Value (Add all)
Robert Hodgkinson
7,187,840 $2,300,109 2,250,818 $720,262 $360,131 $2,660,240 1.1 6.8% 1.4
CEO
Mathew Wong Jul-11
- $0 817,000 $261,440 $130,720 $130,720 0.1 0.3% 0.1
CFO
May-11
Other Officers
74,799 $23,936 1,586,450 $507,664 $253,832 $277,768 0.1 0.7% 0.1 Mar-11
Board of Dir. (excl. CEO & Jan-11
CFO)
4,746,921 $1,519,015 6,306,784 $2,018,171 $1,009,085 $2,528,100 1.0 6.5% 1.3 Nov-10
> 10% Holders Sep-10
11,975,946 $3,832,303 5,016,333 $1,605,227 $802,613 $4,634,916 11.9%
For info only Jul-10
Total (excl. >10% Holders) $7,675,362 $5,112,763 $2,556,382 $10,231,744 2.2 14.4% 2.9 0% 20% 40% 60% 80% 100%
(Max of 4) (Max of 4) CEO CFO
Other Officers Directors
> 10% Holders Public Float
* Adjusted $ Value of Options is 50% of their full value if exercised to account for volatility. Furthermore, our view is that shareholders would rather management owned shares vs. options.
Add: Compensation Type
Category Rating Addition Percent of Compensation
Share and Total Perform- Share and
Salary Perform- Unit Option All Other Comp. ance Unit Option
0.0%
ance Bonus Awards Awards Comp. Bonus Awards Awards 19.3%
Robert Hodgkinson Salary
$255,000 $88,000 $343,000 0.25 %
CEO Bonus
Mathew Wong Shares & Units
$218,000 $40,000 $258,000 0.25
CFO Options
%
Harrison Blacker All Other
$232,564 $112,548 $96,000 $441,112 0.25 0.25 69.2%
President and COO
Neyeska Mut $186,489 $35,131 $24,800 $246,420 0.25 0.25
EVP Operations
Total $892,053 $147,679 $0 $248,800 $0 $1,288,532 0.25 0.00 0.25
(Max Score)
Bonus: Net Buying/Selling Last Six Months
Insider Holdings Beginning and Ending Value
Transactions
Adjusted Share and
$12,000,000
Rating $10,000,000
Option Value
Buying Selling Net Bonus
$8,000,000
$6,000,000
Robert Hodgkinson, CEO $0 $0 $0 0.00
Mathew Wong , CFO $0 $0 $0 0.00 $4,000,000
Other Officers $0 $0 $0 0.00 $2,000,000
Board of Dir. (excl. CEO & CFO) $500,000 $0 $500,000 0.20
$-
> 10% Holders (info only) $2,013,157 $3,625,554 #######
Total (excl. >10% Holders) $500,000 $0 $500,000 0.20 (Total Score) Beg Trans- Ending
Value actions Value
8. investorSCOREcard
Dejour Energy (TSX:DEJ, AMEX:DEJ)
Balance Sheet Analysis Rating 2.6
Short-Term Liquidity Quadrant 3: Quadrant 1:
"RECOVERING" "OPTIMAL"
$ 6.0
+ VE
This Company's cash flow is considered NOT SEASONAL, therefore this report uses the last
quarter's cash flow multiplied by 4 as a proxy for annual cash flow. $ 5.0 Jun-10
$ 4.0 Sep-10
Quadrant Rating Mar-10 Jun-10 Sep-10 Dec-10 Mar-11 $ 3.0
Working Capital ($4.3) ($4.6) ($1.3) ($1.7) ($2.3)
$ 2.0
Cash Flow Ops (Q in mil) ($0.3) $ 1.2 $ 1.0 $ 0.3 $ 0.1
Cash Flow
Dec-10
Cash Flow Ops (Ann Q's in mil) ($1.1) $ 5.0 $ 4.1 $ 1.2 $ 0.3 $ 1.0
Quadrant Rating 1.0 2.0 2.0 2.0 2.0 Mar-11
$-
($1.0) Mar-10
Addition to Quadrant Rating
Our methodology accounts for the 'nearness' to improving or worsening a Company's quadrant ($2.0)
ranking based on current cash generation/burn rate and working capital position. The ($3.0)
- VE
Company's working capital is RECOVERING. The working capital is negative, but they are
($6) ($4) ($2) $- $2
generating positive cash flow. Quadrant 2:
Quadrant 4:
"URGENT" "DRAWING DOWN"
Add: 0.0 - VE Working Capital + VE
Short-Term Liquidity Rating 2.0
Debt to Equity
Mar-10 Jun-10 Sep-10 Dec-10 Mar-11 Utilities
Telecom
Equity
Number of Companies
Materials
Common Stock Equity $ 38.8 $ 37.6 $ 37.5 $ 38.3 $ 21.4 Info Tech
Industrials
Total Equity $ 38.8 $ 37.6 $ 37.5 $ 38.3 $ 21.4 Health Care
Energy
Cons Staples
Debt and Equivalents Cons Disc
DEJ-T
Pref. Securities of Sub Trust - - - - -
Pref. Equity Outside Stock Equity - - - - -
Preferred Stock Equity - - - - -
Minority Interest (Bal. Sheet) - - - - -
Short-Term Debt $ 3.9 $ 5.9 $ 4.0 $ 4.8 $ 4.5
Long-Term Debt - - $ 2.3 $ 0.3 -
Capital Lease Obligations - - - - -
Total Debt and Equivalents $ 3.9 $ 5.9 $ 6.3 $ 5.1 $ 4.5
0.00 1.00 2.00 3.00 4.00
Debt to Equity 0.10 0.16 0.17 0.13 0.21
Debt to Equity Rating 3.1 Low Risk Debt to Equity High Risk
Debt to Equity Rating 3.1
Interest Coverage
Mar-10 Jun-10 Sep-10 Dec-10 Mar-11 1.0 x
EBIT 0.9 x
Interest Coverage
Quarterly ($1.6) ($0.8) ($0.6) ($1.7) ($1.0) 0.8 x
TTM ($8.0) ($7.3) ($5.4) ($4.7) ($4.1) 0.7 x
0.6 x
N/A
Interest Expense
0.5 x
Quarterly $ 0.3 $ 0.3 $ 0.3 $ 0.2 $ 0.2
0.4 x
TTM $ 0.7 $ 0.8 $ 1.0 $ 1.1 $ 1.1
0.3 x
Interest Coverage 0.2 x
Quarterly #N/A #N/A #N/A #N/A #N/A 0.1 x
TTM #N/A #N/A #N/A #N/A #N/A
0.0 x
Mar-10 Jun-10 Sep-10 Dec-10 Mar-11
Interest Coverage Rating
Qtrly Interest Coverage Rating Quarterly
TTM Interest Coverage Rating TTM
Interest Coverage Rating N/A
9. investorSCOREcard
Dejour Energy (TSX:DEJ, AMEX:DEJ)
Revenue, EBITDA and EPS Rating 3.6
Revenue (in millions)
Revenue (in milions) on Rolling TTM
$9.00
$8.00
Annual (Fiscal Year) Dec-06 Dec-07 Dec-08 Dec-09 Dec-10 $7.00
Revenue $ - $ - $ 5.8 $ 6.8 $ 8.2
$6.00
Quarterly Mar-10 Jun-10 Sep-10 Dec-10 Mar-11 $5.00
Basis
Quarter Ending $ 1.3 $ 2.8 $ 2.5 $ 1.5 $ 1.6
$4.00
TTM $ 5.1 $ 6.2 $ 7.7 $ 8.2 $ 8.4
$3.00
Growth Percent Rating Stability R² Rating $2.00
Rev. Growth % TTM 65.5% 5.0
Rev. Growth % LFY 20.2% 4.0 Revenue Stability Last 2 Yrs $1.00
Rev. Growth % 3 Year CAGR Revenue Stability Last 3 Yrs $-
Rev. Growth % 5 Year CAGR Revenue Stability Last 5 Yrs Mar Mar Mar Mar Mar Mar Mar Mar Mar Mar
Revenue Growth Rating 4.5 Overall Revenue Stability Rating 02 03 04 05 06 07 08 09 10 11
Revenue Growth and Stability Rating 4.5
EBITDA (in millions)
EBITDA (in milions) on Rolling TTM
$ 2.00
$ 1.00
Annual (Fiscal Year) Dec-06 Dec-07 Dec-08 Dec-09 Dec-10 $-
EBITDA ($4.0) ($6.8) ($4.3) ($1.7) $ 0.2
($1.00)
($2.00)
Quarterly Mar-10 Jun-10 Sep-10 Dec-10 Mar-11
Basis
Quarter Ending ($0.9) $ 0.9 $ 0.8 ($0.3) ($0.3) ($3.00)
TTM ($2.9) ($1.7) $ 0.0 $ 0.6 $ 1.2 ($4.00)
($5.00)
Growth Percent Rating Stability R² Rating
EBITDA Growth % TTM 140.1% 5.0 ($6.00)
EBITDA Growth % LFY 111.0% 5.0 EBITDA Stability Last 2 Yrs 72.2% 3.6 ($7.00)
EBITDA Grwth % 3 Yr CAGR 153.9% 5.0 EBITDA Stability Last 3 Yrs 88.8% 4.4 ($8.00)
EBITDA Grwth % 5 Yrr CAGR EBITDA Stability Last 5 Yrs Mar Mar Mar Mar Mar Mar Mar Mar Mar Mar
EBITDA Growth Rating 5.0 Overall EBITDA Stablitity Rating 4.0 02 03 04 05 06 07 08 09 10 11
EBITDA Growth and Stability Rating 4.5
Basic Earnings Per Share (EPS*) $0.60
* (excluding acquired in process R&D, restructuring and M&A, special income & charges and discontinued ops)
$0.50
Annual (Fiscal Year) Dec-06 Dec-07 Dec-08 Dec-09 Dec-10 $0.40
EPS on Rolling TTM
EPS $ 0.50 ($0.07) ($0.29) ($0.16) ($0.05) $0.30
$0.20
Quarterly (TTM)
Basis
Mar-10 Jun-10 Sep-10 Dec-10 Mar-11
Quarter Ending ($0.02) ($0.01) ($0.01) ($0.01) ($0.02) $0.10
TTM ($0.14) ($0.14) ($0.12) ($0.05) ($0.05) $-
($0.10)
Growth Percent Rating Stability R² Rating
($0.20)
EPS Growth % TTM 64.3% 2.5
EPS Growth % LFY 68.8% 2.5 EPS Stability Last 2 Yrs 90.7% 4.5 ($0.30)
EPS Grwth % 3 Year CAGR 5.9% 1.2 EPS Stability Last 3 Yrs 0.3% 0.0 ($0.40)
EPS Grwth % 5 Year CAGR 3.6% 1.1 EPS Stability Last 5 Yrs 20.1% 0.5 Mar Mar Mar Mar Mar Mar Mar Mar Mar Mar
EPS Growth Rating 1.8 Overall EPS Stablitity Rating 1.7 02 03 04 05 06 07 08 09 10 11
EPS Growth and Stability Rating 1.8
10. investorSCOREcard
Dejour Energy (TSX:DEJ, AMEX:DEJ)
Return On Capital Rating 1.0
Return On Invested Capital (ROIC)
250%
Annual (Fiscal Year) Dec-06 Dec-07 Dec-08 Dec-09 Dec-10 200%
Invested Capital Period Ending $ 74.3 $ 60.5 $ 58.6 $ 43.1 $ 43.9
150%
Average Invested Capital $ 45.0 $ 67.4 $ 59.5 $ 50.8 $ 43.5
ROIC on Rolling TTM
* Net Income $ 26.5 ($4.6) ($20.9) ($12.8) ($5.2) 100%
Add Back: After Tax Interest Expense $ 0.1 $ 0.2 $ 0.3 $ 0.5 $ 0.7
50%
Annual ROIC 59.0% -6.5% -34.6% -24.2% -10.3%
Basis
Level Rating 5.0 1.2 0.0 0.2 0.9 0%
Consistency Rating 1.5
(50%)
Quarterly (TTM) Mar-10 Jun-10 Sep-10 Dec-10 Mar-11 (100%)
Invested Capital Period Ending $ 42.9 $ 43.8 $ 44.1 $ 43.9 $ 29.0
(150%)
Average Invested Capital $ 47.5 $ 45.3 $ 44.2 $ 43.6 $ 40.8
* Net Income ($13.3) ($13.5) ($11.8) ($5.2) ($5.4) (200%)
Add Back: After Tax Interest Expense $ 0.4 $ 0.5 $ 0.6 $ 0.7 $ 0.7 (250%)
Quarterly ROIC -27.1% -28.7% -25.4% -10.4% -11.6%
Level Rating 0.1 0.1 0.2 0.9 0.8 (300%)
Consistency Rating 0.4 Mar Mar Mar Mar Mar Mar Mar Mar Mar Mar
02 03 04 05 06 07 08 09 10 11
Return on Invested Capital (ROIC) Rating 0.9
Return On Assets (ROA)
100%
Annual (Fiscal Year) Dec-06 Dec-07 Dec-08 Dec-09 Dec-10
Total Assets Period Ending $ 80.7 $ 63.1 $ 62.3 $ 45.9 $ 46.4 0%
Average Total Assets $ 48.3 $ 71.9 $ 62.7 $ 54.1 $ 46.1
ROA on Rolling TTM
* Net Income $ 26.5 ($4.6) ($20.9) ($12.8) ($5.2) (100%)
Add Back: After Tax Interest Expense $ 0.1 $ 0.2 $ 0.3 $ 0.5 $ 0.7
Annual ROA 54.9% -6.1% -32.8% -22.7% -9.7%
(200%)
Basis
Level Rating 5.0 1.5 0.1 0.4 1.2
Consistency Rating 1.6
(300%)
Quarterly (TTM) Mar-10 Jun-10 Sep-10 Dec-10 Mar-11
Total Assets Period Ending $ 46.3 $ 47.5 $ 45.2 $ 46.4 $ 32.2 (400%)
Average Total Assets $ 50.6 $ 48.2 $ 46.8 $ 46.2 $ 43.5
* Net Income ($13.3) ($13.5) ($11.8) ($5.2) ($5.4)
(500%)
Add Back: After Tax Interest Expense $ 0.4 $ 0.5 $ 0.6 $ 0.7 $ 0.7
Quarterly ROA -27.1% -28.7% -25.4% -10.4% -11.6%
Level Rating 0.2 0.2 0.3 1.1 1.0 (600%)
Consistency Rating 0.6 Mar Mar Mar Mar Mar Mar Mar Mar Mar Mar
02 03 04 05 06 07 08 09 10 11
Return on Assets (ROA) Rating 1.1
Return On Common Equity (ROE)
250%
Annual (Fiscal Year) Dec-06 Dec-07 Dec-08 Dec-09 Dec-10
200%
Total Equity Period Ending $ 71.4 $ 59.4 $ 44.4 $ 39.7 $ 38.3
Average Common Equity $ 43.6 $ 65.4 $ 51.9 $ 42.0 $ 39.0 150%
ROE on Rolling TTM
* Net Income $ 26.5 ($4.6) ($20.9) ($12.8) ($5.2)
Add Back: NA $ - $ - $ - $ - $ - 100%
Annual ROE 60.8% -7.0% -40.3% -30.5% -13.3%
Basis
Level Rating 4.9 1.3 0.1 0.3 0.9 50%
Consistency Rating 1.5
0%
Quarterly (TTM) Mar-10 Jun-10 Sep-10 Dec-10 Mar-11 (50%)
Total Equity Period Ending $ 38.8 $ 37.6 $ 37.5 $ 38.3 $ 21.4
Average Common Equity $ 41.3 $ 40.4 $ 39.1 $ 38.4 $ 34.7 (100%)
* Net Income ($13.3) ($13.5) ($11.8) ($5.2) ($5.4)
Add Back: NA $ - $ - $ - $ - $ - (150%)
Quarterly ROE -32.2% -33.4% -30.3% -13.6% -15.5%
Level Rating 0.2 0.2 0.3 0.9 0.8 (200%)
Consistency Rating 0.5 Mar Mar Mar Mar Mar Mar Mar Mar Mar Mar
02 03 04 05 06 07 08 09 10 11
Return on Common Equity (ROE) Rating 0.9
* Net Income - Excludes Net Income from Discontinued Operations, Income Acquired in Process R&D, Income Restructuring And M&A, and Other Special Income/(Charges)
11. investorSCOREcard
Dejour Energy (TSX:DEJ, AMEX:DEJ)
Valuation Rating 2.0
Price to Earnings (P/E)
6.0 x
(Lower numbers receive higher rankings)
Annual (Fiscal Year) Dec-06 Dec-07 Dec-08 Dec-09 Dec-10 5.0 x
* Price $ - $ 1.25 $ 0.45 $ 0.31 $ 0.31
P/E on Rolling TTM
Earnings Per Share (EPS) $ 0.50 ($0.07) ($0.29) ($0.16) ($0.05)
4.0 x
Annual P/E
Basis
Annual P/E Rating 4.6 3.0 x
Quarterly (TTM) Mar-10 Jun-10 Sep-10 Dec-10 Mar-11 2.0 x
* Price $ 0.36 $ 0.40 $ 0.35 $ 0.31 $ 0.31
Earnings Per Share (EPS) ($0.14) ($0.14) ($0.12) ($0.05) ($0.05)
1.0 x
Quarterly (TTM) P/E
Quarterly (TTM) P/E Rating 0.0 x
Mar Mar Mar Mar Mar Mar Mar Mar Mar Mar
02 03 04 05 06 07 08 09 10 11
Price to Earnings (P/E) N/A
Price to Book (P/Book)
2.5 x
(Lower numbers receive higher rankings)
Annual (Fiscal Year) Dec-06 Dec-07 Dec-08 Dec-09 Dec-10
2.0 x
P/Book on Quarterly
* Price $ - $ 1.25 $ 0.45 $ 0.31 $ 0.31
Book Equity Per Share $ 1.17 $ 0.85 $ 0.60 $ 0.41 $ 0.32
1.5 x
Annual P/Book 1.5 x 0.7 x 0.7 x 1.0 x
Basis
Annual P/Book Rating 4.8 3.9 4.4 4.4 4.3
1.0 x
Quarterly Mar-10 Jun-10 Sep-10 Dec-10 Mar-11
* Price $ 0.36 $ 0.40 $ 0.35 $ 0.31 $ 0.31
Book Equity Per Share $ 0.39 $ 0.38 $ 0.37 $ 0.32 $ 0.18 0.5 x
Quarterly P/Book 0.9 x 1.0 x 0.9 x 1.0 x 1.8 x
Quarterly P/Book Rating 4.3 4.3 4.3 4.3 3.7 0.0 x
Mar Mar Mar Mar Mar Mar Mar Mar Mar Mar
02 03 04 05 06 07 08 09 10 11
Price to Book (P/Book) 4.0
Enterprise Value to EBITDA (EV/EBITDA)
7000.0 x
(Lower numbers receive higher rankings)
6000.0 x
EV/EBITDA on Rolling TTM
Annual (Fiscal Year) Dec-06 Dec-07 Dec-08 Dec-09 Dec-10
* Enterprise Value ($16.3) $ 75.2 $ 45.4 $ 30.2 $ 37.9
EBITDA ($4.00) ($6.80) ($4.29) ($1.75) $ 0.19 5000.0 x
Annual EV/EBITDA 221.1 x 4000.0 x
Basis
Annual EV/EBITDA Rating
3000.0 x
Quarterly (TTM) Mar-10 Jun-10 Sep-10 Dec-10 Mar-11
* Enterprise Value $ 38.1 $ 42.4 $ 39.1 $ 37.9 $ 37.8 2000.0 x
EBITDA ($2.90) ($1.68) $ 0.01 $ 0.60 $ 1.16
1000.0 x
Quarterly (TTM) EV/EBITDA 5955.1 x 71.5 x 36.2 x
Quarterly (TTM) EV/EBITDA Ratin 0.0 0.0 x
Mar Mar Mar Mar Mar Mar Mar Mar Mar Mar
02 03 04 05 06 07 08 09 10 11
Enterprise Value to EBITDA (EV/EBITDA) 0.0
* Price - Delayed 60 days to reflect the fact that financial statements are public approximately 60 days after the last day of the reporting period. For the last period the most recent price is used.
12. investorSCOREcard
Disclosure and Disclaimer
The issuer (“Issuer”) covered under this investor scorecard (“Investor Scorecard”) has paid a fee or has been charged a fee for the
production and distribution of this Investor Scorecard. The fee paid or charged for the production and distribution of this Investor
Scorecard was not subject to the rankings or information provided herein, nor was any securities of the Issuer accepted as
payment for such fee. FSA Financial Science & Art Ltd. (“FSA”), The Equicom Group Inc. (“Equicom”) and their respective
employees and directors may have had or from time to time acquire, hold or sell an interest in the listed securities of the Issuer.
Unless specified otherwise, all forward looking statements in this Investor Scorecard have been approved by the Issuer, and the
Issuer has advised FSA and Equicom, without independent verification by FSA or Equicom that a reasonable basis exists for such
forward looking statements. Other information contained in this Investor Scorecard has been compiled by FSA or Equicom from
sources believed to be reliable, which may include but not limited to, public information, research reports and discussions with
management of the Issuer. Prior to its publication, this Investor Scorecard had been submitted to the management of the Issuer
for review for factual accuracy.
No representation or warranty, express or implied, is made by FSA, Equicom, its affiliates, any other person that provided
information or data for this Investor Scorecard or any person that distributes this Investor Scorecard with respect to the adequacy,
accuracy, completeness or timeliness of any information, estimates or opinions provided in this Investor Scorecard. All estimates,
opinions and other information in this Investor Scorecard are provided by FSA, Equicom or another party as of the date of this
Investor Scorecard. Such estimates, opinions and other information are subject to change without notice, and are provided in
good faith but without any legal responsibility. Past performance is no guarantee of future results.
This Investor Scorecard is provided for informational purposes only and does not constitute an offer or solicitation to buy or sell
any securities discussed herein in any jurisdiction. The securities discussed in this Investor Scorecard may not be eligible for sale in
some jurisdictions. This Investor Scorecard is not, and under no circumstances should be construed as, a solicitation to act as a
securities broker, dealer or advisor in any jurisdiction by any person or company that is not legally permitted to carry on the
business of a securities broker, dealer or advisor in that jurisdiction. Neither FSA nor Equicom is a registered investment dealer,
broker or advisor, has investment banking operations or makes markets in any securities.
This Investor Scorecard is prepared for general circulation and to provide an overview of Issuer’s business. This Investor Scorecard
does not consider the investment objectives, financial situation or particular needs of any particular person, and is not tailored to
the needs of any person receiving this Investor Scorecard. Readers of this Investor Scorecard should obtain professional advice
based on their own individual circumstances before making an investment decision. Nothing in this Investor Scorecard constitutes
individual investment, legal or tax advice. To the fullest extent permitted by law, FSA, Equicom, Morningstar Inc., its content
providers, any other person that has provided information or data for this Investor Scorecard nor any authorized person that
distributes this Investor Scorecard accepts any liability whatsoever for any direct, indirect, special, economic or consequential loss
(whether in contract or tort even if FSA, Equicom or the other party has been advised of the possibility of such loss) arising from
any use of, or reliance on the estimates, opinions or other information contained in this Investor Scorecard.
Without limiting the generality of the foregoing, you are prohibited from using or disclosing any personal information contained in
the Investor Scorecard for purposes unrelated to the purposes for which the information is made available to you and/or the public
under Canadian securities laws, including, without limitation, for secondary marketing purposes, unless you have obtained any and
all consents as required under applicable Canadian privacy laws.
The information contained in this Investor Scorecard is copyrighted, and it may not be sold or licensed for commercial value or
altered, in whole or in part, without prior express written consent of Equicom. Furthermore, Investor Scorecard can only be
distributed in its entirety. Information or data herein, including any trade mark, service mark or logo is the intellectual property of
FSA, Equicom, Morningstar Inc. and/or its content providers, Issuer or other persons that have provided such information or data,
including but not limited to the organizations listed below and their respective content providers.
This report was produced in part with information from the following organizations: