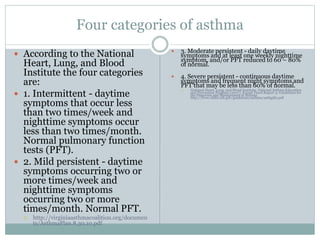
1. R A C H E L P R Y O R
E P I D 6 9 1
F E B R U A R Y 2 5 , 2 0 1 3
Asthma and COPD
2. What is asthma?
Disorder of the airways
causing swelling and
narrowing; which leads
to wheezing, shortness of
breath, chest tightness,
and coughing
Most common asthma
triggers: dust, animal
dander, weather changes,
pollution, mold, pollen,
respiratory infections,
stress, tobacco smoke
There is no cure for
asthma.
http://www.ncbi.nlm.nih.gov/pubmedhe
alth/PMH0001196/
3. Four categories of asthma
According to the National
Heart, Lung, and Blood
Institute the four categories
are:
1. Intermittent - daytime
symptoms that occur less
than two times/week and
nighttime symptoms occur
less than two times/month.
Normal pulmonary function
tests (PFT).
2. Mild persistent - daytime
symptoms occurring two or
more times/week and
nighttime symptoms
occurring two or more
times/month. Normal PFT.
http://virginiaasthmacoalition.org/documen
ts/AsthmaPlan.8.30.10.pdf
3. Moderate persistent - daily daytime
symptoms and at least one weekly nighttime
symptom, and/or PFT reduced to 60 – 80%
of normal.
4. Severe persistent - continuous daytime
symptoms and frequent night symptoms and
PFT that may be less than 60% of normal.
National Heart, Lung, and Blood Institute, National Asthma Education
and Prevention Program (2007). Expert Panel Report 3: Guidelines for
the Diagnosis and Management of Asthma.
http://www.nhlbi.nih.gov/guidelines/asthma/asthgdln.pdf
4. Asthma: Incidence and Prevalence
18.9 million adults, or 8.2% of the adult population, in
the U.S. have asthma
7.1 million children, or 9.5% of children, in the U.S. have
asthma
http://www.cdc.gov/nchs/fastats/asthma.htm
Incidence of asthma in adults is 3.8/1000 at-risk adults
Incidence of asthma in children is 12.5/1000 at-risk
children
Among children 0-4 years old, incidence is 23.4/1000 children!
Winer, Rachel A., Xiaoting Qin, B.A., Harrington, Theresa, Moorman, Jeanne, Zahran, Hatice.
Asthma Incidence among Children and Adults: Findings from the Behavioral Risk Factor
Surveillance System Asthma Call-back Survey—United States, 2006–2008. Asthma, February
2012, Vol. 49, No. 1 , Pages 16-22 (doi:10.3109/02770903.2011.637594).
9. More statistics
Number of deaths caused by asthma (in 2010):
3,404
1.1/100,000 of the population
Number of outpatient visits per year with asthma
as primary diagnosis (in 2009): 1.2 million
Number of ED visits with asthma as primary
diagnosis (in 2009): 2.1 million
Number of hospital discharges with asthma as
first-listed diagnosis (in 2009): 479,000
Average length of stay: 4.3 days
http://www.cdc.gov/nchs/fastats/asthma.htm
10. The incidence of asthma is increasing
From 2001 – 2009, the incidence of asthma increased by
4.3 million
Rates grew the most (almost a 50% increase!) among black
children
Why?
Hygiene hypothesis: we’re “too clean”
Sedentary lifestyle: decreases lung strength
Obesity: increases overall inflammatory response of the human body
Changes in immune system as we “modernize”
http://www.scientificamerican.com/article.cfm?id=why-are-asthma-rates-soaring
11. The cost of asthma
Medical expenses per
person per year is $3300
on average.
40% of uninsured people
could not afford their
asthma-related
medications, and 11% of
insured people could not
afford their asthma-
related medications
between 2002-2007.
Asthma costs in the US
in 2002 were
approximately $53
billion – in 2007 they
were approximately $56
billion.
59% of children and 33%
of adults with asthma
missed school or work
due to asthma in 2008.
On average, children
missed 4 days of school
and adults missed 5 days
of work because of asthma
http://www.cdc.gov/VitalSigns/Asthma/i
ndex.html
12. Asthma and Public Health
There are many public health initiatives in place to
reduce asthma exacerbations
Community Preventative Services Task Force’s
initiative “Asthma Control: Home Based Multi
Trigger, Multicomponent Environmental
Interventions”
Home visits are conducted by a trained person to assess home
environments and educate families about what can be done to
decrease asthma triggers and also how to better self-manage
one’s asthma
http://www.thecommunityguide.org/asthma/multicomponent.html
13. Public Health Initiatives cont.
Healthy People 2020 goal: “Promote respiratory
health through better prevention, detection,
treatment, and education efforts”
Specific objectives:
http://www.healthypeople.gov/2020/topicsobjectives2020/o
bjectiveslist.aspx?topicId=36
“Increase the number of States, Territories, and the District of
Columbia with a comprehensive asthma surveillance system for
tracking asthma cases, illness, and disability at the State level”
No Virginia data on the CDC website!
http://www.cdc.gov/asthma/stateprofiles.htm
http://www.healthypeople.gov/2020/topicsobjectives2020/overview.aspx?topicid=36
14. In 2008, less than half of the people
diagnosed with asthma reported being
taught how to avoid triggers.
48% of adults who were taught about
trigger avoidance did not follow most of
their doctor’s teaching.
http://www.cdc.gov/VitalSigns/Asthma/index.html#StateInfo
15. Asthma in Virginia
In 2010, the Virginia Asthma Coalition released a
plan for Virginia
And VDH does track Virginia data (though the last
comprehensive report was written in 2007, using
data through 2004)
7.3% of adults (412,370 people) in Virginia have
asthma
9% of children (152,277 people) in Virginia have
asthma
In 2004, total cost of asthma hospitalizations in
Virginia was $96 million! (which was a 58% increase
from 1999)
https://www.vdh.virginia.gov/news/PressKits/Asthma/Overview.pdf
16. Asthma in Virginia
Current
asthma
rates in
Virginia
have slightly
increased
since 2000
(average in
2000 was
7.1%, in
2008 it was
9.3%)
https://www.vdh.virginia.gov/news/PressKits/Asthma/Overview.pdf
17. Virginia compared to the US
https://www.vdh.virginia.gov/news/PressKits/Asthma/Overview.pdf
21. Research Needs
According to the EPA, some of the most important
areas of research related to asthma include:
More information about the induction and exacerbation of
asthma
Why the incidence of asthma is increasing
What factors make one more susceptible to asthma
Risk assessment of environmental pollutants and asthma
http://cfpub.epa.gov/ncea/cfm/recordisplay.cfm?deid=54825
22. What is COPD?
COPD is Chronic Obstructive Pulmonary Disease
and is characterized by diseases that cause airflow
blockage and problems related to breathing.
It includes emphysema, chronic bronchitis, and
asthma (in some cases).
COPD is caused by:
Tobacco exposure
Asthma
Air pollutants
Genetic factors
Respiratory infections
http://www.cdc.gov/copd/
23. Chronic bronchitis vs. emphysema
Chronic
bronchitis is
characterized
by a long-term
cough with
mucous
production
Emphysema is
characterized
by destruction
of the lungs
overtime
24. COPD: Prevalence
There is a vast under-diagnosis of COPD.
6.3% of American adults (approximately 15 million
people) have been diagnosed with COPD.
In adults aged 18-44, 3.2% of the population has been
diagnosed with COPD.
In adults ages 65 and older, 11.6% have been diagnosed
with COPD.
White adults have the highest rate of COPD (6.3%).
6.1% of black adults and 4.3% of Hispanic adults have
COPD.
9.5% of those with COPD did not have a high school
diploma
http://www.cdc.gov/mmwr/preview/mmwrhtml/mm6146a2.htm#fig
25. • In 2008, 9.8 million adults were diagnosed with chronic
bronchitis.
• In 2008, 3.8 million adults reported having ever been
diagnosed with emphysema.
• Surprisingly (to me), more women than men suffer from
these diseases.
• http://www.lung.org/assets/documents/publications/solddc-chapters/copd.pdf
27. COPD in Virginia
Chronic bronchitis is the second leading hospital
discharge diagnosis in Virginia.
Emphysema is the seventh leading hospital diagnosis
in Virginia.
http://www.vapremier.com/index.php?page=copd-management-program
29. Morbidity and mortality
The estimated cost of COPD in 2010 was $49.9
billion.
$29.5 billion related to direct hospital costs, $8 billion on
indirect morbidity costs, and $12.4 billion on indirect
mortality costs
COPD is the third leading cause of death in the USA,
claiming 124,477 lives in 2007.
672,000 hospitalizations in 2006 were due to COPD.
http://www.lung.org/lung-disease/copd/resources/facts-figures/COPD-Fact-Sheet.html
30. Disparities and COPD
More Caucasians than
African Americans have
chronic bronchitis (50.8
per 1000 vs. 38.6 per
1000).
Rate among Hispanics
only 20.6 per 1000.
The same is true of
emphysema (21.1 per 1000
Caucasians vs. 8.1 per 1000
African Americans vs. 6.3
per 1000 Hispanics)
Among the uninsured,
African Americans were
significantly less likely than
Caucasians to receive a
lung transplant (61 vs 68%)
50.5 per 100,000 White
men died from COPD in
2006
Death rate for White
women was 39.1 per
100,000
Death rate for Black men
was 37.7 per 100,000
Death rate for Black
women was 18.9 per
100,000
http://www.lung.org/assets/documents/
publications/solddc-chapters/copd.pdf
31.
32. Public Health Research and COPD
Access to healthcare is a huge obstacle for Hispanics
who suffer from COPD
Studies who that they are twice as likely as Caucasians to
utilize the ER for management of their COPD
Words such as wheeze and dyspnea do not translate well into
Spanish
Hispanics are often grouped all together, rather than being
treated as people from various countries
More research needs to be done to define subgroups of
Hispanics and their relationship to the healthcare system in
the United States
http://www.lung.org/assets/documents/publications/solddc-chapters/copd.pdf
33. Public Health Research and COPD
Very limited information has been collected about
Asian Americans, Native Americans, and Native
Pacific Islanders and the prevalence of COPD among
these groups
http://www.lung.org/assets/documents/publications/solddc-chapters/copd.pdf
34. Healthy People 2020 and COPD
Reduce activity limitations among adults with
chronic obstructive pulmonary disease (COPD)
Reduce deaths from chronic obstructive pulmonary
disease (COPD) among adults
Reduce hospitalizations for chronic obstructive
pulmonary disease (COPD)
Reduce emergency department (ED) visits for
chronic obstructive pulmonary disease (COPD)
Increase the proportion of adults with abnormal lung
function whose underlying obstructive disease has
been diagnosed
http://www.healthypeople.gov/2020/topicsobjectives2020/objectiveslist.aspx?topicId=36
35. COPD Asthma
Rarely occurs before age 45
Rarely occurs in a non-
smoker
Little can be done to
improve sx. of COPD once
patients experience them
COPD patients rarely go a
day without experiencing
sx.
Lung function never
returns to normal
Can occur with asthma
Can occur at any age
Can occur in a smoker or
non-smoker
Removing environmental
triggers can greatly
improve asthmatic sx.
Asthmatics can go great
lengths of time in
between experiencing sx.
Lung function returns to
normal between attacks
Asthma vs. COPD
COPD is often misdiagnosed as asthma, which leads to ineffective treatment and
management. (http://copd.about.com/od/fa1/a/asthmaorcopd.htm)
36. SMOKING CESSATION IS KEY!
85 to 90% of COPD deaths are caused by smoking.
Smokers are 12% (in men) and 13% (in women) more
likely to die from COPD than non-smokers.
http://www.lung.org/lung-disease/copd/resources/facts-figures/COPD-Fact-Sheet.html
Smokers likelihood of developing COPD is 50%.
Risk of COPD decreased by 50% after quitting
smoking.
Laniado-Laborín, Rafael . Smoking and Chronic Obstructive Pulmonary Disease (COPD): Parallel
Epidemics of the 21st Century. International Journal of Environmental Research and Public
Health, 2009, 6, 209-224; doi:10.3390/ijerph6010209.
The results of this analysis are subject to at least four limitations. First, the asthma prevalence estimates in this report rely on self-report and are subject to recall bias. The respondent must correctly recall a physician diagnosis of asthma, which in turn requires that the physician diagnosis was correct and that the diagnosis was conveyed to the person. Because no definitive test exists for asthma, the diagnosis and self-report cannot be validated; however, a 1993 review of asthma questionnaires documented a mean sensitivity of 68% and a mean specificity of 94% when self-reported information on an asthma diagnosis was compared with a clinical diagnosis (1). Second, common to the majority of survey data, results might be biased because of response rates. NHIS is conducted by personal interview and had household response rates between 85% and 87% for the years included in this report. Third, because NHIS includes only the civilian, noninstitutionalized population of the United States, results might not be representative of other populations. Finally, because NHIS is conducted only in English and Spanish, results might not be representative of households whose residents have other primary languages.
Highest are Chesapeake and Lenowisco. Richmond is second highest with 10.8!
This is the first report of state-specific prevalence of COPD among adults in all 50 states, DC, and Puerto Rico; all data is self-reported!
Very little epidemiological data re: copd, no incidence of emphysema found