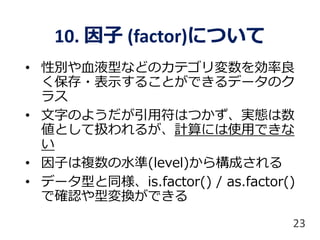
> y <-factor(c("A", "AB", "A", "A", "B", "O", "O"))
> y
[1] A AB A A B O O
Levels: A AB B O
> mode(y) # データの保存型を確認
[1] “numeric”
> class(y) # データのクラスは因子
[1] "factor"
> str(y) # オブジェクト構造を確認
Factor w/ 4 levels "A","AB","B","O": 1 2 1 1 3 4 4
因子について (つづき)
24

![演 習 一 覧
[演習1] まず電卓として使ってみよう
[演習2] 様々なデータ型の変数を作ってみよう
[演習3] 計算ができないデータ型はどれ?
[演習4] 様々な構造の変数を作ってみよう
3
演習用コードファイル:
Rデモ01_はじめの一歩.r](https://image.slidesharecdn.com/r012016slideshare-161003142542/85/R_-2016-3-320.jpg)


![[補足] 32bit版と64bit版について
(※) 使用したいパッケージやコードが古く、
64bit版に対応しない場合は、例外的に32bit版
をインストールする
9
CPU OS R
32bit版 32bit版 32bit版のみ
64bit版 32bit版 32bit版のみ
64bit版 64bit版 原則64bit版(※)](https://image.slidesharecdn.com/r012016slideshare-161003142542/85/R_-2016-9-320.jpg)
![[演習1]
まず電卓として使ってみよう!
13
ポイント
• 長い式は、そのまま複数行に書くが、途中の
各行の最後は「+」などの演算子にする
• 二つ以上の計算式を一行に書くときは、セミ
コロンを使う
• 矢印キー「↑」で過去に打ったコマンドを呼
び出せる
• 「#」 の後ろはコメント(一行分)](https://image.slidesharecdn.com/r012016slideshare-161003142542/85/R_-2016-13-320.jpg)
![7. 変数の作り方
• 英数字、ピリオド(.)、アンダースコア(_)を組み合わ
せて作る
• 英字の大文字・小文字は区別される
• 変数名には日本語も使用可能(非推奨)
• 数字とアンダースコアを変数名の冒頭にすることはで
きない
• 以下のような記号は使用できない
?, $, %, ^, &, *, (, ), -, #, ?, , , <, >, /, |, , [ ,] ,{ ,};
• 予め使途が定められた予約語も変数名に使用できない
break else FALSE for function if in Inf NA NaN next
NULL repeat TRUE while
14](https://image.slidesharecdn.com/r012016slideshare-161003142542/85/R_-2016-14-320.jpg)
![8. 主なデータ型、その検査と変換
変数のデータ型はmode()で調べられる
• 実数 (numeric) ※ 倍精度浮動小数点
[is.numeric() / as.numeric()]
• 整数(integer)
[is. integer() / as. integer()]
• 文字 (character)
[is.character() / as.character()]
• 論理値 (logical) : TrueとFalseのニ値
[is.logical() / as.logical()] 16
[型チェック関数 / 型変換関数]](https://image.slidesharecdn.com/r012016slideshare-161003142542/85/R_-2016-16-320.jpg)
![[演習2]
様々なデータ型の変数を作ろう!
17
ポイント
• データ型の調べ方
• データ型の変更方法
• NAとの遭遇](https://image.slidesharecdn.com/r012016slideshare-161003142542/85/R_-2016-17-320.jpg)
![[演習3]
計算ができないデータ型は?
18
ポイント
• 計算トラブルは型が問題
• 自動的に型が変わるとき
• 論理値データは計算できる](https://image.slidesharecdn.com/r012016slideshare-161003142542/85/R_-2016-18-320.jpg)
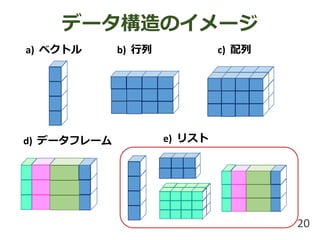
![9. データの構造(オブジェクト型)
• ベクトル(vector)一次元
[ is.vector() / as.vector() ]
• 行列(matrix) 二次元
[ is.matrix() / as.matrix() ]
• 配列(array) 三次元以上
[ is.array() / as.array() ]
• リスト(list) 関数の戻り値
[ is.list() / as.list() ]
• データフレーム(data frame)
[ is.data.frame() / as.data.frame() ]
19](https://image.slidesharecdn.com/r012016slideshare-161003142542/85/R_-2016-19-320.jpg)
![[演習4]
様々な構造の変数を作ろう!
22
ポイント
• 変数には型と構造がある
• 変数から目的の要素を取り出す方法
• Rのベクトルは横表示の縦ベクトル
• 要素の再利用に注意!](https://image.slidesharecdn.com/r012016slideshare-161003142542/85/R_-2016-22-320.jpg)
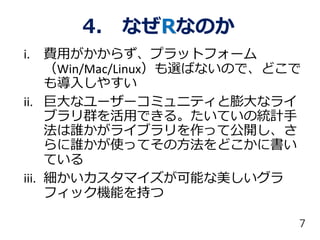
![> y <- factor(c("A", "AB", "A", "A", "B", "O", "O"))
> y
[1] A AB A A B O O
Levels: A AB B O
> mode(y) # データの保存型を確認
[1] “numeric”
> class(y) # データのクラスは因子
[1] "factor"
> str(y) # オブジェクト構造を確認
Factor w/ 4 levels "A","AB","B","O": 1 2 1 1 3 4 4
因子について (つづき)
24](https://image.slidesharecdn.com/r012016slideshare-161003142542/85/R_-2016-24-320.jpg)
![13. さらに学ぶために
① Webサイトを活用する
RjpWiki http://www.okadajp.org/RWiki/
Rに関する情報交換を目的としたWikiサイト
SeekR http://seekr.jp/ Rのための検索エンジン
② 良い参考書を入手する => 次スライド以降
RjpWikiのR本リスト
http://www.okadajp.org/RWiki/?R%E6%9C%AC%E3%83%AA%E3%82%B9
%E3%83%88
③ 身近に一緒に勉強できる仲間を作る
④ 難しければ地域の勉強会に顔を出してみる
Fukuoka.R, Kashiwa.R, Kobe.R, Nagoya.R, Okinawa.R, Osaka.r
SappoRo.R, Shiga.R, Tokyo.R, Tsukuba.R, Yokohama.R などが存在し、
これらをまとめる形で例年11月末から12月上旬にJapan.Rが開催
される
[ Japan.R2015 https://atnd.org/events/71243 昨年は12/5 ]
#japanr #TokyoR などのハッシュタグで検索可能
30](https://image.slidesharecdn.com/r012016slideshare-161003142542/85/R_-2016-30-320.jpg)


![[データマイニング+WEB勉強会][R勉強会] はじめてでもわかる 統計解析・データマイニング R言語入門](https://cdn.slidesharecdn.com/ss_thumbnails/rlecturehamada100213-100216161757-phpapp01-thumbnail.jpg?width=640&height=640&fit=bounds)


