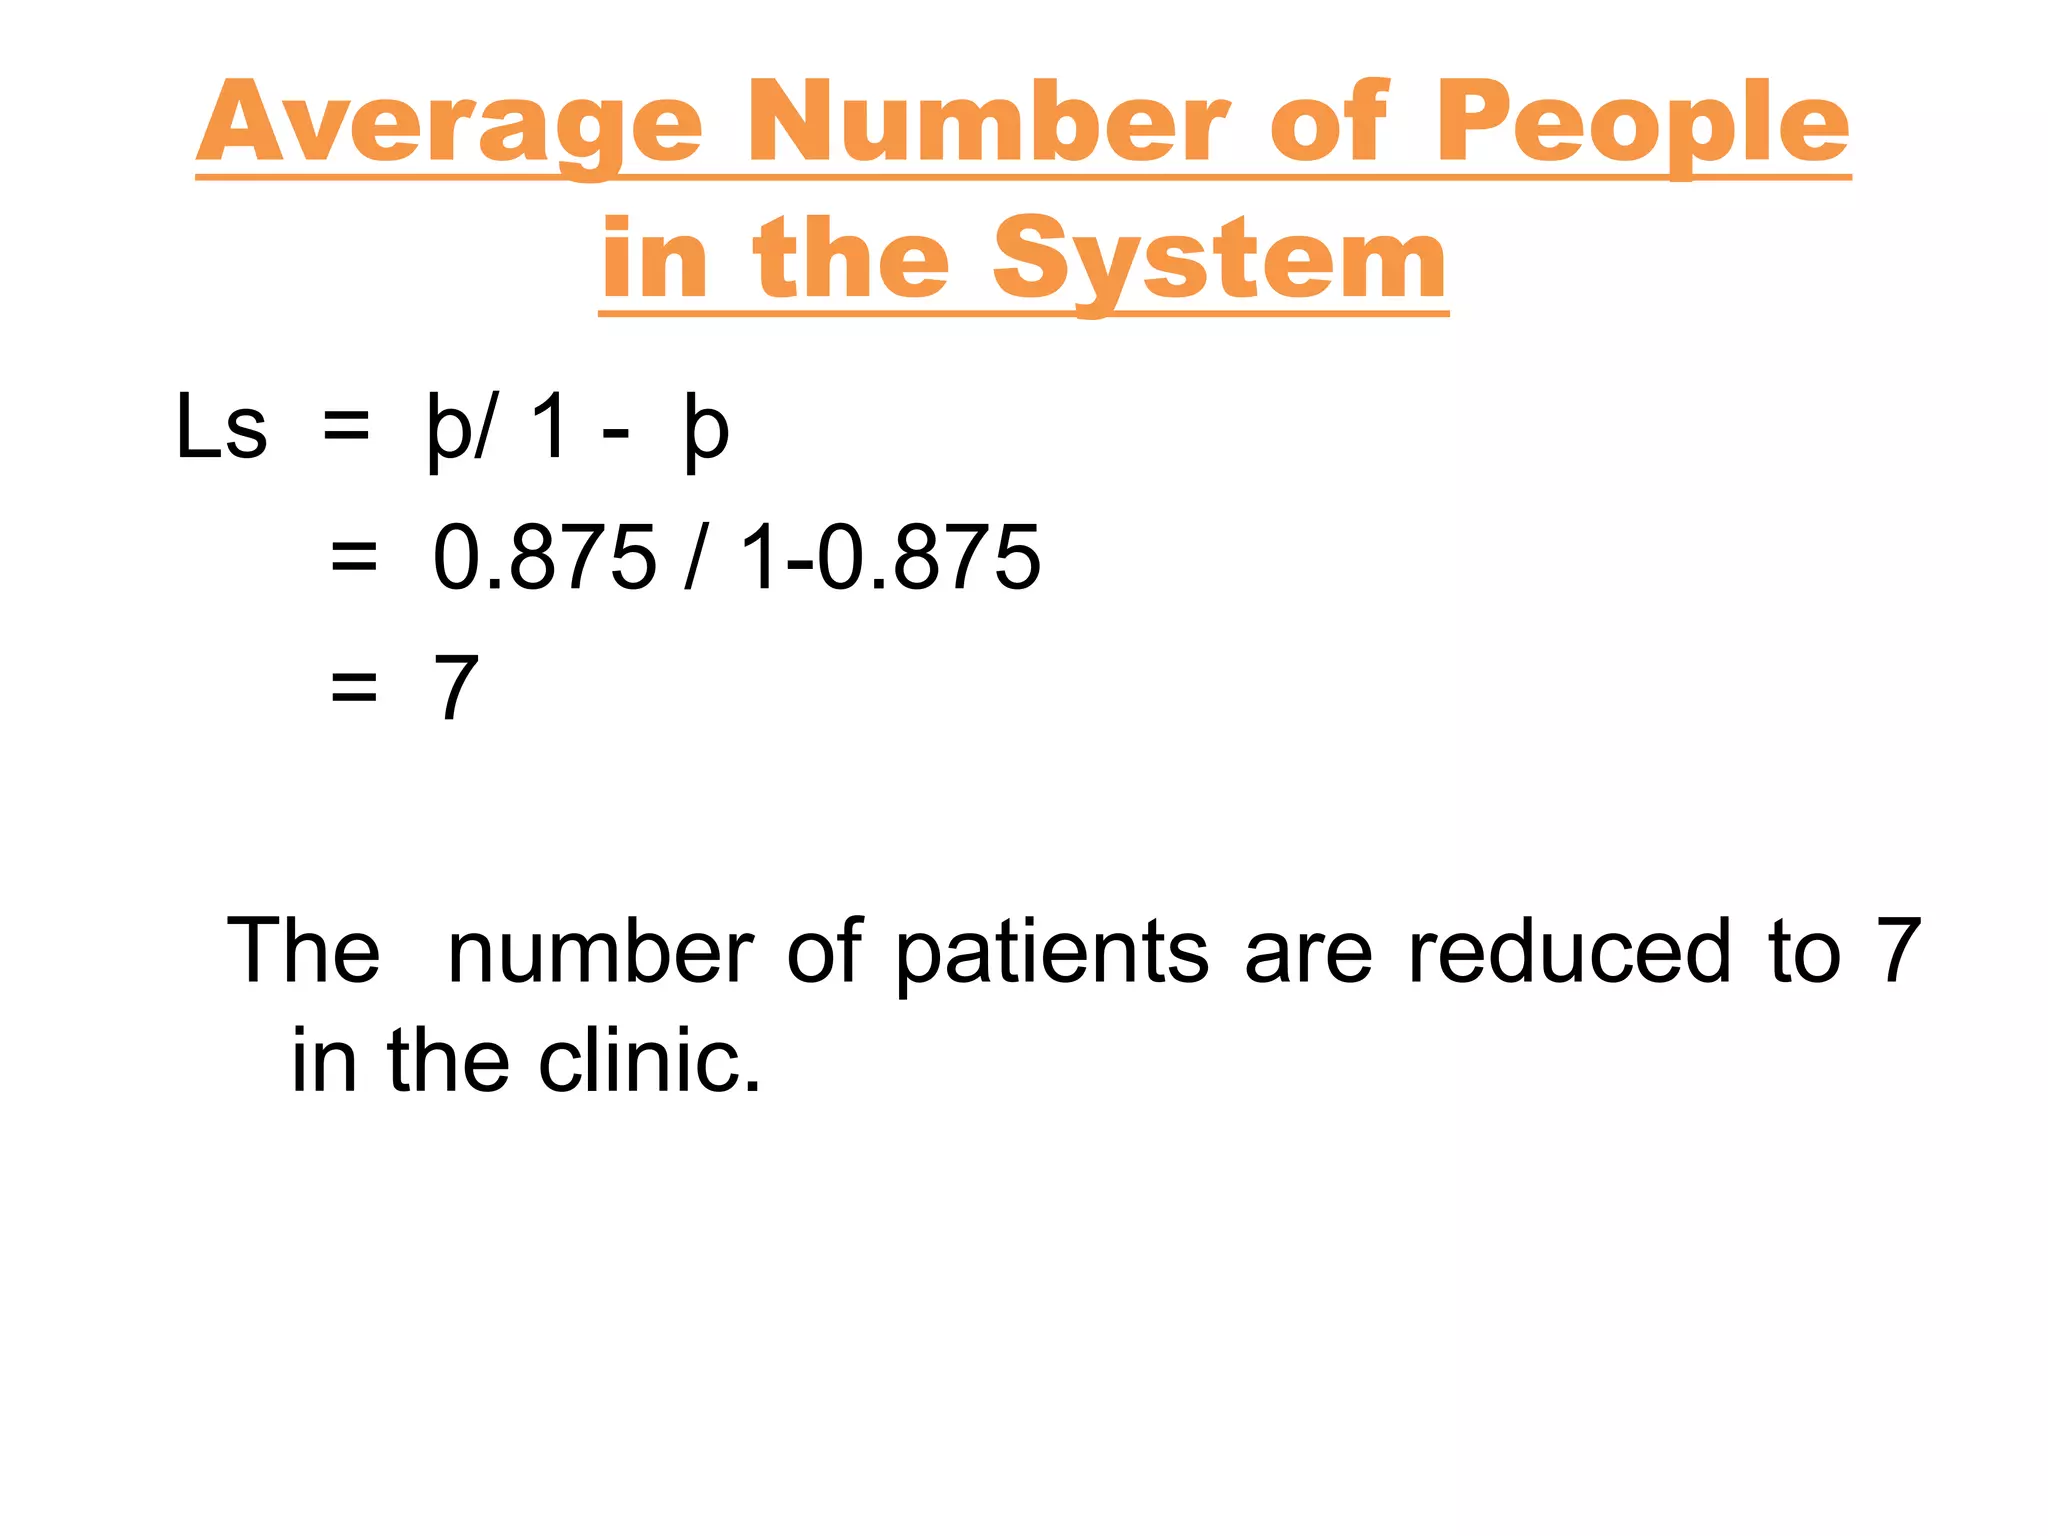
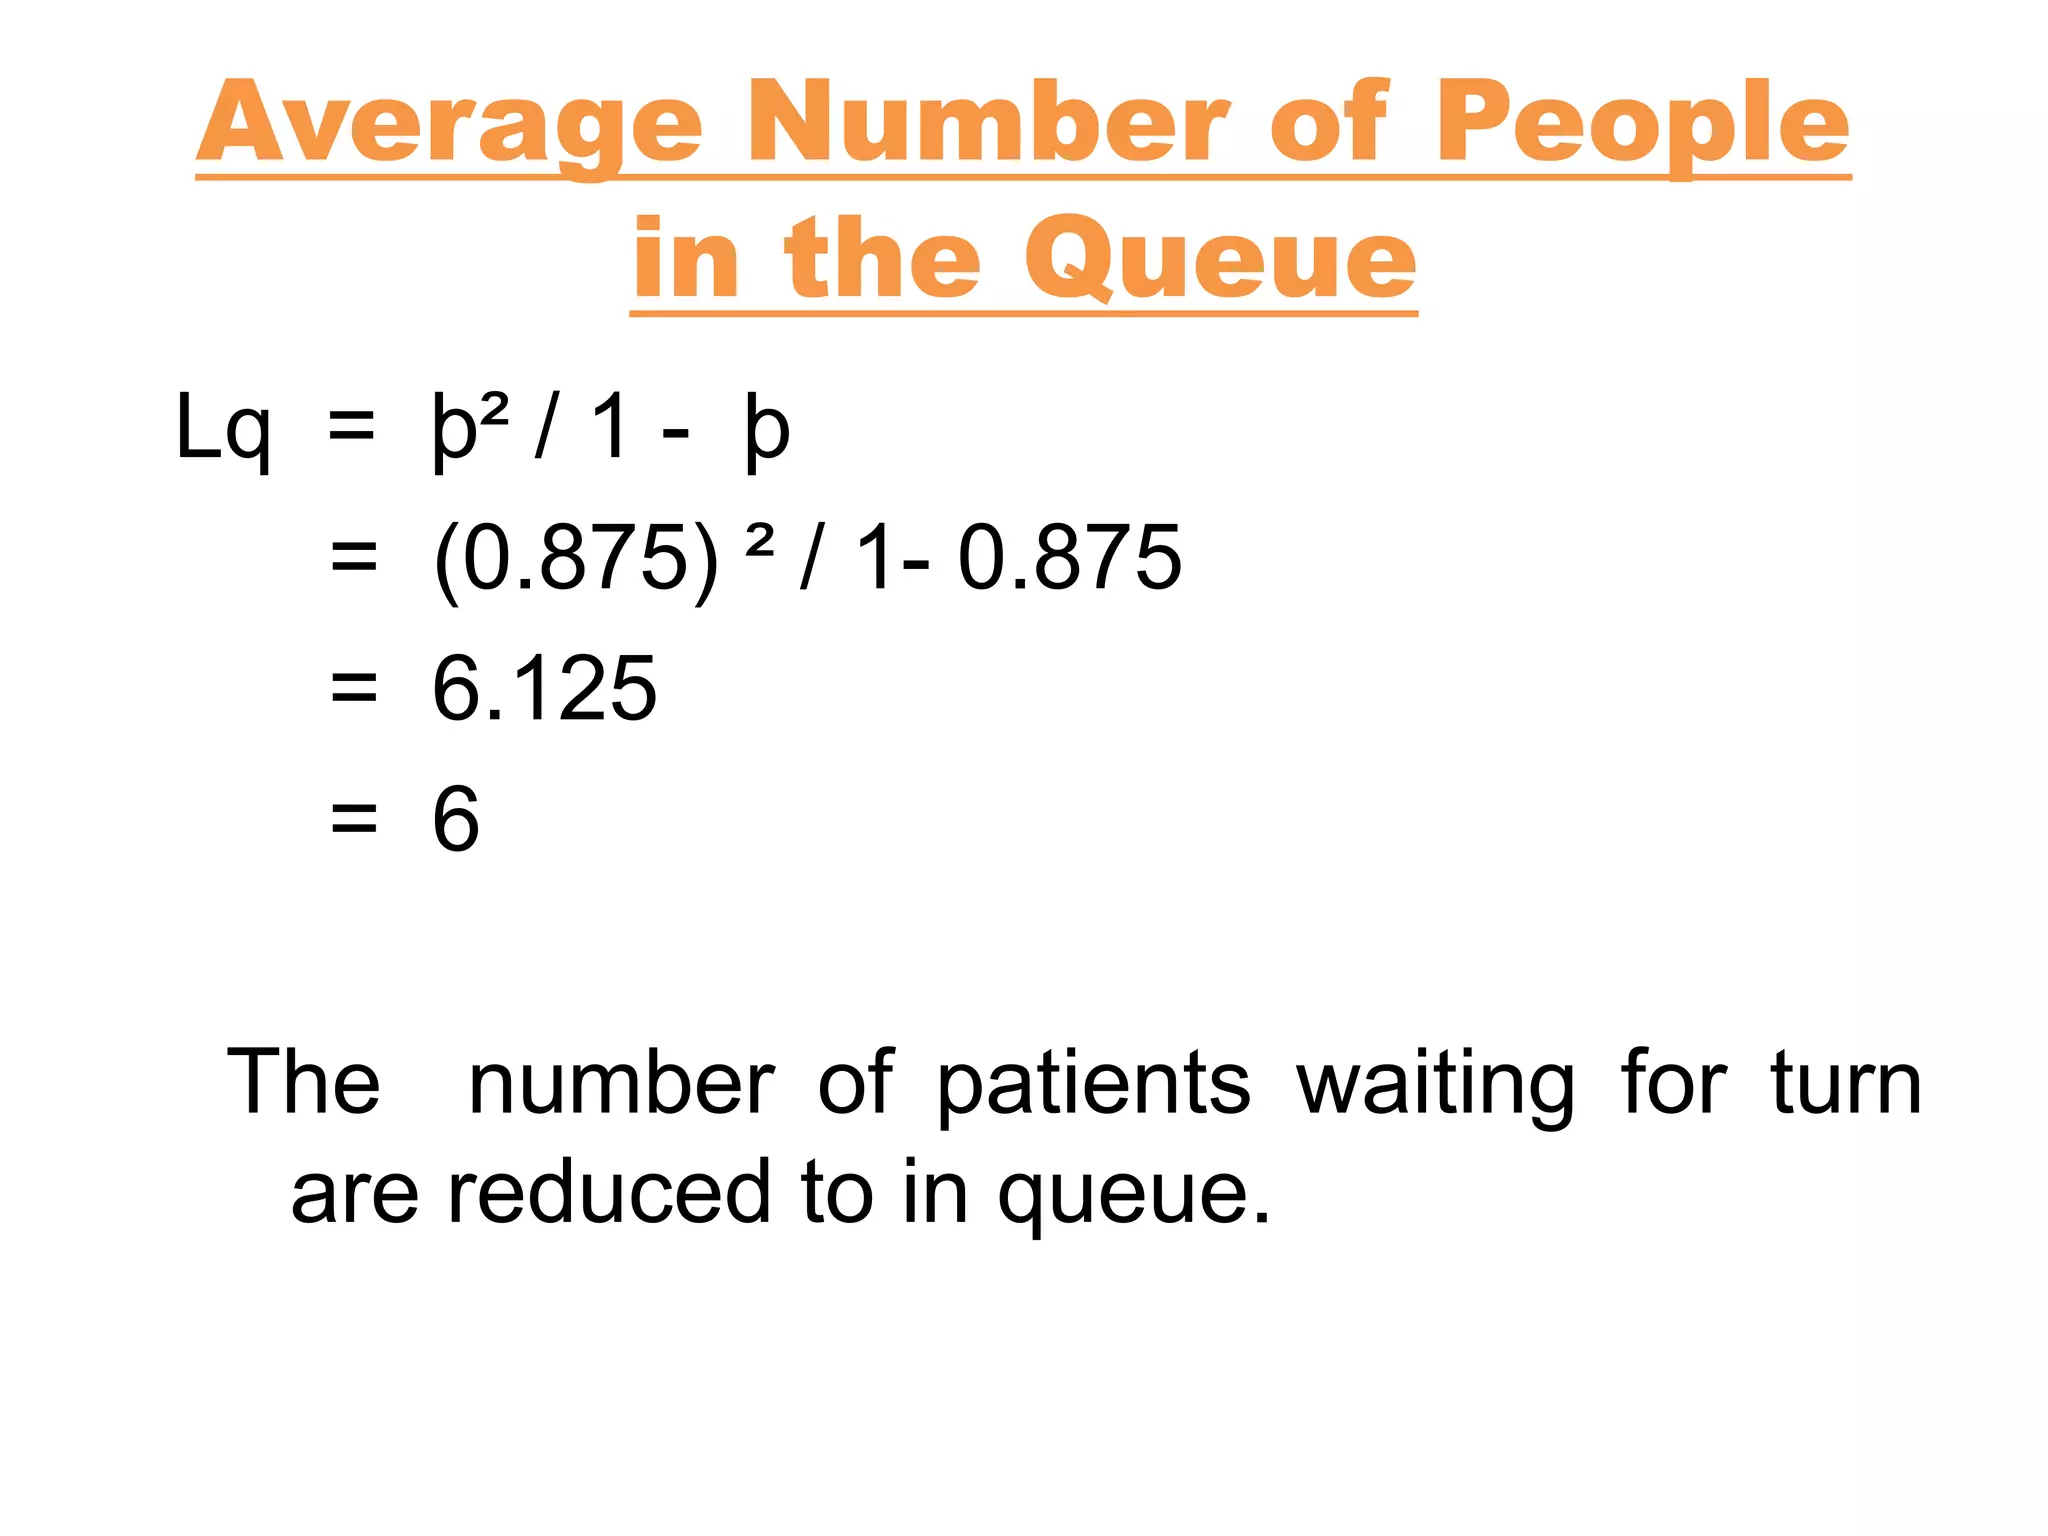
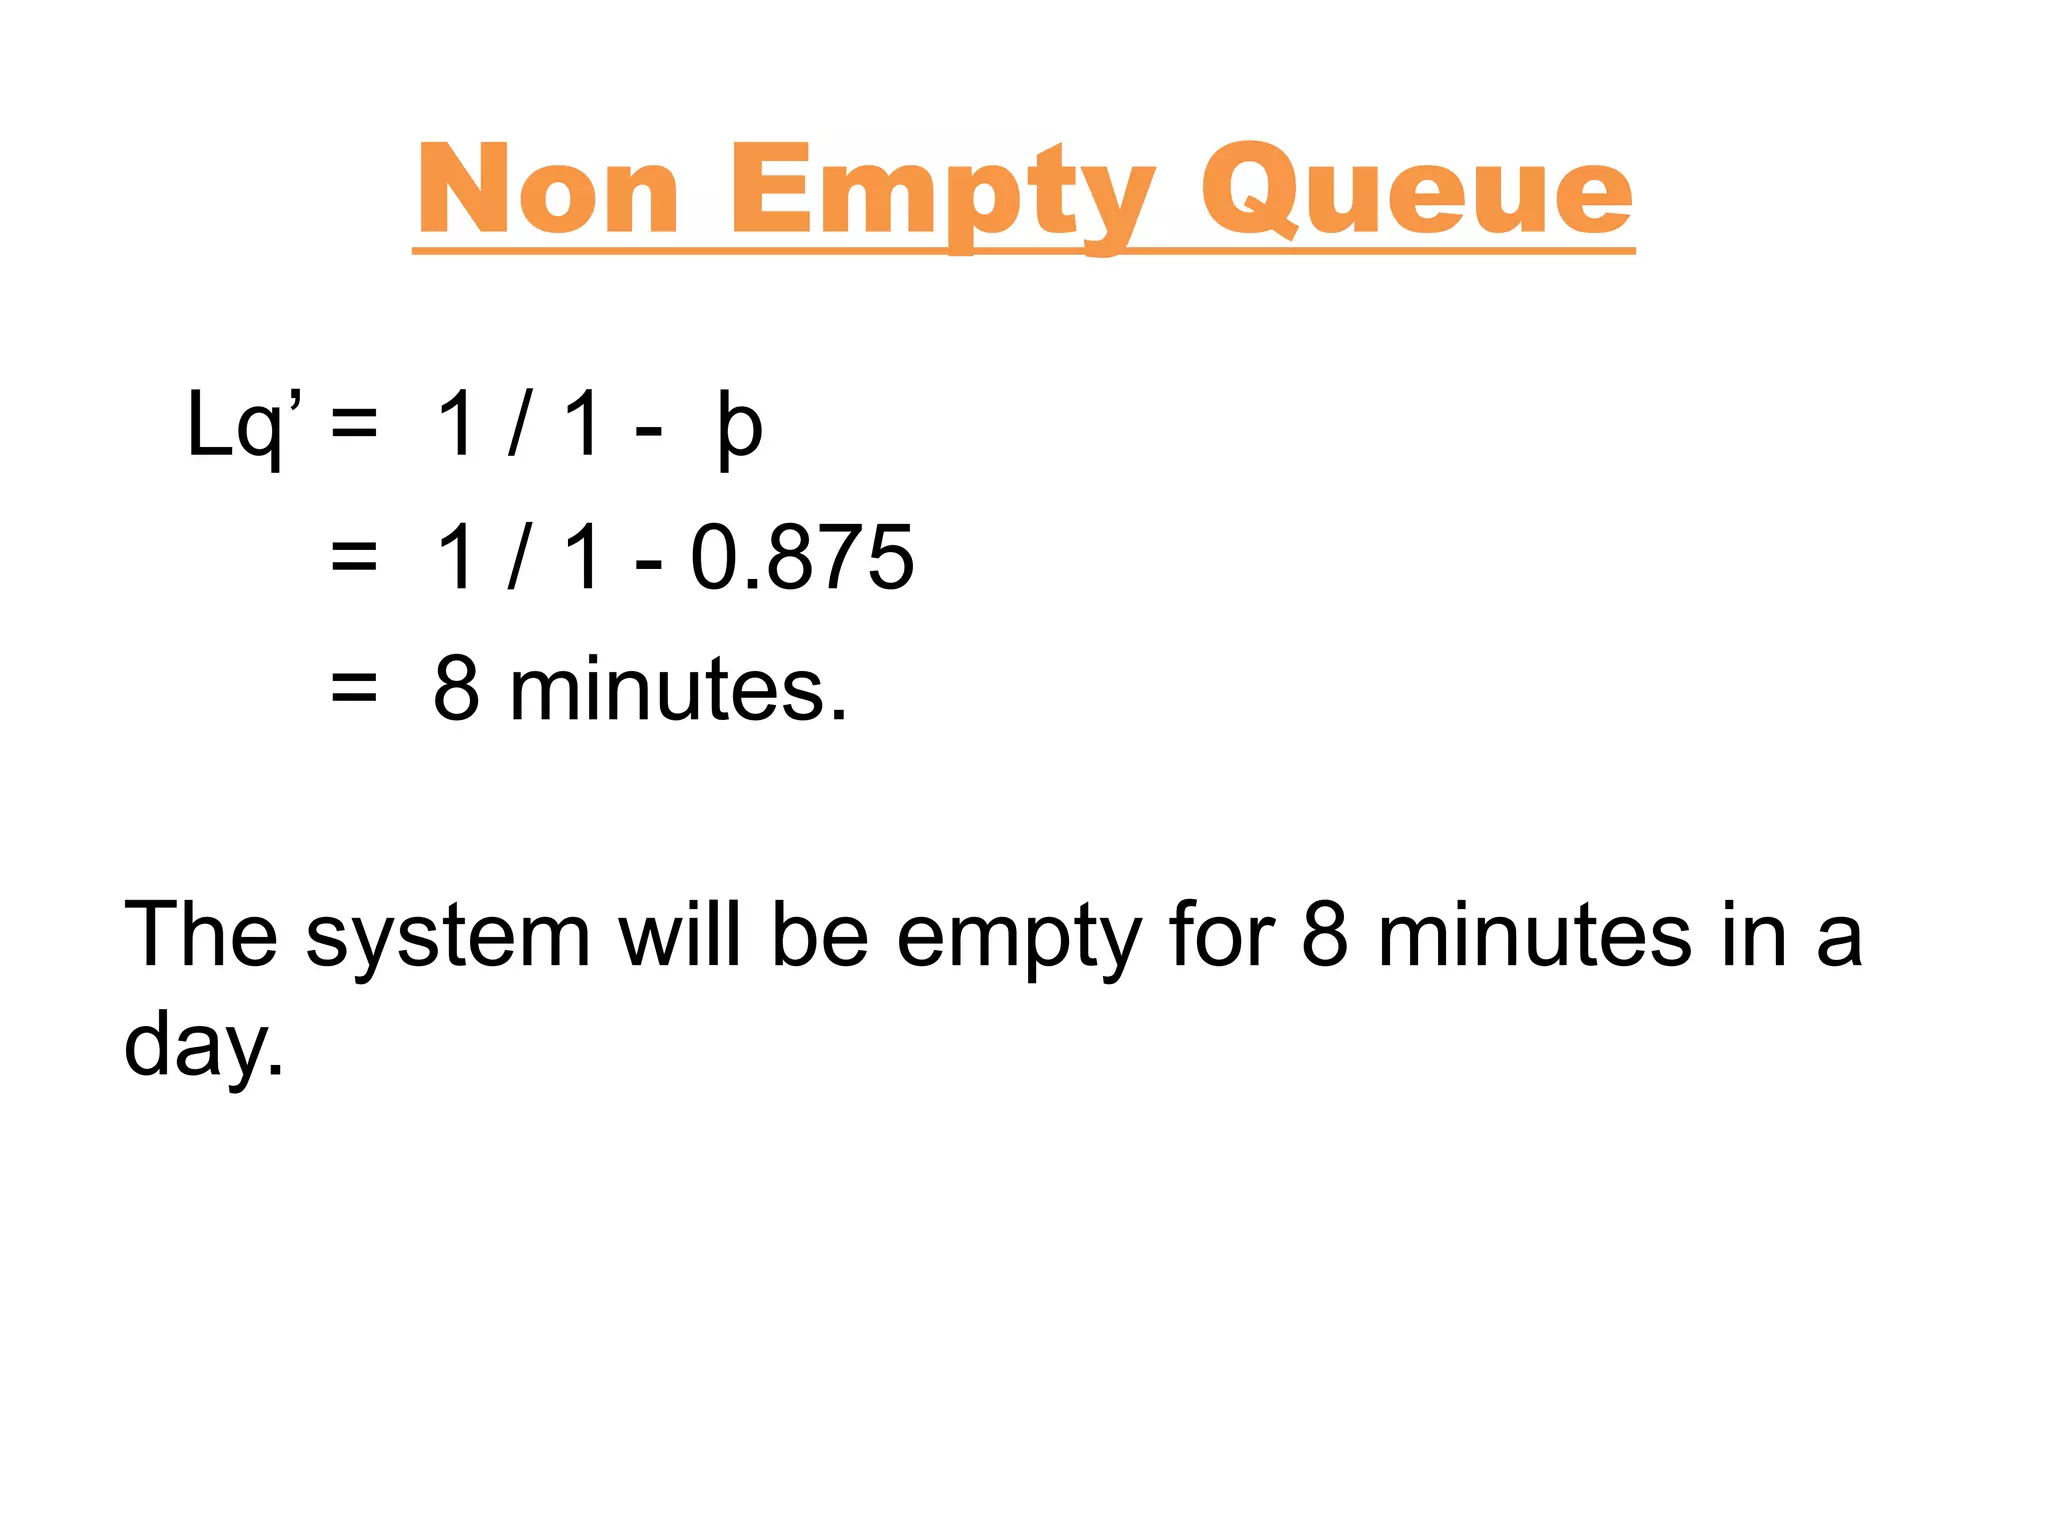
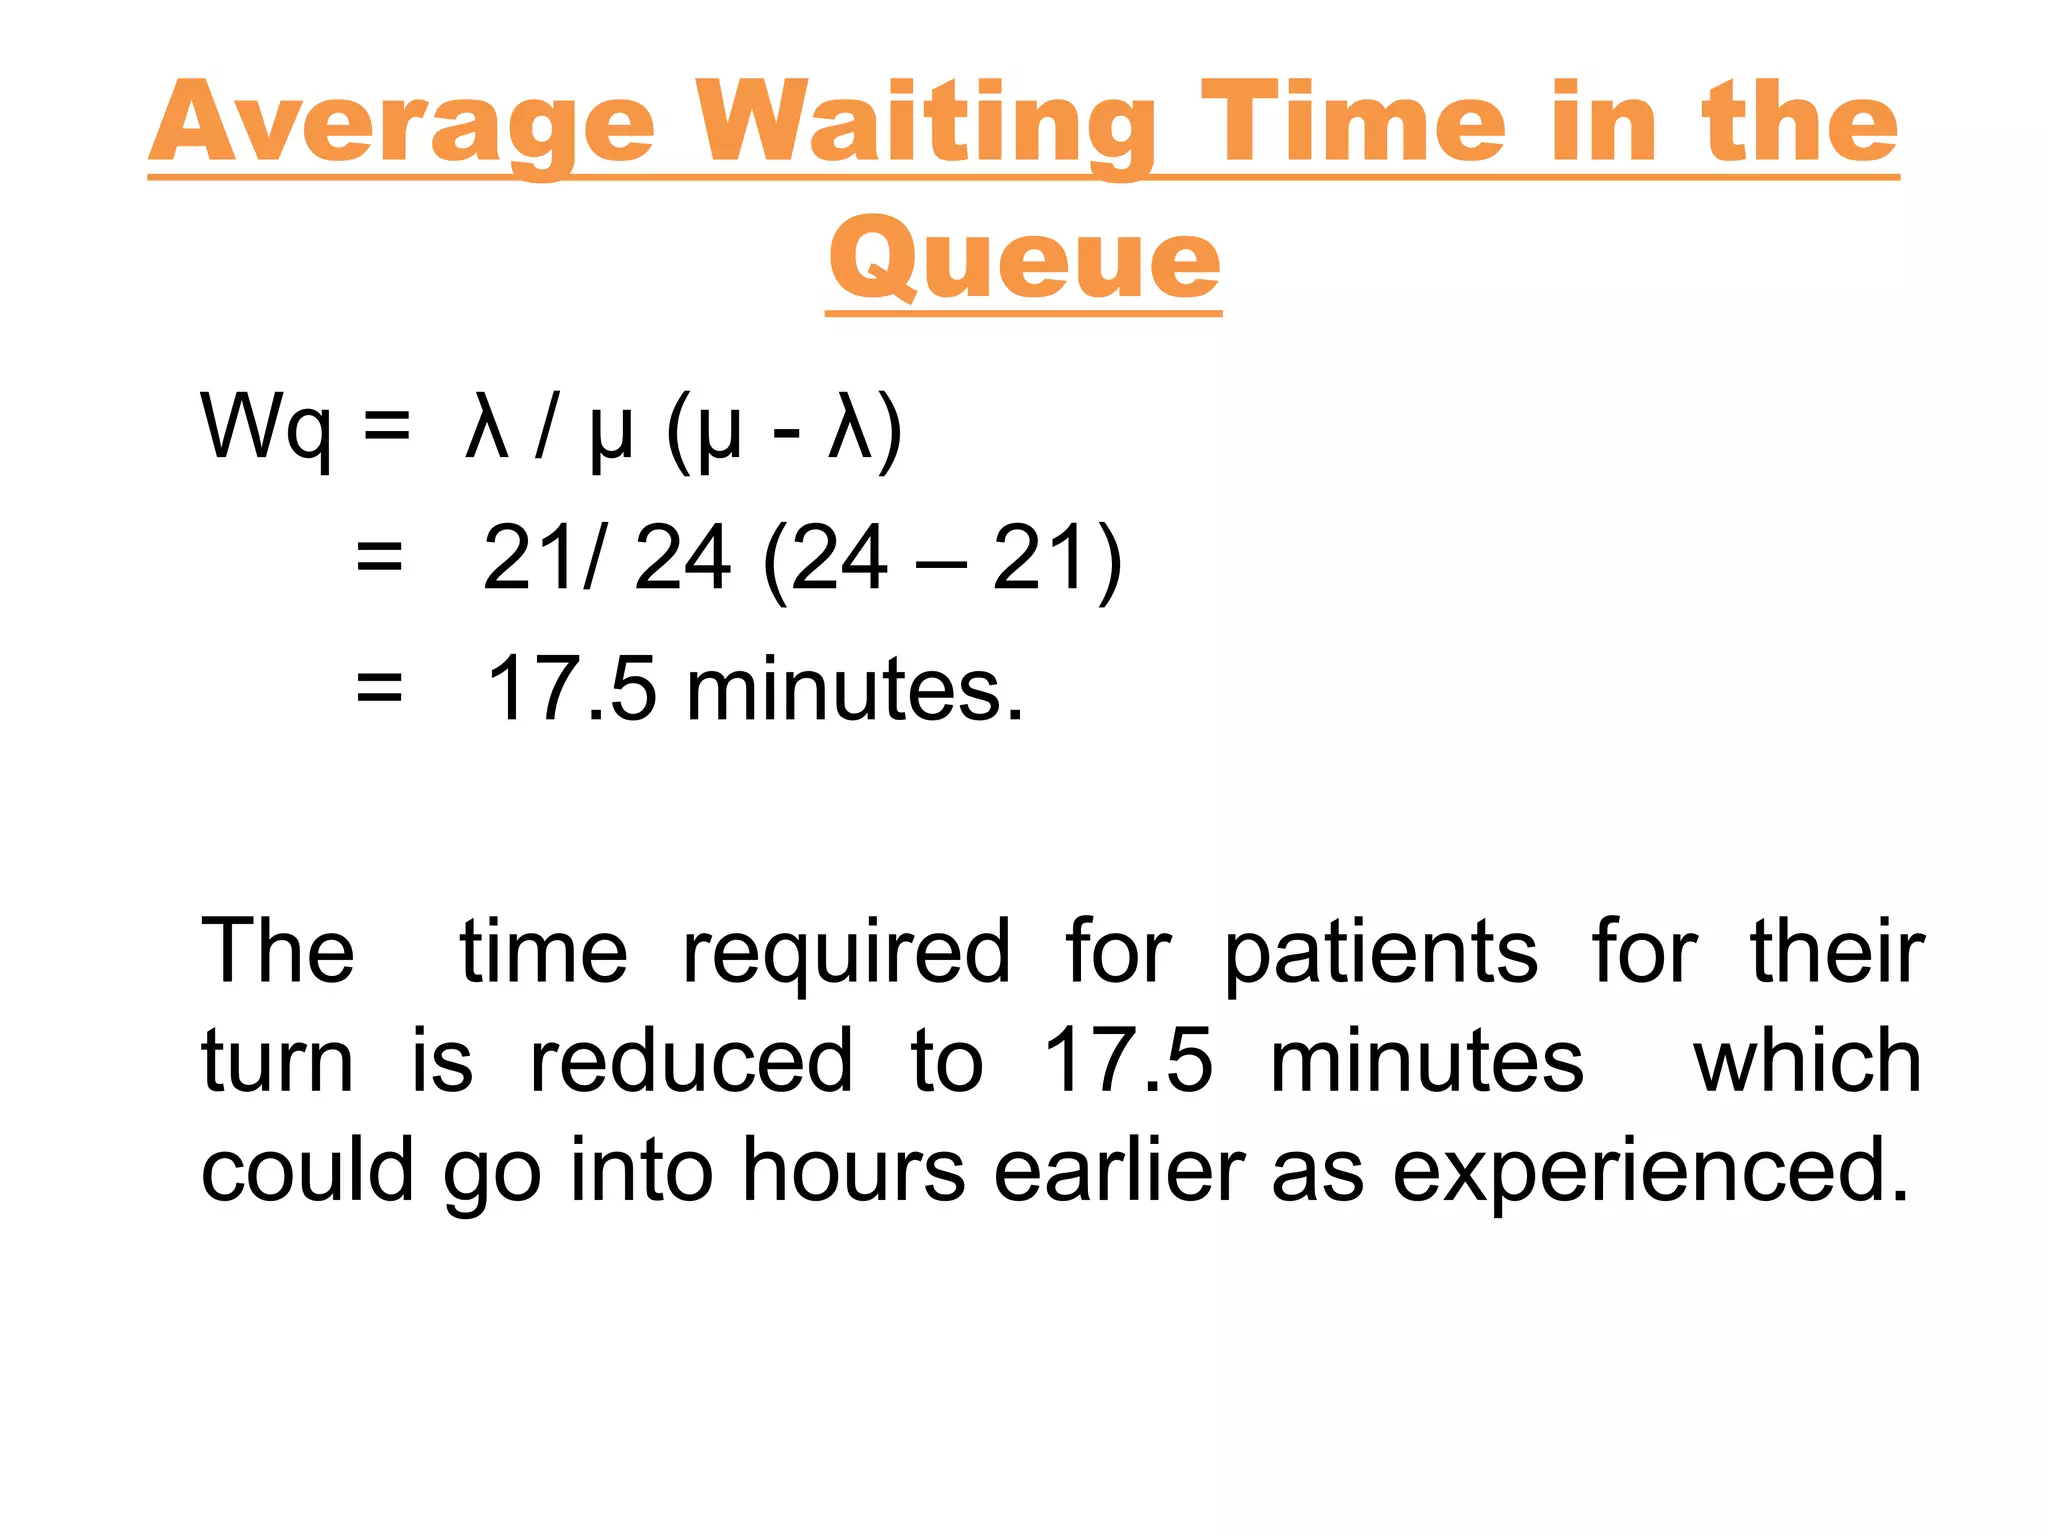
The document discusses queuing theory and its application at Rao Dental Clinic. Queuing theory deals with analyzing systems where customers arrive for service and may need to wait in a queue. Observations were made of arrival and service times at the dental clinic. With one server, the utilization rate was too high, leading to long wait times. Adding more servers would reduce wait times by lowering the utilization rate. The document provides calculations to determine expected numbers of customers in the system and queue, as well as average wait times, under different service rates.
MCM,MCA,MSc, MMM, MPhil, PhD (Computer Applications)
Working as Associate Professor at Zeal Education Society, Pune for MCA Progrmme.
Having 18 Years teaching experience
MCM,MCA,MSc, MMM, MPhil, PhD (Computer Applications)
Working as Associate Professor at Zeal Education Society, Pune for MCA Progrmme.
Having 18 Years teaching experience
Queueing theory is the mathematical study of waiting lines, or queues. A queueing model is constructed so that queue lengths and waiting time can be predicted
Queuing is the common activity of customers or people to avail the desired service, which could be processed or distributed one at a time. Bank ATMs would avoid losing their customers due to a long wait on the line. The bank initially provides one ATM in every branch. But, one ATM would not serve a purpose when customers withdraw to use ATM and try to use other bank ATM. Thus the service time needs to be improved to maintain the customers. This paper shows that the queuing theory used to solve this problem. We obtain the data from a bank ATM in a city. We then derive the arrival rate, service rate, utilization rate, waiting time in the queue and the average number of customers in the queue based on the data using Little’s theorem and M/M/I queuing model. The arrival rate at a bank ATM on Sunday during banking time is 1 customer per minute (cpm) while the service rate is 1.50 cpm. The average number of customer in the ATM is 2 and the utilization period is 0.70. We conclude the paper by discussing the benefits of performing queuing analysis to a busy ATM.
Queuing theory: What is a Queuing system???
Waiting for service is part of our daily life….
Example:
we wait to eat in restaurants….
We queue up in grocery stores…
Jobs wait to be processed on machine…
Vehicles queue up at traffic signal….
Planes circle in a stack before given permission to land at an airport….
Unfortunately, we can not eliminate waiting time without incurring expenses…
But, we can hope to reduce the queue time to a tolerable levels… so that we can avoid adverse impact….
Why study???? What analytics can be drawn??? Analytics means ---- measures of performance such as
1. Average queue length
2. Average waiting time in the queue
3. Average facility utilization….
This presentation looks into the financial market of China covering instruments traded, participants in three segments viz Money market, Capital market and Derivative Market.
This presentation talks about the Marketing Strategy of Shahrukh Khan's most ambitious project - Ra.One. It was the first movie to change the landscape of movie marketing and took it a notch above.
Ethnobotany and Ethnopharmacology:
Ethnobotany in herbal drug evaluation,
Impact of Ethnobotany in traditional medicine,
New development in herbals,
Bio-prospecting tools for drug discovery,
Role of Ethnopharmacology in drug evaluation,
Reverse Pharmacology.
How to Create Map Views in the Odoo 17 ERPCeline George
The map views are useful for providing a geographical representation of data. They allow users to visualize and analyze the data in a more intuitive manner.
Synthetic Fiber Construction in lab .pptxPavel ( NSTU)
Synthetic fiber production is a fascinating and complex field that blends chemistry, engineering, and environmental science. By understanding these aspects, students can gain a comprehensive view of synthetic fiber production, its impact on society and the environment, and the potential for future innovations. Synthetic fibers play a crucial role in modern society, impacting various aspects of daily life, industry, and the environment. ynthetic fibers are integral to modern life, offering a range of benefits from cost-effectiveness and versatility to innovative applications and performance characteristics. While they pose environmental challenges, ongoing research and development aim to create more sustainable and eco-friendly alternatives. Understanding the importance of synthetic fibers helps in appreciating their role in the economy, industry, and daily life, while also emphasizing the need for sustainable practices and innovation.
Palestine last event orientationfvgnh .pptxRaedMohamed3
An EFL lesson about the current events in Palestine. It is intended to be for intermediate students who wish to increase their listening skills through a short lesson in power point.
Model Attribute Check Company Auto PropertyCeline George
In Odoo, the multi-company feature allows you to manage multiple companies within a single Odoo database instance. Each company can have its own configurations while still sharing common resources such as products, customers, and suppliers.
The Art Pastor's Guide to Sabbath | Steve ThomasonSteve Thomason
What is the purpose of the Sabbath Law in the Torah. It is interesting to compare how the context of the law shifts from Exodus to Deuteronomy. Who gets to rest, and why?
Instructions for Submissions thorugh G- Classroom.pptxJheel Barad
This presentation provides a briefing on how to upload submissions and documents in Google Classroom. It was prepared as part of an orientation for new Sainik School in-service teacher trainees. As a training officer, my goal is to ensure that you are comfortable and proficient with this essential tool for managing assignments and fostering student engagement.
Welcome to TechSoup New Member Orientation and Q&A (May 2024).pdfTechSoup
In this webinar you will learn how your organization can access TechSoup's wide variety of product discount and donation programs. From hardware to software, we'll give you a tour of the tools available to help your nonprofit with productivity, collaboration, financial management, donor tracking, security, and more.
The Indian economy is classified into different sectors to simplify the analysis and understanding of economic activities. For Class 10, it's essential to grasp the sectors of the Indian economy, understand their characteristics, and recognize their importance. This guide will provide detailed notes on the Sectors of the Indian Economy Class 10, using specific long-tail keywords to enhance comprehension.
For more information, visit-www.vavaclasses.com
2. QUEUING THEORY
The study of the phenomena of standing,
waiting and serving is called Queuing Theory.
“Any system in which arrivals place demands
upon a finite capacity resource may be
termed as a queuing system.”- Kleinrock.
The queuing theory, also called the waiting
line theory is applicable to situations where
‘customers’ arrive at some ‘service station(s)’
for some service; wait; and then leave the
system after getting the service.
3. Applications of Queuing
Theory
Passage of customers through a
supermarket checkout,
Transfer of electronic messages,
Banking transactions,
Airport traffic,
Telecommunications,
Sale of theatre tickets.
5. Elements of Queuing System
Arrival Process – Distribution that
determines how the task arrives in the
system.
Queue Structure – Order in which
customers are picked up from waiting line
for service.
Service System – (a) Structure of service
system.
(b) Speed of service.
6. Operating Characteristics of
Queuing System
Queue Length – The average number of
customers in queue waiting to get service.
System Length – The average number of
customers in the system.
Waiting Time in the Queue - The average
time that a customer has to wait in the queue
to get service.
Waiting Time in the System - The average
time a customer spends in the system from
entry to completion of service.
7. OBSERVATIONS
Arrival Rate
i. 2 minutes
ii. 1minute
iii. 2minutes
iv. 4minutes , two customers arrived simultaneously individually
v. 1 minute , two arrived in group
vi. 1 minute
vii. 2 minutes
viii. 5 minutes , two customers arrived
ix. 2 minutes
x. 1 minute
xi. 2 minutes
xii. 12 minutes
xiii. 5 minutes
xiv. 15 minutes
xv. 2 minutes ,arrived two
xvi. 3 minutes
8. Service Rate
• 8min took to serve completely
• 13 min
• 14 min took to serve completely
• 15 min to serve
• 10 min to serve
• After 2 min customer called
• After 3 min called
• After 8 min called
• After 5 min called
• After 20 min
• After 30 min
• After 40 min
• After 1 hour 15 min
9. Around 15 customers were already waiting in the
queue.
At a time 7 customers can be treated. So, it is a case
of MULTIPLE SERVERS.
Customers were patient as it was a dental clinic and
it takes time to serve and treat customers.
But there was one customer who wanted to be
served first, insisting that they just had to ask
something. So, were allowed to meet the doctor.
Customers have to call the receptionist and take the
appointment, they are given a number and even the
approximate timings regarding when they should
come.
This helps to reduce their waiting time and in a way
better manage the customers.
10. Receptionist took the slips .
Service is provided on First Come First Basis
according to the number given to customers when
they took the appointment..
But service in RANDOM ORDER was also possible,
since as and when the dentists were getting free they
were calling the patients which are treated by them .
Thus, everyone had equally likely chance of being
called.
Customers pass their time by watching the television
or playing /working on their mobile phones.
Leaving the place completely is not possible , as it is
a dental clinic. So they cannot or hardly delay their
visit . Thus, ‘BALKING ‘ is not possible.
11. My Experience
It took 1 hour and 15 minutes for my turn
to come.
Although, I was served within 10 minutes.
12. Notations
λ : The arrival rate, which will have
units of arrivals per hour.
µ : The service rate, the variable 1/ µ
will have units of hours per customer,
so µ has units of customer per hour.
P = λ/µ : The traffic intensity (average
utilization) of the queuing system. So 1
– p = idle rate.
13. Queuing Models
(a) Probabilistic Queuing Models
• Poisson, Exponential, Single server infinite
model.
• Poisson, Exponential, Single server finite
model.
• Poisson, Exponential, Multiple server infinite
model.
(b) Deterministic Queuing Models
• Known regular interval arrival of customers.
14. Analysis
On the basis of observations,
Arrival Rate (λ) = 21 customers per hour
Service Rate (µ) = 6 customers per hour
Required,
1) The utilization parameter
2) The probability that the queuing system is idle?
3) What is the expected number of customers in the store?
4) What is the expected number of customers waiting for
shopping?
5) What is the average length of queues that have at least one
customer?
6) How much time should a customer expect to spend in the
queue?
7) What is the expected time a customer would spend in the
store?
8) Assuming that n>0 ( i.e. customers are in the system) what
is the probability that the waiting time (excluding service
time) of a customer in the queue shall be more than 10
minutes.
15. Calculation
At current rate ; λ > µ :
þ = λ / µ
þ = 21 / 6
þ = 3.5
This system is unviable ; Queue will
increase indefinitely.
16. If Server is Supplemented
with 3 Servers
λ = 21
µ = 24
þ = λ / µ
þ = 21 / 24
þ = 0.875
Now, the system becomes viable.
17. Average Number of People
in the System
Ls = þ/ 1 - þ
= 0.875 / 1-0.875
= 7
The number of patients are reduced to 7
in the clinic.
18. Average Number of People
in the Queue
Lq = þ² / 1 - þ
= (0.875) ² / 1- 0.875
= 6.125
= 6
The number of patients waiting for turn
are reduced to in queue.
19. Non Empty Queue
Lq’ = 1 / 1 - þ
= 1 / 1 - 0.875
= 8 minutes.
The system will be empty for 8 minutes in a
day.
20. Average Waiting Time in
Whole System
Ws = 1 / µ - λ
= 1/ 24 – 21
= 20 minutes.
The time required for patients in the clinic
is reduced to 20 minutes which could go
into hours earlier as experienced.
21. Average Waiting Time in the
Queue
Wq = λ / µ (µ - λ)
= 21/ 24 (24 – 21)
= 17.5 minutes.
The time required for patients for their
turn is reduced to 17.5 minutes which
could go into hours earlier as experienced.