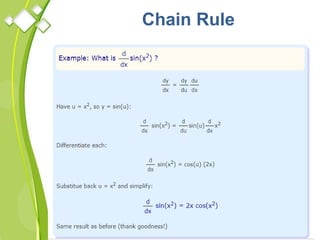
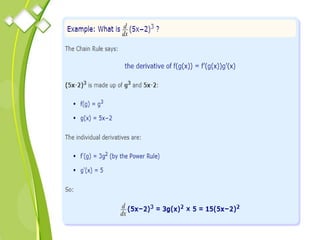
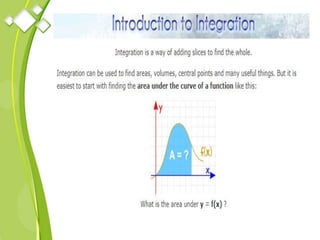
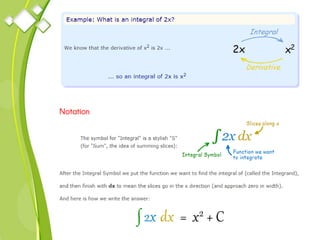
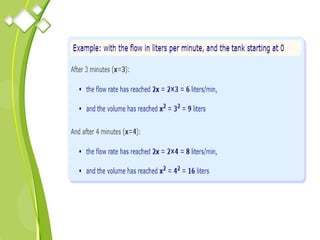
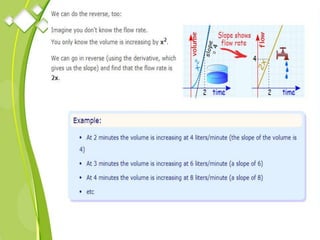
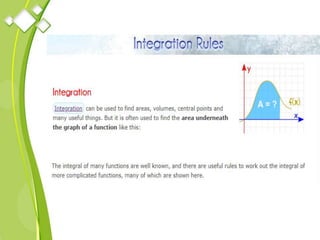
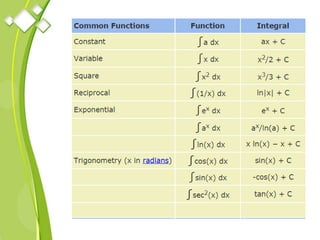
By
Mr. Victorseelan D., MSc.,MPhil(Statistics)
Dept of Mathematics
Nehru College of Management
Coimbatore
Quantitative Methods For Management
Quantitative Methods For
Management
SYLLABUS
UNIT I
Linear, Non-Linear functions – graphical representation of functions, Constants,
Variables – notion of Mathematical models – concept of trade off – notion of
constants – concept of Interest. Basic Concept of differentiation – integration –
Optimization concepts – use of differentiation for optimization of business problem-
Optimization.
UNIT II
Data Analysis – Uni-Variate – ungrouped and grouped data measures of central
Tendencies, measures of dispersion – C V percentages (problem related to business
applications). Bivariate – correlation and regression – problems related to business
applications.
UNIT III
Probability – definitions – addition and multiplication Rules (only statements) –
simple business application problems – probability distribution – expected value
concept – theoretical probability distributions – Binomial, Poison and Normal –
Simple problems applied to business
Quantitative Methods For
Management
SYLLABUS
UNIT IV
Basic concept of index numbers – simple and weighted index numbers – concept of
weights - types of index numbers – Business index number – CPT, WPI, Sensex, Niffy,
Production Index, Time series – variations in Time Series for business forecasting.
UNIT V
Hypothesis testing of Proportion and Mean – single and two tailed tests – errors in
Hypothesis Testing – Measuring the power of Hypothesis test. Chi-Square Tests
References :
1. Statistics for Management – Richard L Levin & Daid S Rubin
2. Statistical Methods – S P Gupta
3. Statistics for Business and Economics – R P Hoods – MacMillan India Limited
4. David M.Levine, Timothy C.Krehbiel and Mark L.Berenson “Business Statistics: A
First Course” , Pearson Education Asia
5. Amir D. Aczel, Complete Business Statistics, 5th edition, Irwin McGraw-Hill.
Questions : 80% of the questions shall be problems 20% of the questions shall be
theory based.
UNIT – 1 Review
Linear, Non-Linear functions:
 Graphical representation of functions, Constants, Variables –
 Notion of Mathematical models –
Concept of trade off – notion of constants –
concept of Interest.
Basic Concept of differentiation – integration –
Optimization concepts – use of differentiation for optimization of business problem-
Optimization.
Constants and Variables
Constants and Variables are the two types of symbols in algebra.
Constant:
A symbol which has a fixed numerical value is called a
constant.
For example:
2, 5, 0, -3, -7, 2/7, 7/9 etc., are constants.
Number of days in a week represents a constant.
In the expression 5x + 7, the constant term is 7.
Constants and Variables
Variables:
A quantity which has no fixed value but takes no
various numerical values is called a variable.
For example:
Temperature at different times of a day represents a
variable.
The height of a student in your grade is a variable, as
it varies from student to student. A variable is
denoted by a letter like x, y, z, u, v etc.
Examples
Examples on Constants and Variables:
(i) In 2a, 2 is a constant and a is a variable.
(ii) In -7mn, -7 is a constant and m and n are variables.
(iii) In 3x, 3 is constant and x is variable but together
3x is a variable.
(iv) If 3 is a constant and x is a variable,
then 3 + x, 3 - x, 3/x, 3x, x/3, etc.,
are also variables.
So, we conclude that the combination of a constant
and a variable is always a variable.
Trade-off functions
Trade-off functions express how much of one objective has
to be sacrificed to increase the value of another objective
by one unit.
Functions
Linear Functions
An equation whose graph is a straight line is
called a linear function. A linear function has an
equation that can be written in the form of
Nonlinear Functions -Quadratic function
Equations whose graphs are not straight lines are
called nonlinear functions. Some nonlinear
functions have specific names.
A quadratic function is nonlinear and has an
equation in the form of
Nonlinear Functions - Cubic function
Another nonlinear function is a cubic function. A
cubic function has an equation in the form of
Mathematical Models
Concepts of Simple
and Compound
Interest
Simple Interest - Example
Compound Interest - Example
Basic Concept of
Differentiation and
Integration
Chain Rule
INTEGRATION
Previous Year Questions (Theory)
Distinguish between Constant and Variable of a Mathematical Model with a suitable
Example?
Define Linear and Non Linear functions with Example
Differentiate Integration and Differentiation?

Quantitative Methods for Management_MBA_Bharathiar University

  • 1.
    By Mr. Victorseelan D.,MSc.,MPhil(Statistics) Dept of Mathematics Nehru College of Management Coimbatore Quantitative Methods For Management
  • 2.
    Quantitative Methods For Management SYLLABUS UNITI Linear, Non-Linear functions – graphical representation of functions, Constants, Variables – notion of Mathematical models – concept of trade off – notion of constants – concept of Interest. Basic Concept of differentiation – integration – Optimization concepts – use of differentiation for optimization of business problem- Optimization. UNIT II Data Analysis – Uni-Variate – ungrouped and grouped data measures of central Tendencies, measures of dispersion – C V percentages (problem related to business applications). Bivariate – correlation and regression – problems related to business applications. UNIT III Probability – definitions – addition and multiplication Rules (only statements) – simple business application problems – probability distribution – expected value concept – theoretical probability distributions – Binomial, Poison and Normal – Simple problems applied to business
  • 3.
    Quantitative Methods For Management SYLLABUS UNITIV Basic concept of index numbers – simple and weighted index numbers – concept of weights - types of index numbers – Business index number – CPT, WPI, Sensex, Niffy, Production Index, Time series – variations in Time Series for business forecasting. UNIT V Hypothesis testing of Proportion and Mean – single and two tailed tests – errors in Hypothesis Testing – Measuring the power of Hypothesis test. Chi-Square Tests References : 1. Statistics for Management – Richard L Levin & Daid S Rubin 2. Statistical Methods – S P Gupta 3. Statistics for Business and Economics – R P Hoods – MacMillan India Limited 4. David M.Levine, Timothy C.Krehbiel and Mark L.Berenson “Business Statistics: A First Course” , Pearson Education Asia 5. Amir D. Aczel, Complete Business Statistics, 5th edition, Irwin McGraw-Hill. Questions : 80% of the questions shall be problems 20% of the questions shall be theory based.
  • 4.
    UNIT – 1Review Linear, Non-Linear functions:  Graphical representation of functions, Constants, Variables –  Notion of Mathematical models – Concept of trade off – notion of constants – concept of Interest. Basic Concept of differentiation – integration – Optimization concepts – use of differentiation for optimization of business problem- Optimization.
  • 5.
    Constants and Variables Constantsand Variables are the two types of symbols in algebra. Constant: A symbol which has a fixed numerical value is called a constant. For example: 2, 5, 0, -3, -7, 2/7, 7/9 etc., are constants. Number of days in a week represents a constant. In the expression 5x + 7, the constant term is 7.
  • 6.
    Constants and Variables Variables: Aquantity which has no fixed value but takes no various numerical values is called a variable. For example: Temperature at different times of a day represents a variable. The height of a student in your grade is a variable, as it varies from student to student. A variable is denoted by a letter like x, y, z, u, v etc.
  • 7.
    Examples Examples on Constantsand Variables: (i) In 2a, 2 is a constant and a is a variable. (ii) In -7mn, -7 is a constant and m and n are variables. (iii) In 3x, 3 is constant and x is variable but together 3x is a variable. (iv) If 3 is a constant and x is a variable, then 3 + x, 3 - x, 3/x, 3x, x/3, etc., are also variables. So, we conclude that the combination of a constant and a variable is always a variable.
  • 8.
    Trade-off functions Trade-off functionsexpress how much of one objective has to be sacrificed to increase the value of another objective by one unit.
  • 9.
  • 16.
    Linear Functions An equationwhose graph is a straight line is called a linear function. A linear function has an equation that can be written in the form of
  • 17.
    Nonlinear Functions -Quadraticfunction Equations whose graphs are not straight lines are called nonlinear functions. Some nonlinear functions have specific names. A quadratic function is nonlinear and has an equation in the form of
  • 18.
    Nonlinear Functions -Cubic function Another nonlinear function is a cubic function. A cubic function has an equation in the form of
  • 21.
  • 35.
    Concepts of Simple andCompound Interest
  • 47.
  • 48.
  • 49.
  • 68.
  • 70.
  • 86.
    Previous Year Questions(Theory) Distinguish between Constant and Variable of a Mathematical Model with a suitable Example? Define Linear and Non Linear functions with Example Differentiate Integration and Differentiation?