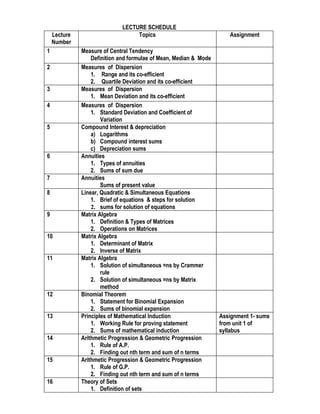
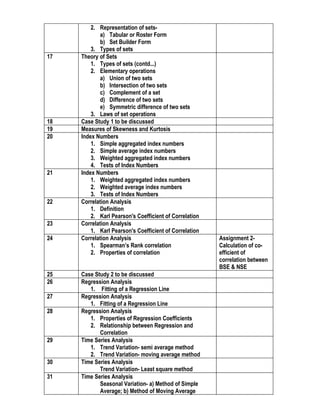
PUNJAB COLLEGE OF TECHNICAL EDUCATION, LUDHIANA
                                       COURSE PLAN
Course: QUANTITATIVE TECHNIQUES (MB-104)
Instructor: Navin Chandra

Course Objectives: The course of ‘quantitative techniques’ is structured in such a way
so that the student pursuing MBA should have knowledge of various types of data,
techniques of analysis of data, hypothesis setting and decision making from test of
hypothesis. After going through the subject, students will be able to how to use-
    a) Mathematical Tools like Annuities, Depreciation, Compound Interest techniques;
    b) Statistical Tools of Averages, Dispersion, Correlation, Regression, Time Series and
       Index Numbers;
    c) Probability, Probability Distributions and Test of Hypothesis in the business
       environment.
                                SYLLABUS
Unit I (MATHEMATICS)
   1. Role of Mathematics and statistics in Business Decisions
   2. Theory of Sets
   3. Compound interest, depreciation and annuities
   4. Linear, Quadratic & Simultaneous Equations
   5. Matrix Algebra
   6. Binomial Theorem
   7. Principles of Mathematical Induction
   8. Arithmetic Progression & Geometric Progression

Unit II (MEASURES OF AVERAGES, DISPERSIONS & INDEX NUMBERS)
    1. Measure of Central Tendency
    2. Measures of Dispersion: Range, Quartile Deviation, Mean Deviation, Standard
          Deviation and Coefficient of Variation, Skewness and Kurtosis
    3. Index Numbers: Simple, Aggregated, Weighted and Tests of Index Numbers

Unit III (CORRELATION, REGRESSION AND TIME SERIES ANALYSIS)
    1. Correlation Analysis: Rank Method & Karl Pearson's Coefficient of Correlation and
          Properties of Correlation.
    2. Regression Analysis: Fitting of a Regression Line, Interpretation of Results,
          Properties of Regression Coefficients, Relationship between Regression and
          Correlation
    3. Time Series Analysis: Trend Variation, Least Square Fit, Seasonal Variation

Unit IV (PROBABILITY, HYPOTHESIS TESTING)
    1. Theory of Probability, Addition and Multiplication Law, Bayes’ Theorem
    2. Theoretical Distributions: Binomial, Poisson and Normal Distribution
    3. Sampling Distribution, Standard Error
    4. Theory of Estimation, Point Estimation, Interval Estimation
    5. Testing of Hypothesis: Large Sample Tests, Small Sample test, (t, F, Z Test and Chi
         Square Test).
Recommended Text Books:
S.No Author             Title                                               Publisher
1    SANCHETI &         BUSINSESS MATHEMATICS                               SULTAN CHAND
     KAPOOR                                                                 & SONS
2    S.P. GUPTA         STATISTICAL METHODS                                 SULTAN CHAND
                                                                            & SONS
3      LEVIN & RUBIN        STATISTICS FOR MANAGEMENT                       PRENTICE HALL
                                                                            INDIA

Recommended Reference Books:
S.No Author              Title                                              Publisher
1    Dr. S. C.           BASIC MATHEMATICS FOR MBA                          V K (INDIA)
     AGGARWAL                                                               ENTERPRISES
2    ANDERSON,           STATISTICS FOR BUSINESS AND                        CENGAGE
     SWEENEY &           ECONOMICS                                          LEARNING
     WILLIAMS
3    T. R. JAIN & Dr. S. STATISTICS FOR MBA                                 V K (INDIA)
     C. AGGARWAL                                                            ENTERPRISES

Case studies & their objectives:
Case 1: INDIAN CRICKETERS – EARNINGS CONSIDERING RUNS & WICKETS
The objective of this case study is to use statistical tools of Measures of- ‘Central Tendency’
and ‘Dispersion’ in practical situation.

Case 2: RELIANCE INDUSTRIES LTD- BETA COEFFICIENT
The objective of this case study is to find out BETA co-efficient of a Company using
statistical tools of ‘Covariance’ and ‘Variance’.

Assignments:
Assignment 1: Sums from Unit 1 of the syllabus based on actual business situation.

Assignment 2: Calculation of co-efficient of correlation between SENSEX (BSE) and NIFTY
(NSE) for-
    a) Closing indices from 1st July,2010 to 15th July,2010
    b) Market Capitalisation from 1st July,2010 to 15th July,2010
    c) Daily rate of Return
The Objective of these assignments is that the students should adapt themselves how the
calculations and analyses are made in real life situations.

Evaluation: Students will be evaluated on the basis of following criteria

MSE’s: 15 marks
Presentation: 7 marks
TESTS (two): 10 marks (Every test will have equal weightage of 5 marks)
Assignments (two): 8 marks (Each assignment will carry 4 marks)
LECTURE SCHEDULE
    Lecture                       Topics                              Assignment
    Number
1             Measure of Central Tendency
                  Definition and formulae of Mean, Median & Mode
2             Measures of Dispersion
                  1. Range and its co-efficient
                  2. Quartile Deviation and its co-efficient
3             Measures of Dispersion
                  1. Mean Deviation and its co-efficient
4             Measures of Dispersion
                  1. Standard Deviation and Coefficient of
                      Variation
5             Compound Interest & depreciation
                  a) Logarithms
                  b) Compound interest sums
                  c) Depreciation sums
6             Annuities
                  1. Types of annuities
                  2. Sums of sum due
7             Annuities
                      Sums of present value
8             Linear, Quadratic & Simultaneous Equations
                  1. Brief of equations & steps for solution
                  2. sums for solution of equations
9             Matrix Algebra
                  1. Definition & Types of Matrices
                  2. Operations on Matrices
10            Matrix Algebra
                  1. Determinant of Matrix
                  2. Inverse of Matrix
11            Matrix Algebra
                  1. Solution of simultaneous =ns by Crammer
                      rule
                  2. Solution of simultaneous =ns by Matrix
                      method
12            Binomial Theorem
                  1. Statement for Binomial Expansion
                  2. Sums of binomial expansion
13            Principles of Mathematical Induction                 Assignment 1- sums
                  1. Working Rule for proving statement            from unit 1 of
                  2. Sums of mathematical induction                syllabus
14            Arithmetic Progression & Geometric Progression
                  1. Rule of A.P.
                  2. Finding out nth term and sum of n terms
15            Arithmetic Progression & Geometric Progression
                  1. Rule of G.P.
                  2. Finding out nth term and sum of n terms
16            Theory of Sets
                  1. Definition of sets
2. Representation of sets-
            a) Tabular or Roster Form
            b) Set Builder Form
         3. Types of sets
17   Theory of Sets
         1. Types of sets (contd...)
         2. Elementary operations
            a) Union of two sets
            b) Intersection of two sets
            c) Complement of a set
            d) Difference of two sets
            e) Symmetric difference of two sets
         3. Laws of set operations
18   Case Study 1 to be discussed
19   Measures of Skewness and Kurtosis
20   Index Numbers
         1. Simple aggregated index numbers
         2. Simple average index numbers
         3. Weighted aggregated index numbers
         4. Tests of Index Numbers
21   Index Numbers
         1. Weighted aggregated index numbers
         2. Weighted average index numbers
         3. Tests of Index Numbers
22   Correlation Analysis
         1. Definition
         2. Karl Pearson's Coefficient of Correlation
23   Correlation Analysis
         1. Karl Pearson's Coefficient of Correlation
24   Correlation Analysis                               Assignment 2-
         1. Spearman’s Rank correlation                 Calculation of co-
         2. Properties of correlation                   efficient of
                                                        correlation between
                                                        BSE & NSE
25   Case Study 2 to be discussed
26   Regression Analysis
        1. Fitting of a Regression Line
27   Regression Analysis
        1. Fitting of a Regression Line
28   Regression Analysis
        1. Properties of Regression Coefficients
        2. Relationship between Regression and
            Correlation
29   Time Series Analysis
        1. Trend Variation- semi average method
        2. Trend Variation- moving average method
30   Time Series Analysis
            Trend Variation- Least square method
31   Time Series Analysis
            Seasonal Variation- a) Method of Simple
            Average; b) Method of Moving Average
c) Ratio to Moving Average
32    Time Series Analysis
             Seasonal Variation- Ratio to Trend Method
33    Time Series Analysis
             Seasonal Variation- Link Relatives Method
34    Theory of Probability
         1. Definition
         2. Addition and Multiplication Law
         3. Sums of probability
35    Theory of Probability
         1. Sums of probability
36    Theory of Probability
         1. Bayes’ Theorem
37    Theoretical Distributions
         1. Binomial Distribution
         2. Sums of Binomial Distribution
38    Theoretical Distributions
         1. Poisson Distribution
         2. Sums of Poisson Distribution
39    Theoretical Distributions
         1. Normal Distribution
         2. Sums of Normal Distribution
40    Sampling Distribution & Standard Error
41    Theory of Estimation
         1. Point Estimation
         2. Interval Estimation
42    Testing of Hypothesis
              Large Sample Tests- Z test
43    Testing of Hypothesis
              Large Sample Tests- Z test
44    Testing of Hypothesis
             Small Sample Tests- t test
45    Testing of Hypothesis
             Small Sample Tests- t test
46    Testing of Hypothesis
             Chi Square Test
47    Testing of Hypothesis
             F test & ANOVA Table
48    Testing of Hypothesis
              ANOVA Table


                           CASE STUDY-1
     INDIAN CRICKETERS – EARNINGS CONSIDERING RUNS & WICKETS
A report, published in newspaper The Times of India on 12 th November, 2006, showed the
following data of earnings, runs scored and wickets taken by some of international cricketers in the
year in one day matches in 2005-06:
S.       Name of Cricketer Earnings        Runs           Earning per Wickets          Earnings
No.                           (Rs. In Lac) Scored         run (Rs)      Taken          per wicket
                                                                                       (Rs)
         BATSMEN
1        Rahul Dravid          138.50      2,371             5,841        0                      0
2        Sachin Tendulkar 102.90           1,063             9,680        3            34,30,000
3        Virender Sehwag 133.70            1,793             7,457       19             7,03,684
4        V. V. S. Laxman        77.50        589           13,158         0                      0
5        Sourav Ganguly         60.00        155           38,710         1            60,00,000
6        Yuvraj Singh          112.10      1,619             6,924        8            14,01,250
7        Mohd. Kaif             88.40        708            12,486        0                      0
8        Gautam Gambhir         45.10        350            12,886        0                      0
9        Suresh Raina           43.20        516            8,372         0                      0
10       Wasim Jaffer           17.50        622            2,814         0                      0
         BOWLERS
11       Anil Kumble            82.50        355            23,239       68             1,21,324
12       Harbhajan Singh        91.88        357            25,737       66             1,39,212
13       Irfan Pathan          119.80        986            12,150       71             1,68,732
14       Ajit Agarkar           91.40        188            48,617       46             1,98,696
15       Zaheer Khan            31.40          56           56,071       13             2,41,539
16       Munaf Patel            51.00          38         1,34,211       33             1,54,545
17       Sreesanth              62.90          78           80,641       45             1,39,778
         WICKETKEEPER
18       M. S. Dhoni           120.30      1,587             7,580        0                      0

  Mahesh wants to analyse the above data to evaluate the performance of these players. He has
thought of using the measures of location (central tendency) and measures of dispersion for this
analysis. He wants to calculate:
    a) Average Earnings per run scored for the batsmen;
    b) Average Earnings per wicket taken for the bowlers;
    c) Appropriate measure of consistency among the batsmen with respect to earnings per run;
    d) Appropriate measure of consistency among the bowlers with respect to earnings per
        wicket.
You are required to help Mahesh in above analysis and evaluate their performances.

                                          *****


                                   CASE STUDY-2
                      RELIANCE INDUSTRIES LTD- BETA COEFFICIENT
Mr. Jagmohan, Managing Director of J.M. Securities Limited, a stock exchange brokering
company, is interested in investing huge funds in the equity shares of RELIANCE INDUSTRIES
LTD. The equity share of the above company is currently being traded at Rs. 1,208. He wants to
find out whether the share is over-valued or under-valued. For this purpose he has obtained and
analysed various relevant information like risk free rate of return, rate of return on market portfolio
and estimated cash inflows for next ten years. Now he needs to find out Beta Co-efficient of the
Company. For this purpose the following information is provided:

                    Date            BSE Sensex           Market Price of RIL
                     5.10.2006      12389                1155
                     6.10.2006      12373                1163
                     9.10.2006      12366                1154
                    10.10.2006      12364                1151
                    11.10.2006      12353                1143
                    12.10.2006      12538                1170
                    13.10.2006      12736                1190
                    16.10.2006      12928                1213
                    17.10.2006      12884                1216
                    18.10.2006      12858                1208

You are required to help out Mr. Jagmohan in finding out β of Reliance Industries Limited. The
following formulae may be of your help:


    1. Daily Rate of Return=                                  *100


    2. β =


                                          *****

Course plan quantitative_techniques_mb_104

  • 1.
    PUNJAB COLLEGE OFTECHNICAL EDUCATION, LUDHIANA COURSE PLAN Course: QUANTITATIVE TECHNIQUES (MB-104) Instructor: Navin Chandra Course Objectives: The course of ‘quantitative techniques’ is structured in such a way so that the student pursuing MBA should have knowledge of various types of data, techniques of analysis of data, hypothesis setting and decision making from test of hypothesis. After going through the subject, students will be able to how to use- a) Mathematical Tools like Annuities, Depreciation, Compound Interest techniques; b) Statistical Tools of Averages, Dispersion, Correlation, Regression, Time Series and Index Numbers; c) Probability, Probability Distributions and Test of Hypothesis in the business environment. SYLLABUS Unit I (MATHEMATICS) 1. Role of Mathematics and statistics in Business Decisions 2. Theory of Sets 3. Compound interest, depreciation and annuities 4. Linear, Quadratic & Simultaneous Equations 5. Matrix Algebra 6. Binomial Theorem 7. Principles of Mathematical Induction 8. Arithmetic Progression & Geometric Progression Unit II (MEASURES OF AVERAGES, DISPERSIONS & INDEX NUMBERS) 1. Measure of Central Tendency 2. Measures of Dispersion: Range, Quartile Deviation, Mean Deviation, Standard Deviation and Coefficient of Variation, Skewness and Kurtosis 3. Index Numbers: Simple, Aggregated, Weighted and Tests of Index Numbers Unit III (CORRELATION, REGRESSION AND TIME SERIES ANALYSIS) 1. Correlation Analysis: Rank Method & Karl Pearson's Coefficient of Correlation and Properties of Correlation. 2. Regression Analysis: Fitting of a Regression Line, Interpretation of Results, Properties of Regression Coefficients, Relationship between Regression and Correlation 3. Time Series Analysis: Trend Variation, Least Square Fit, Seasonal Variation Unit IV (PROBABILITY, HYPOTHESIS TESTING) 1. Theory of Probability, Addition and Multiplication Law, Bayes’ Theorem 2. Theoretical Distributions: Binomial, Poisson and Normal Distribution 3. Sampling Distribution, Standard Error 4. Theory of Estimation, Point Estimation, Interval Estimation 5. Testing of Hypothesis: Large Sample Tests, Small Sample test, (t, F, Z Test and Chi Square Test).
  • 2.
    Recommended Text Books: S.NoAuthor Title Publisher 1 SANCHETI & BUSINSESS MATHEMATICS SULTAN CHAND KAPOOR & SONS 2 S.P. GUPTA STATISTICAL METHODS SULTAN CHAND & SONS 3 LEVIN & RUBIN STATISTICS FOR MANAGEMENT PRENTICE HALL INDIA Recommended Reference Books: S.No Author Title Publisher 1 Dr. S. C. BASIC MATHEMATICS FOR MBA V K (INDIA) AGGARWAL ENTERPRISES 2 ANDERSON, STATISTICS FOR BUSINESS AND CENGAGE SWEENEY & ECONOMICS LEARNING WILLIAMS 3 T. R. JAIN & Dr. S. STATISTICS FOR MBA V K (INDIA) C. AGGARWAL ENTERPRISES Case studies & their objectives: Case 1: INDIAN CRICKETERS – EARNINGS CONSIDERING RUNS & WICKETS The objective of this case study is to use statistical tools of Measures of- ‘Central Tendency’ and ‘Dispersion’ in practical situation. Case 2: RELIANCE INDUSTRIES LTD- BETA COEFFICIENT The objective of this case study is to find out BETA co-efficient of a Company using statistical tools of ‘Covariance’ and ‘Variance’. Assignments: Assignment 1: Sums from Unit 1 of the syllabus based on actual business situation. Assignment 2: Calculation of co-efficient of correlation between SENSEX (BSE) and NIFTY (NSE) for- a) Closing indices from 1st July,2010 to 15th July,2010 b) Market Capitalisation from 1st July,2010 to 15th July,2010 c) Daily rate of Return The Objective of these assignments is that the students should adapt themselves how the calculations and analyses are made in real life situations. Evaluation: Students will be evaluated on the basis of following criteria MSE’s: 15 marks Presentation: 7 marks TESTS (two): 10 marks (Every test will have equal weightage of 5 marks) Assignments (two): 8 marks (Each assignment will carry 4 marks)
  • 3.
    LECTURE SCHEDULE Lecture Topics Assignment Number 1 Measure of Central Tendency Definition and formulae of Mean, Median & Mode 2 Measures of Dispersion 1. Range and its co-efficient 2. Quartile Deviation and its co-efficient 3 Measures of Dispersion 1. Mean Deviation and its co-efficient 4 Measures of Dispersion 1. Standard Deviation and Coefficient of Variation 5 Compound Interest & depreciation a) Logarithms b) Compound interest sums c) Depreciation sums 6 Annuities 1. Types of annuities 2. Sums of sum due 7 Annuities Sums of present value 8 Linear, Quadratic & Simultaneous Equations 1. Brief of equations & steps for solution 2. sums for solution of equations 9 Matrix Algebra 1. Definition & Types of Matrices 2. Operations on Matrices 10 Matrix Algebra 1. Determinant of Matrix 2. Inverse of Matrix 11 Matrix Algebra 1. Solution of simultaneous =ns by Crammer rule 2. Solution of simultaneous =ns by Matrix method 12 Binomial Theorem 1. Statement for Binomial Expansion 2. Sums of binomial expansion 13 Principles of Mathematical Induction Assignment 1- sums 1. Working Rule for proving statement from unit 1 of 2. Sums of mathematical induction syllabus 14 Arithmetic Progression & Geometric Progression 1. Rule of A.P. 2. Finding out nth term and sum of n terms 15 Arithmetic Progression & Geometric Progression 1. Rule of G.P. 2. Finding out nth term and sum of n terms 16 Theory of Sets 1. Definition of sets
  • 4.
    2. Representation ofsets- a) Tabular or Roster Form b) Set Builder Form 3. Types of sets 17 Theory of Sets 1. Types of sets (contd...) 2. Elementary operations a) Union of two sets b) Intersection of two sets c) Complement of a set d) Difference of two sets e) Symmetric difference of two sets 3. Laws of set operations 18 Case Study 1 to be discussed 19 Measures of Skewness and Kurtosis 20 Index Numbers 1. Simple aggregated index numbers 2. Simple average index numbers 3. Weighted aggregated index numbers 4. Tests of Index Numbers 21 Index Numbers 1. Weighted aggregated index numbers 2. Weighted average index numbers 3. Tests of Index Numbers 22 Correlation Analysis 1. Definition 2. Karl Pearson's Coefficient of Correlation 23 Correlation Analysis 1. Karl Pearson's Coefficient of Correlation 24 Correlation Analysis Assignment 2- 1. Spearman’s Rank correlation Calculation of co- 2. Properties of correlation efficient of correlation between BSE & NSE 25 Case Study 2 to be discussed 26 Regression Analysis 1. Fitting of a Regression Line 27 Regression Analysis 1. Fitting of a Regression Line 28 Regression Analysis 1. Properties of Regression Coefficients 2. Relationship between Regression and Correlation 29 Time Series Analysis 1. Trend Variation- semi average method 2. Trend Variation- moving average method 30 Time Series Analysis Trend Variation- Least square method 31 Time Series Analysis Seasonal Variation- a) Method of Simple Average; b) Method of Moving Average
  • 5.
    c) Ratio toMoving Average 32 Time Series Analysis Seasonal Variation- Ratio to Trend Method 33 Time Series Analysis Seasonal Variation- Link Relatives Method 34 Theory of Probability 1. Definition 2. Addition and Multiplication Law 3. Sums of probability 35 Theory of Probability 1. Sums of probability 36 Theory of Probability 1. Bayes’ Theorem 37 Theoretical Distributions 1. Binomial Distribution 2. Sums of Binomial Distribution 38 Theoretical Distributions 1. Poisson Distribution 2. Sums of Poisson Distribution 39 Theoretical Distributions 1. Normal Distribution 2. Sums of Normal Distribution 40 Sampling Distribution & Standard Error 41 Theory of Estimation 1. Point Estimation 2. Interval Estimation 42 Testing of Hypothesis Large Sample Tests- Z test 43 Testing of Hypothesis Large Sample Tests- Z test 44 Testing of Hypothesis Small Sample Tests- t test 45 Testing of Hypothesis Small Sample Tests- t test 46 Testing of Hypothesis Chi Square Test 47 Testing of Hypothesis F test & ANOVA Table 48 Testing of Hypothesis ANOVA Table CASE STUDY-1 INDIAN CRICKETERS – EARNINGS CONSIDERING RUNS & WICKETS
  • 6.
    A report, publishedin newspaper The Times of India on 12 th November, 2006, showed the following data of earnings, runs scored and wickets taken by some of international cricketers in the year in one day matches in 2005-06: S. Name of Cricketer Earnings Runs Earning per Wickets Earnings No. (Rs. In Lac) Scored run (Rs) Taken per wicket (Rs) BATSMEN 1 Rahul Dravid 138.50 2,371 5,841 0 0 2 Sachin Tendulkar 102.90 1,063 9,680 3 34,30,000 3 Virender Sehwag 133.70 1,793 7,457 19 7,03,684 4 V. V. S. Laxman 77.50 589 13,158 0 0 5 Sourav Ganguly 60.00 155 38,710 1 60,00,000 6 Yuvraj Singh 112.10 1,619 6,924 8 14,01,250 7 Mohd. Kaif 88.40 708 12,486 0 0 8 Gautam Gambhir 45.10 350 12,886 0 0 9 Suresh Raina 43.20 516 8,372 0 0 10 Wasim Jaffer 17.50 622 2,814 0 0 BOWLERS 11 Anil Kumble 82.50 355 23,239 68 1,21,324 12 Harbhajan Singh 91.88 357 25,737 66 1,39,212 13 Irfan Pathan 119.80 986 12,150 71 1,68,732 14 Ajit Agarkar 91.40 188 48,617 46 1,98,696 15 Zaheer Khan 31.40 56 56,071 13 2,41,539 16 Munaf Patel 51.00 38 1,34,211 33 1,54,545 17 Sreesanth 62.90 78 80,641 45 1,39,778 WICKETKEEPER 18 M. S. Dhoni 120.30 1,587 7,580 0 0 Mahesh wants to analyse the above data to evaluate the performance of these players. He has thought of using the measures of location (central tendency) and measures of dispersion for this analysis. He wants to calculate: a) Average Earnings per run scored for the batsmen; b) Average Earnings per wicket taken for the bowlers; c) Appropriate measure of consistency among the batsmen with respect to earnings per run; d) Appropriate measure of consistency among the bowlers with respect to earnings per wicket. You are required to help Mahesh in above analysis and evaluate their performances. ***** CASE STUDY-2 RELIANCE INDUSTRIES LTD- BETA COEFFICIENT
  • 7.
    Mr. Jagmohan, ManagingDirector of J.M. Securities Limited, a stock exchange brokering company, is interested in investing huge funds in the equity shares of RELIANCE INDUSTRIES LTD. The equity share of the above company is currently being traded at Rs. 1,208. He wants to find out whether the share is over-valued or under-valued. For this purpose he has obtained and analysed various relevant information like risk free rate of return, rate of return on market portfolio and estimated cash inflows for next ten years. Now he needs to find out Beta Co-efficient of the Company. For this purpose the following information is provided: Date BSE Sensex Market Price of RIL 5.10.2006 12389 1155 6.10.2006 12373 1163 9.10.2006 12366 1154 10.10.2006 12364 1151 11.10.2006 12353 1143 12.10.2006 12538 1170 13.10.2006 12736 1190 16.10.2006 12928 1213 17.10.2006 12884 1216 18.10.2006 12858 1208 You are required to help out Mr. Jagmohan in finding out β of Reliance Industries Limited. The following formulae may be of your help: 1. Daily Rate of Return= *100 2. β = *****