Download to read offline


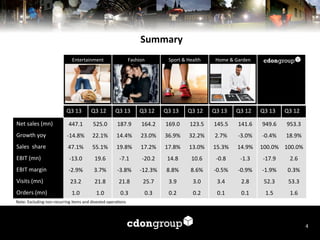
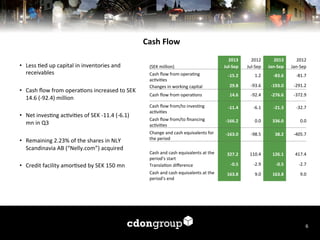
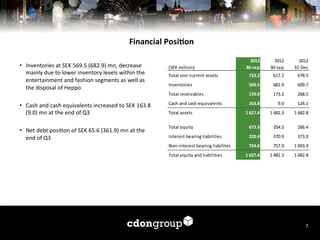


CDON Group reported financial results for the third quarter and first nine months of 2013. Key highlights included growth and margin improvements in three of four business segments, with the Sports & Health segment continuing to deliver solid profitability. While net sales were slightly down year-over-year for the third quarter, excluding currency effects sales saw slight growth. The company saw an increase in cash flow from operations and a reduction in its net debt position compared to the previous year.


