Download as PDF, PPTX


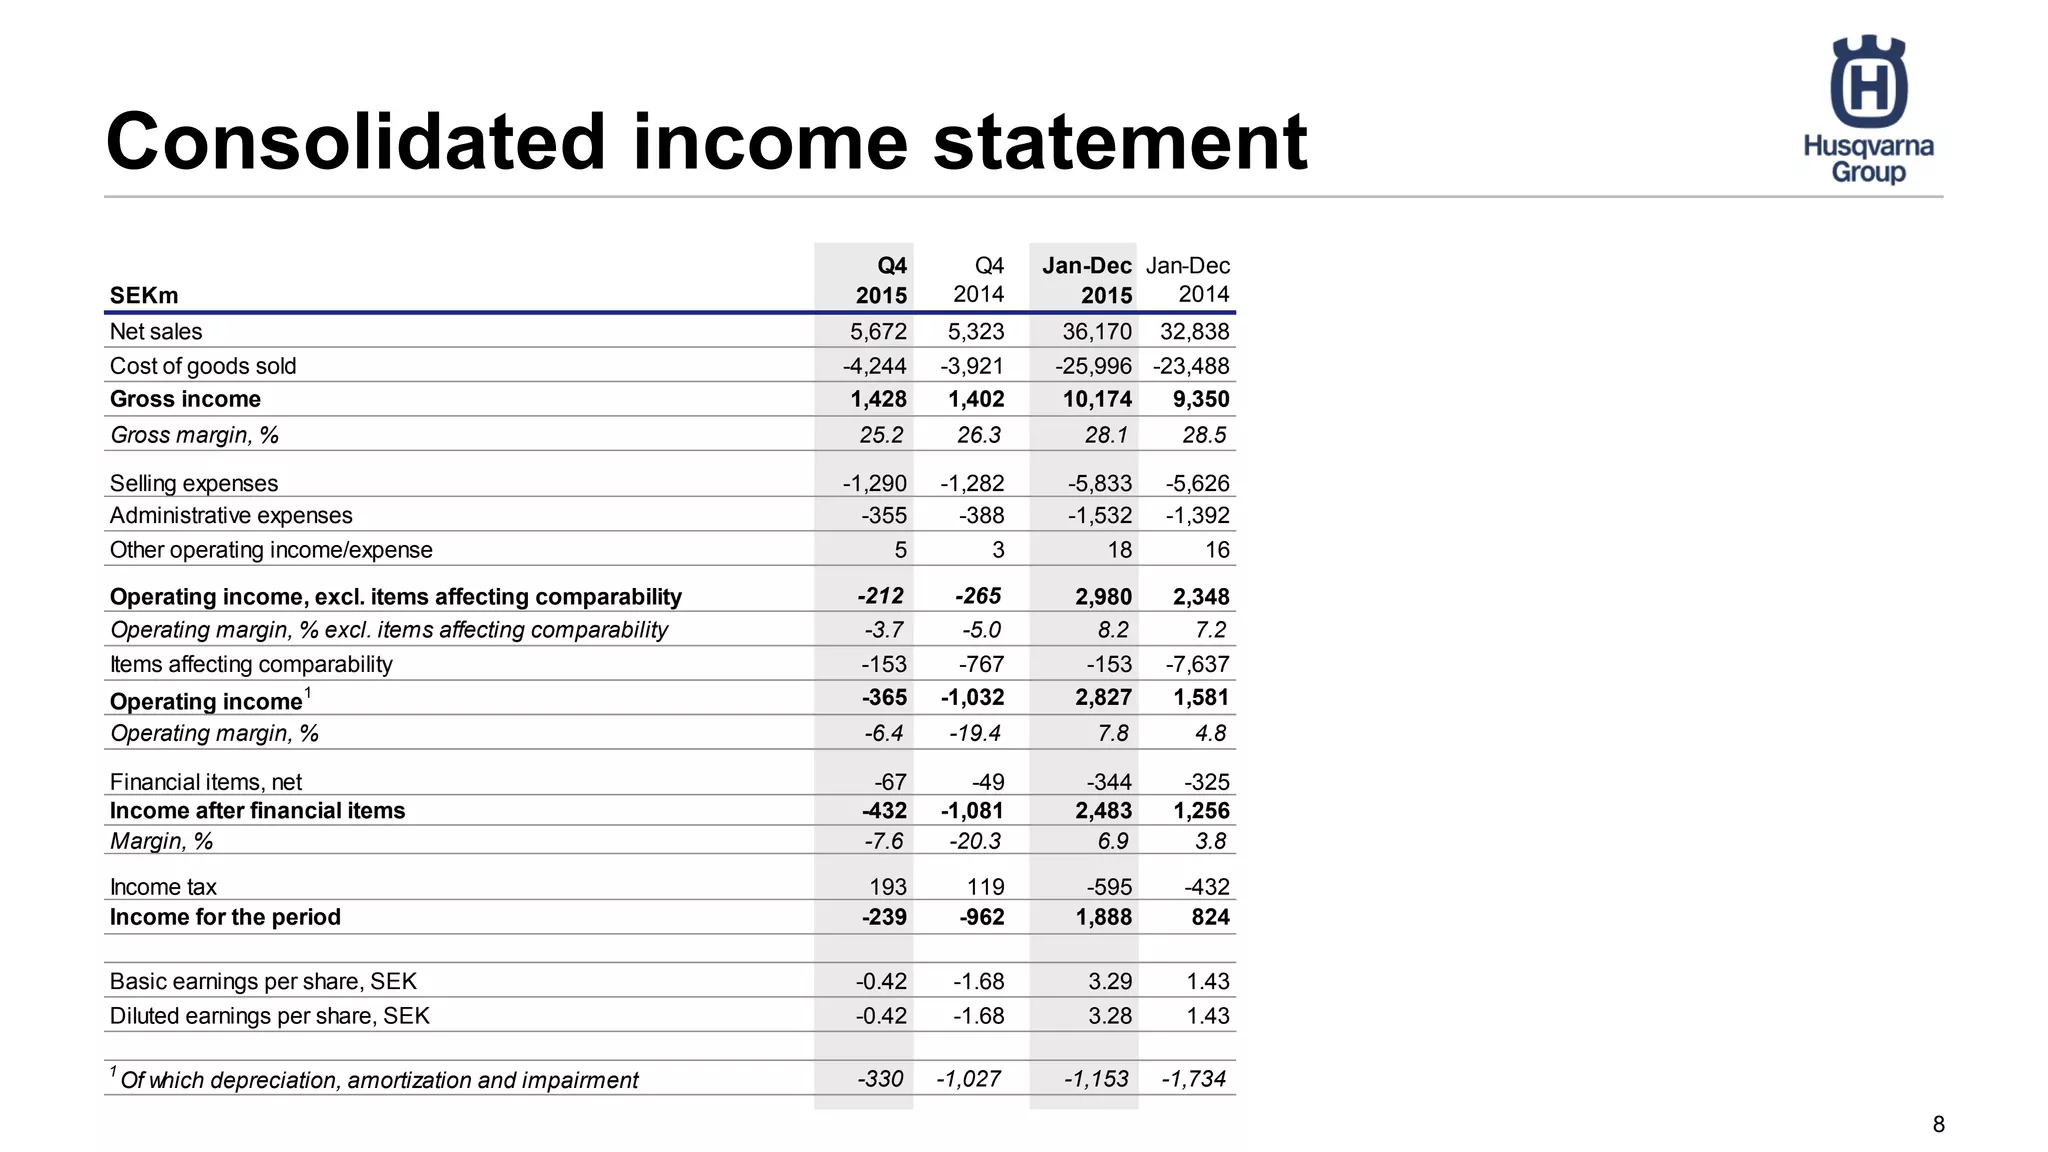


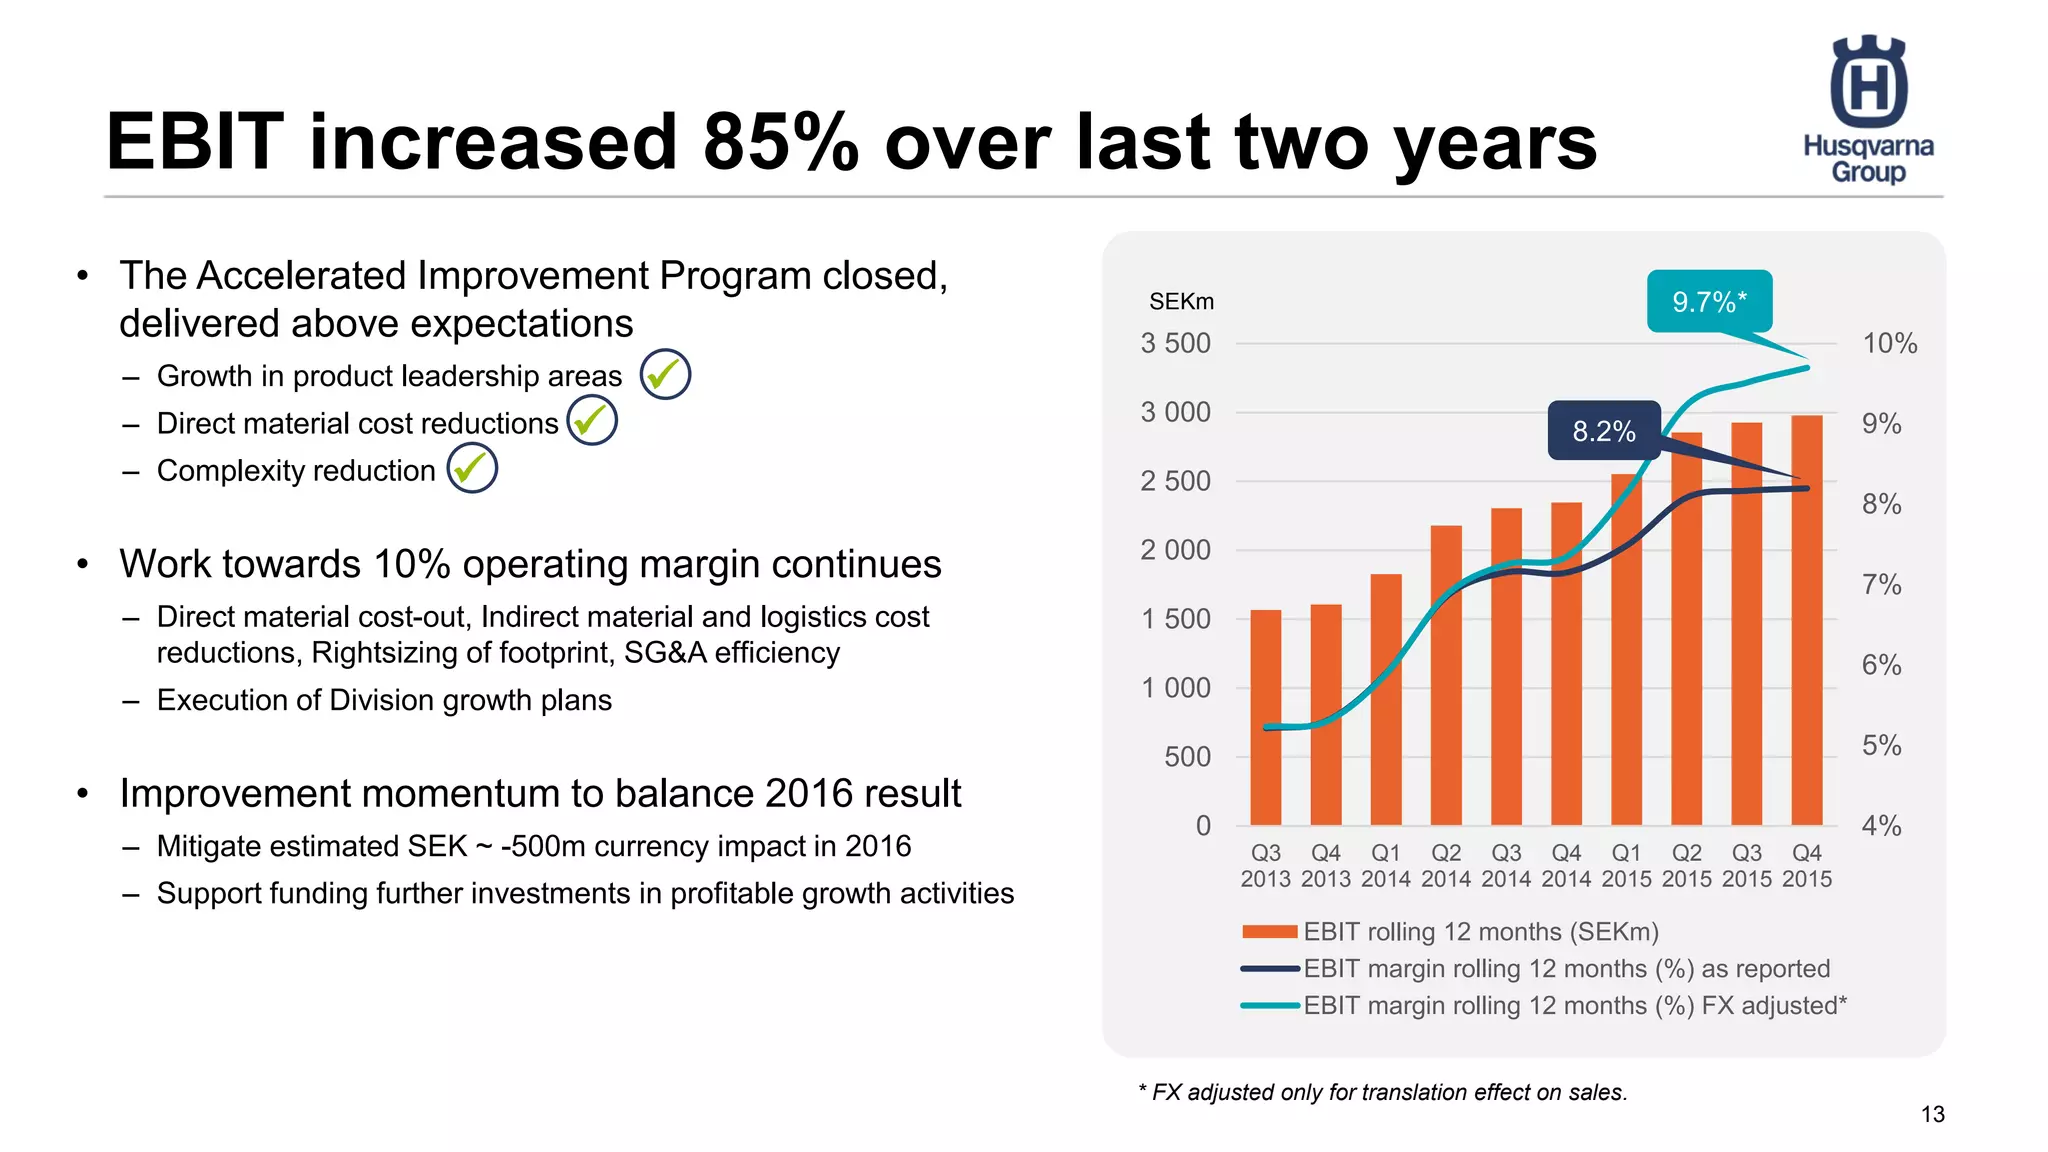
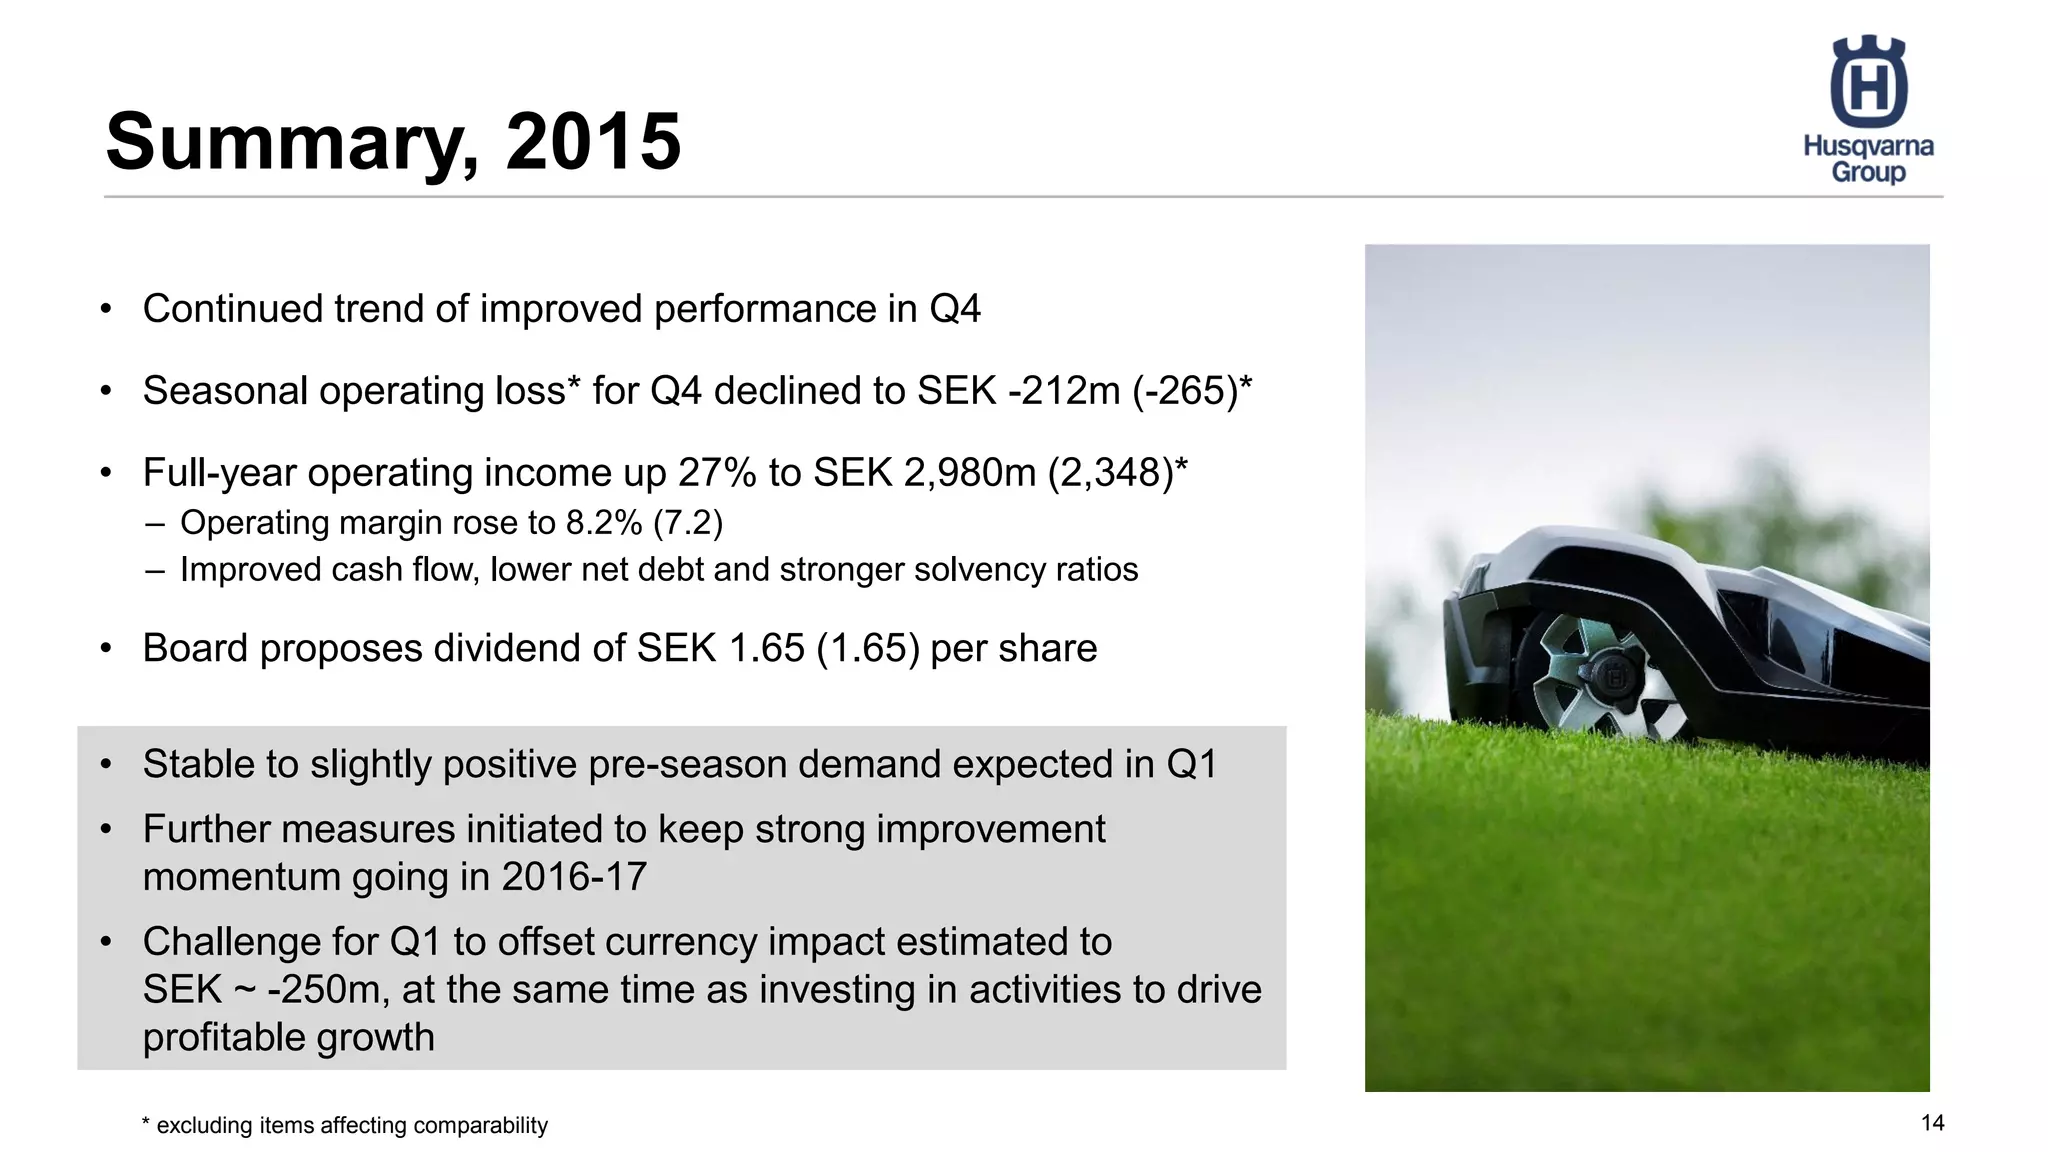


- Continued improved performance in Q4 2015, with the seasonal operating loss declining to SEK -212m from SEK -265m the previous year. - Full-year operating income was up 27% to SEK 2,980m and the operating margin rose to 8.2% from 7.2%. - The board proposes a dividend of SEK 1.65 per share, unchanged from the previous year.


