Download to read offline
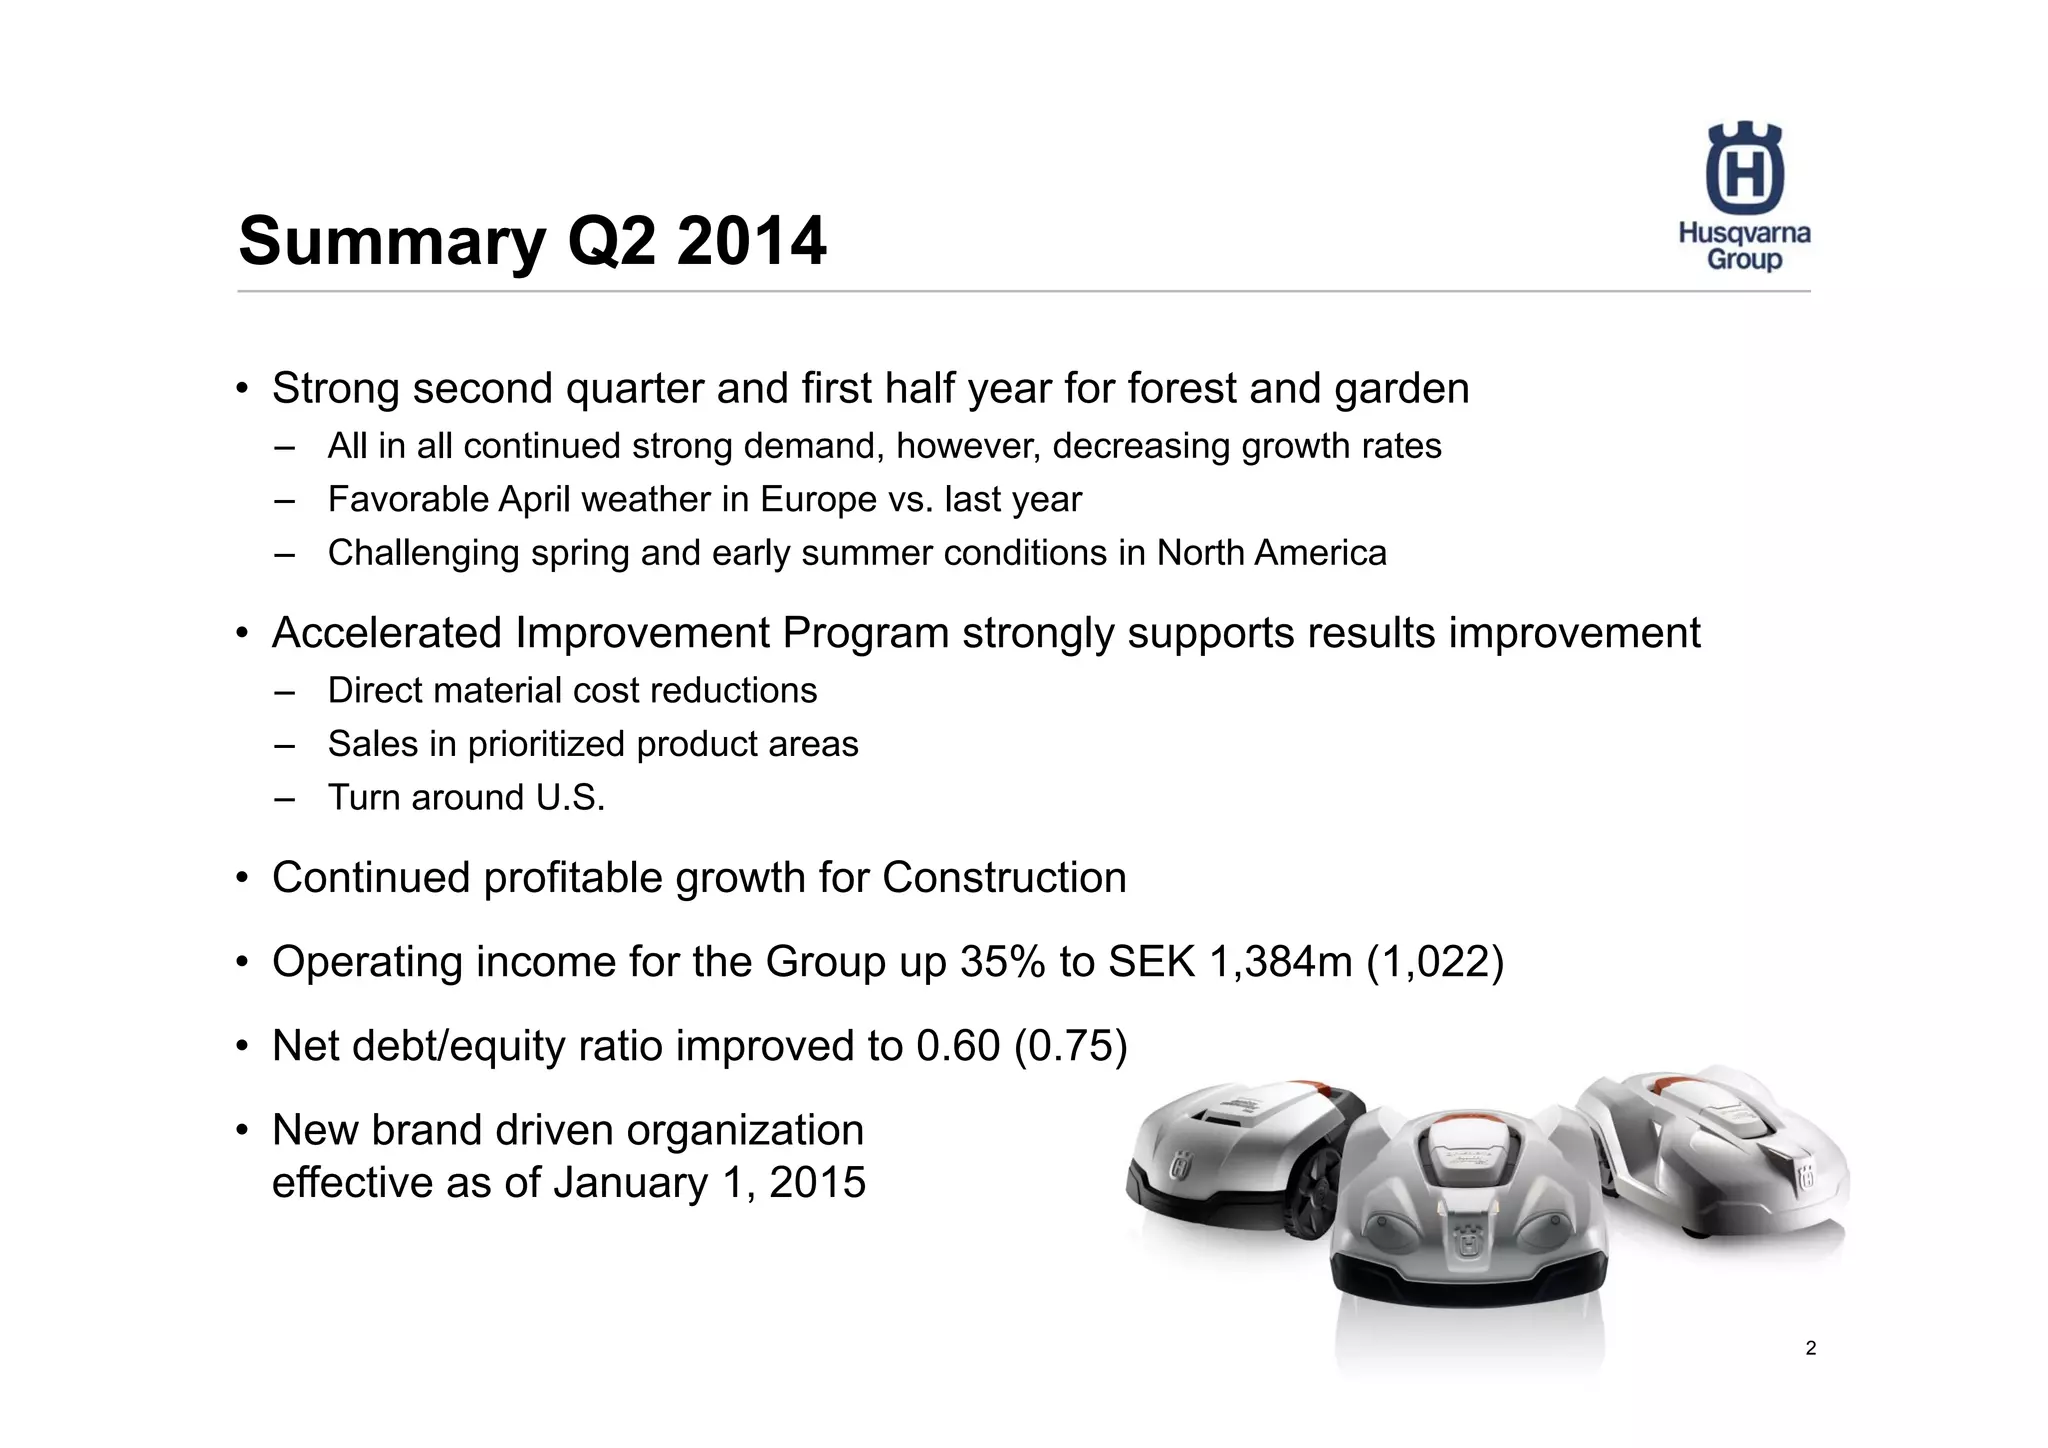
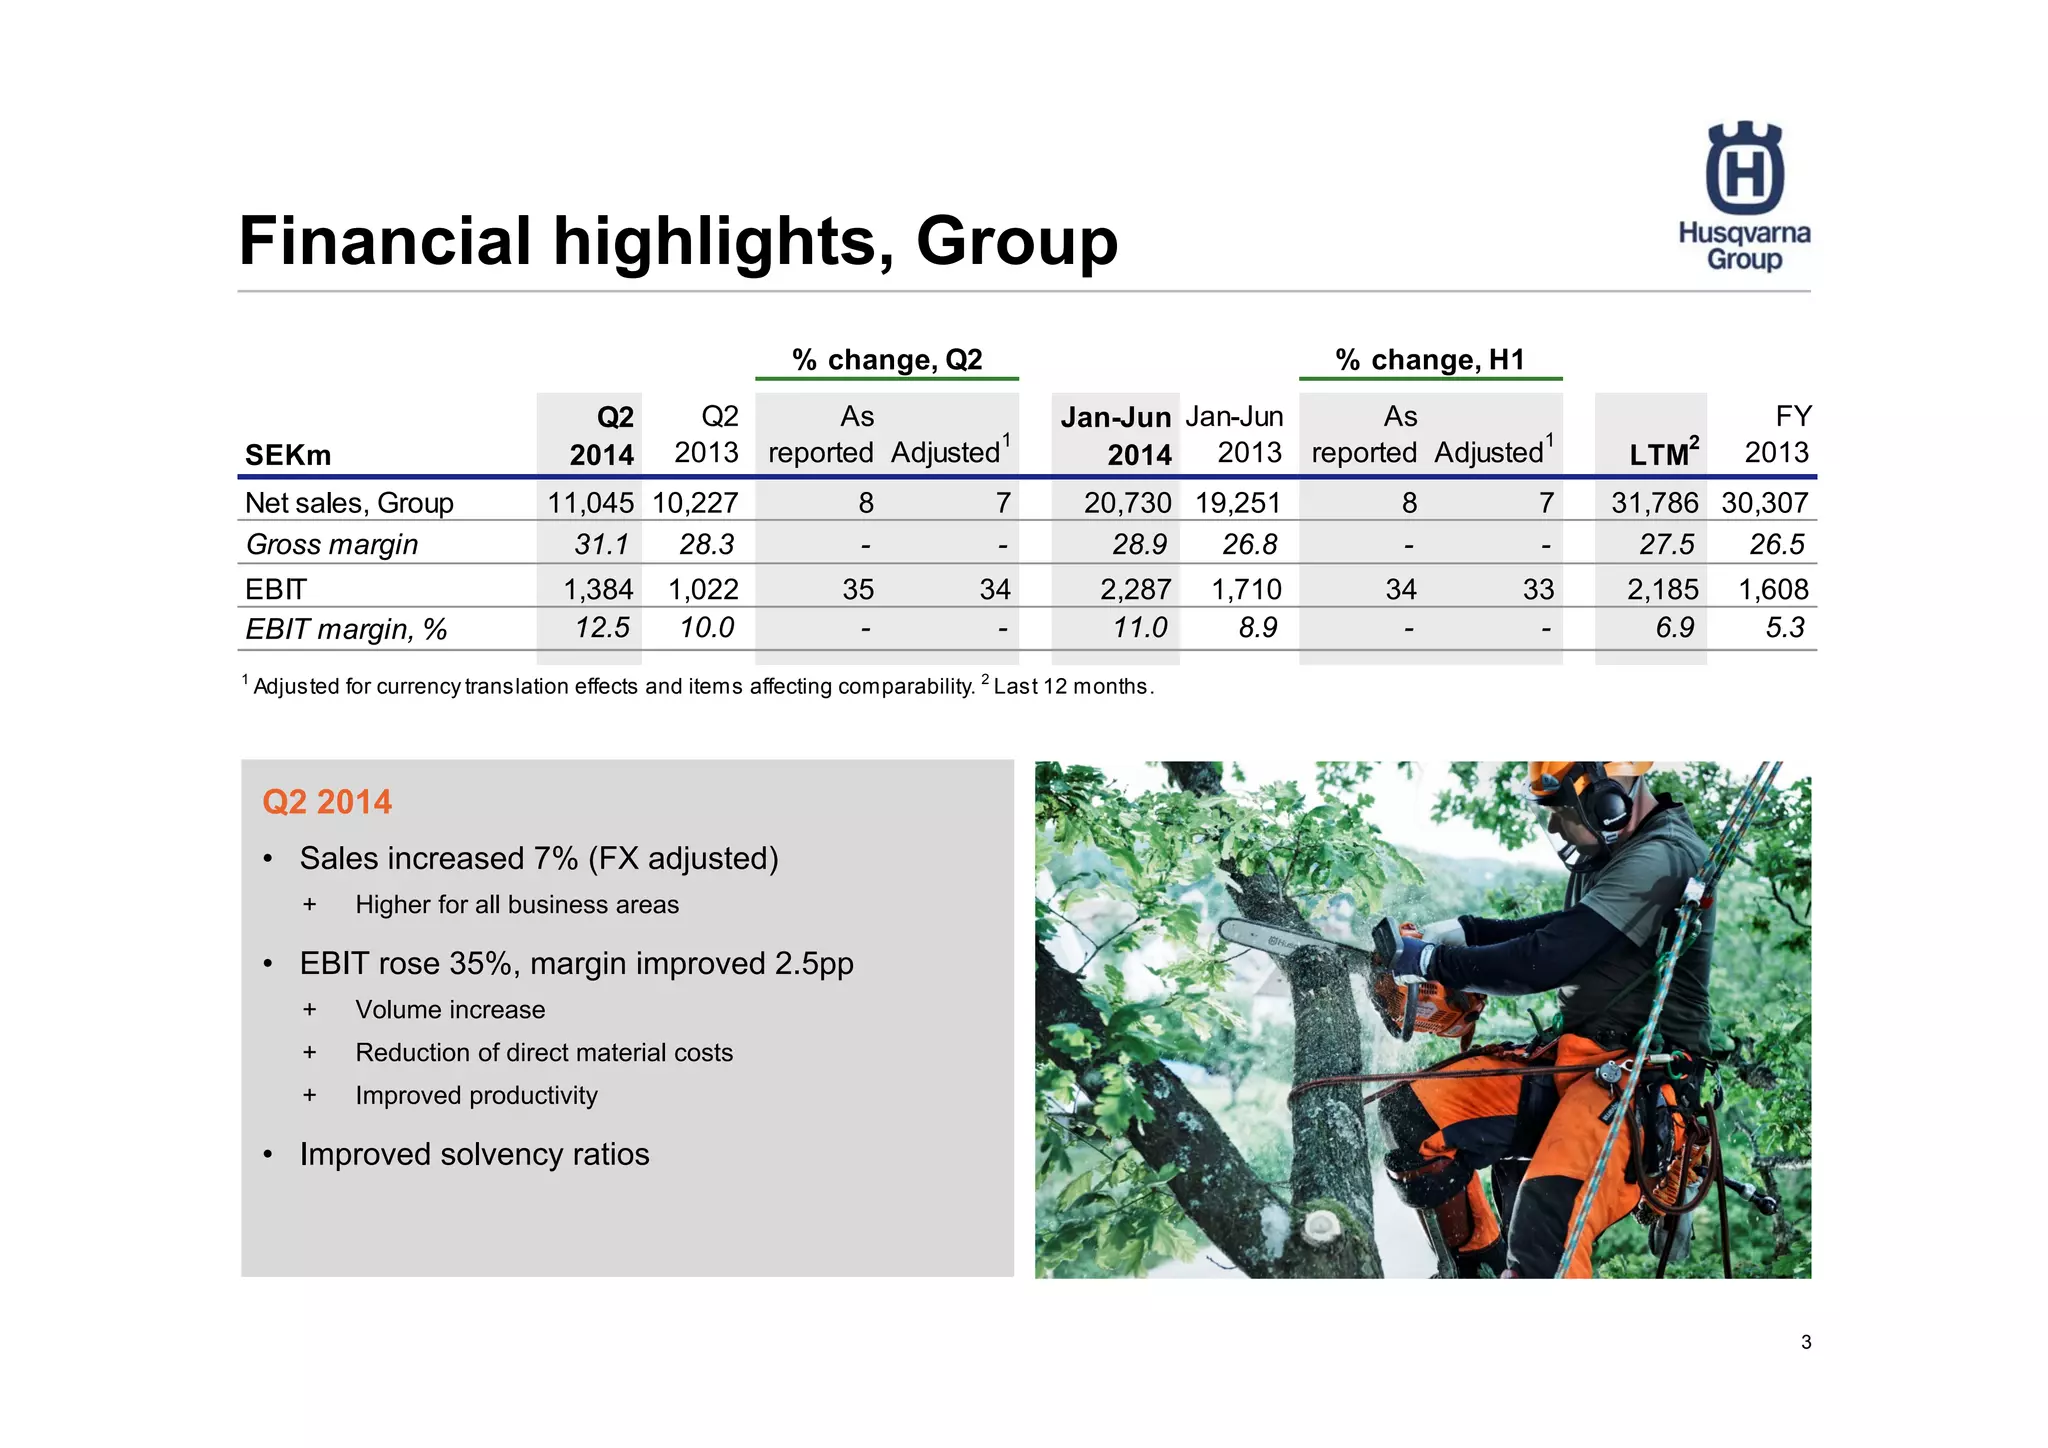
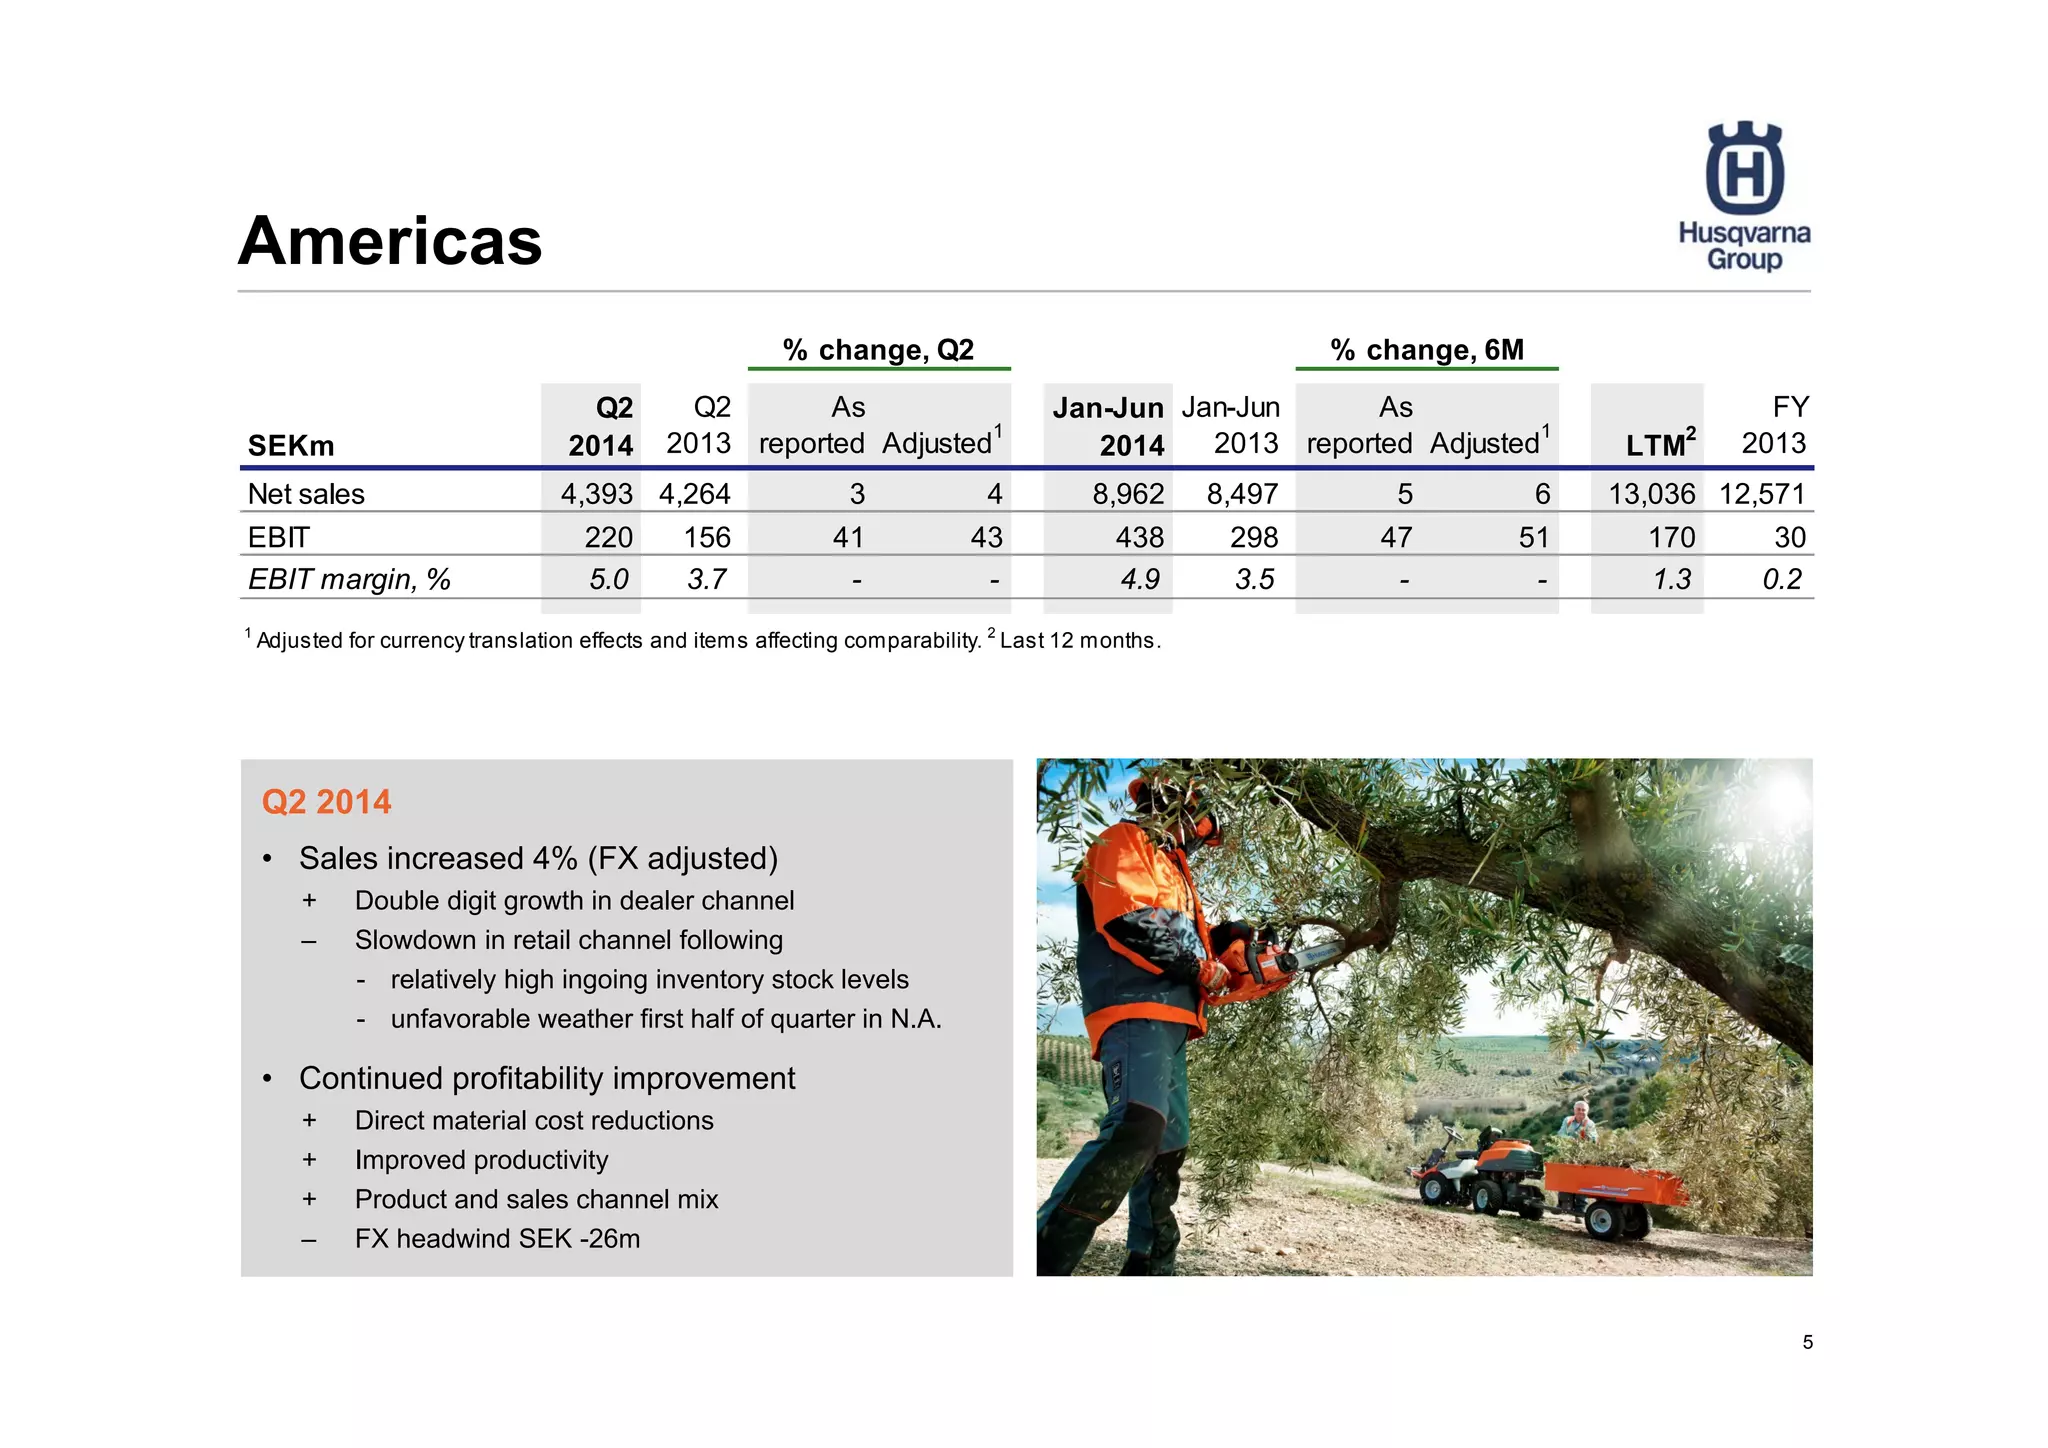
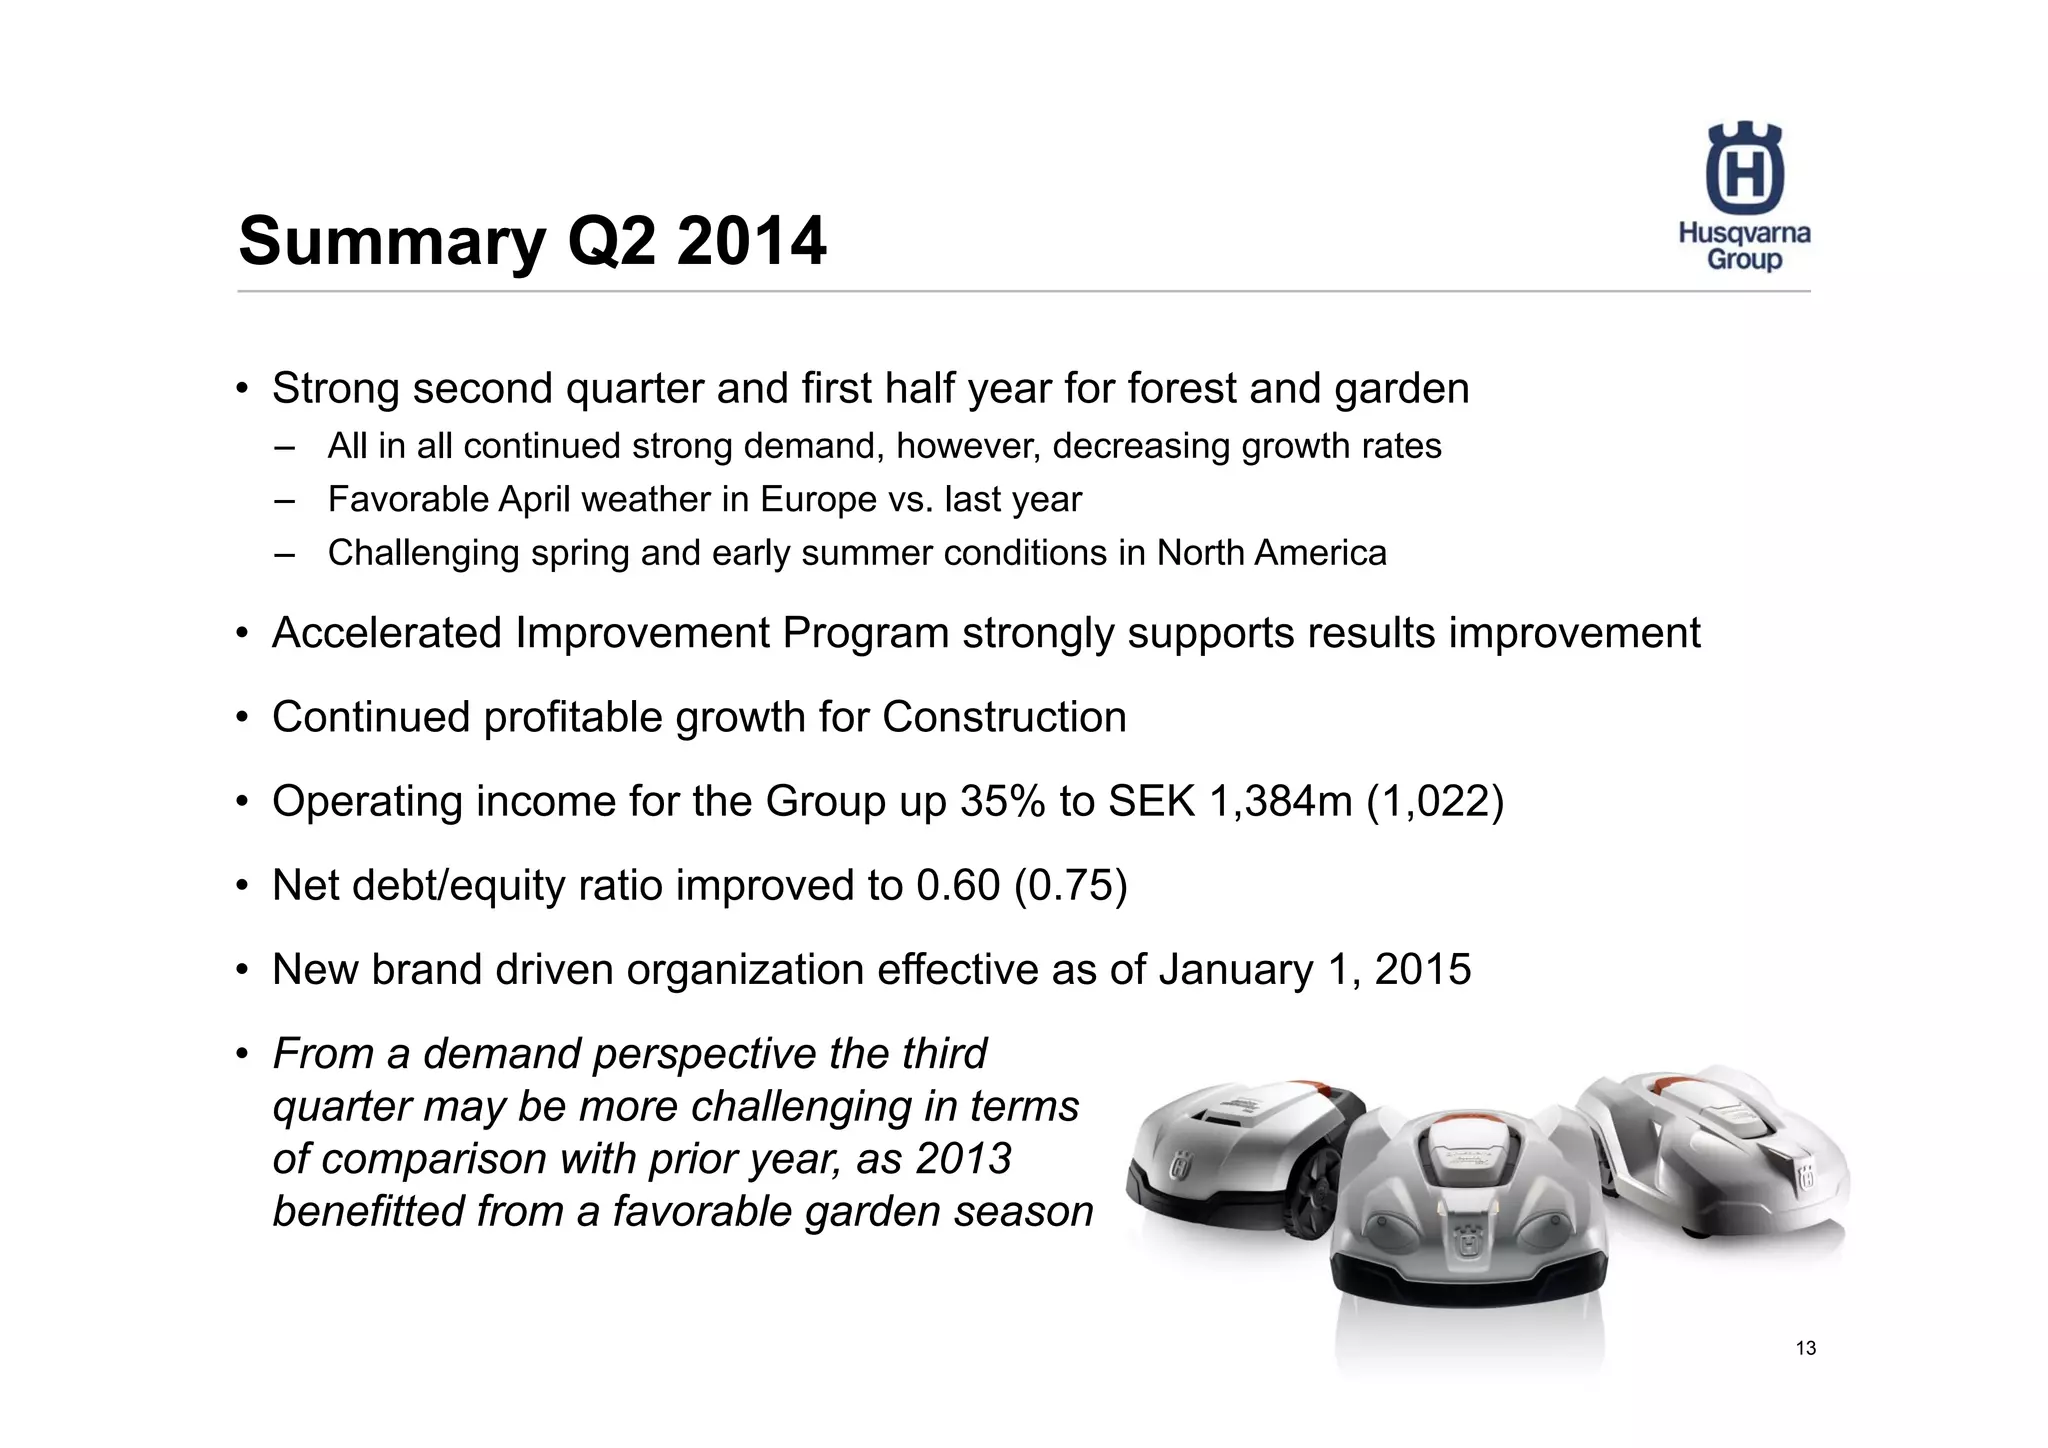

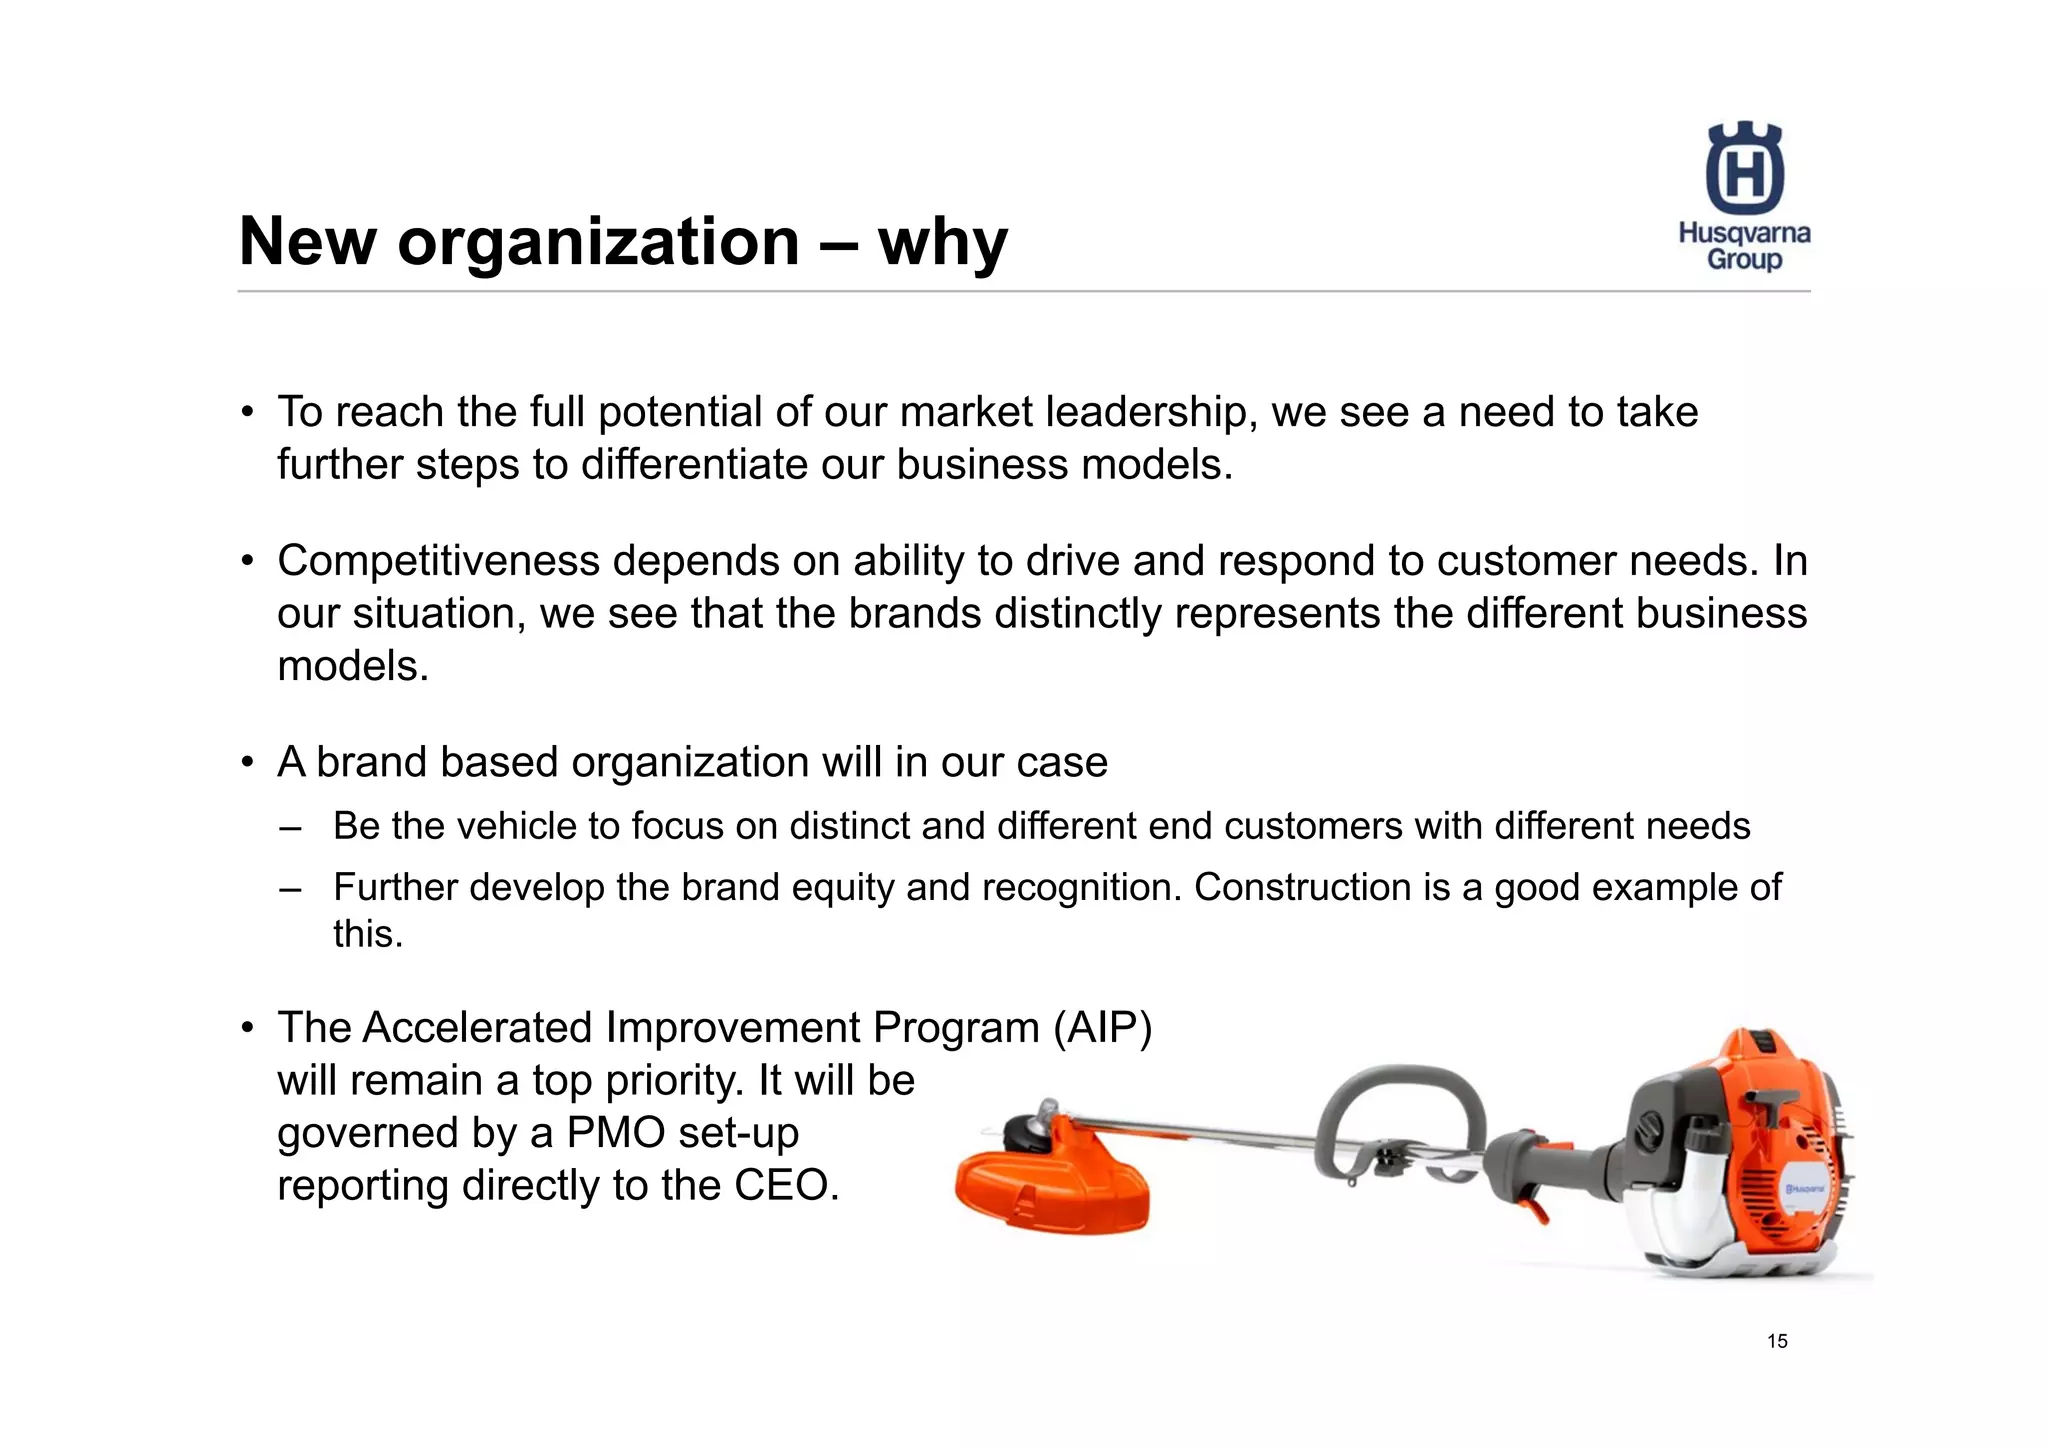
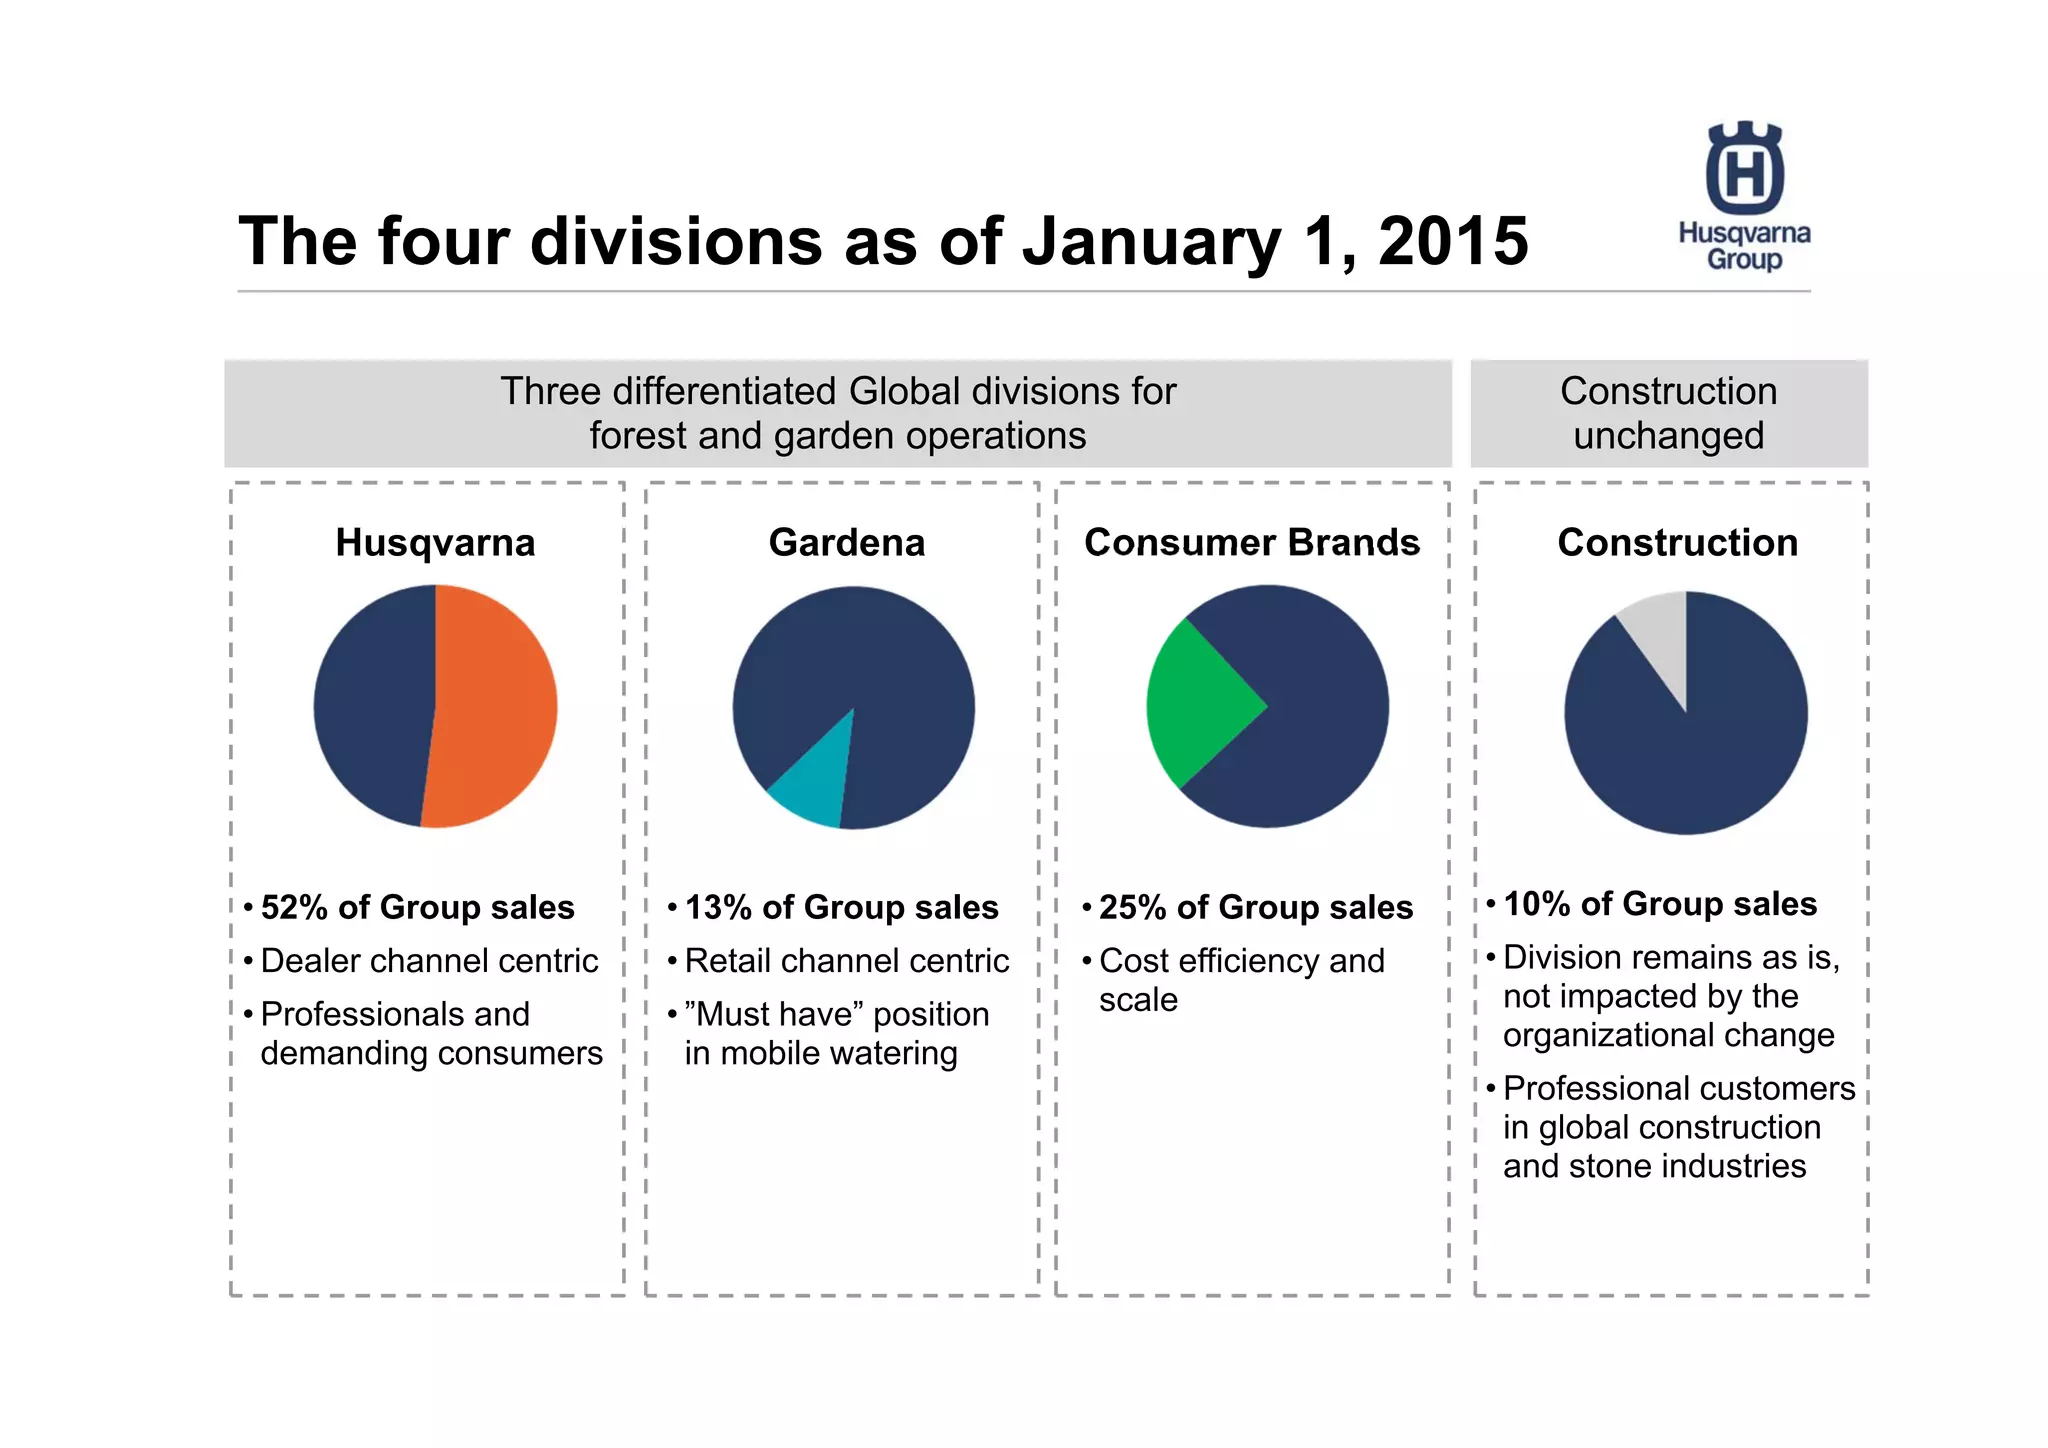


- The presentation summarizes Husqvarna's Q2 2014 results, noting strong demand across forest and garden segments but decreasing growth rates. Operating income for the group was up 35% and the net debt to equity ratio improved. - Husqvarna announced a new brand-driven organization to be implemented in January 2015 in order to better focus on customer needs and drive further differentiation in its business models. Key brands will become separate divisions. - An accelerated improvement program aims to achieve a 10% operating margin by 2015 and has supported results improvement through cost reductions and prioritized product sales.


