Download as PDF, PPTX
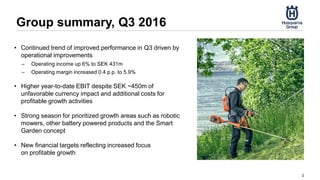
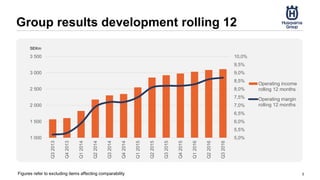
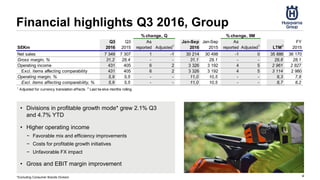
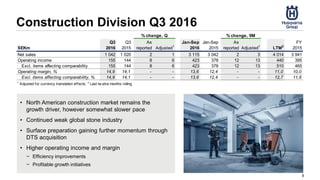
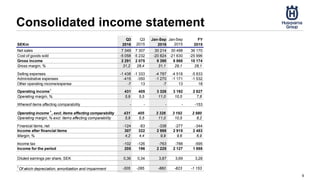
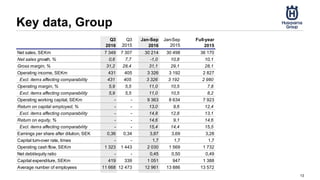
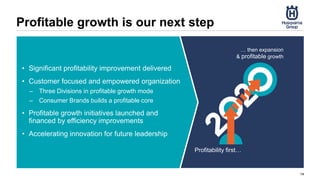
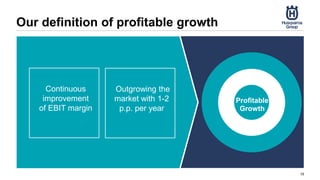
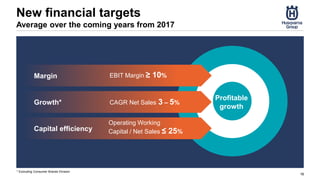

This document summarizes Husqvarna Group's Q3 2016 results. Key points include: - Operating income increased 6% to SEK 431m and operating margin increased 0.4 percentage points to 5.9% due to operational improvements. - EBIT was higher year-to-date despite unfavorable currency impacts and additional costs for growth initiatives. - New financial targets were announced reflecting increased focus on profitable growth, including 3-5% average net sales growth and an EBIT margin of at least 10%.


