Download as PDF, PPTX

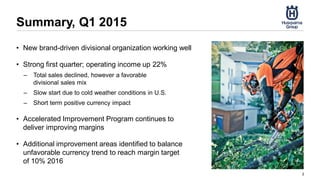
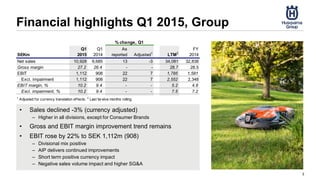
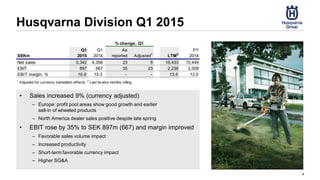
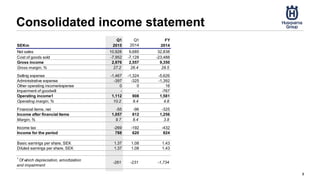
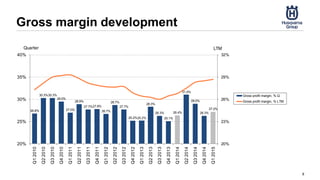

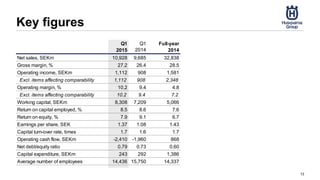


- Sales declined 3% for the quarter but operating income was up 22% due to a favorable sales mix between divisions and continued margin improvements from the Accelerated Improvement Program. - While the first quarter saw strong results, currency trends are expected to negatively impact margins going forward. Additional cost-cutting measures are planned to reach the 2016 target of 10% operating margin. - The new divisional organization structure is working well but recent currency fluctuations may make reaching financial targets difficult without further efficiency improvements.


