Download as PDF, PPTX

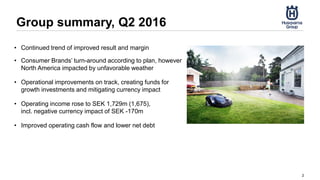
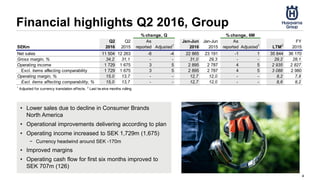
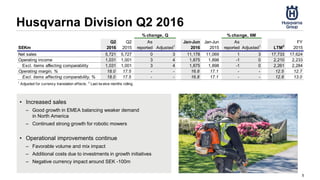


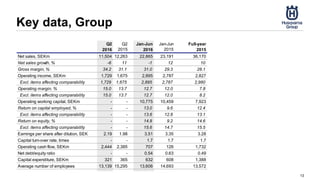
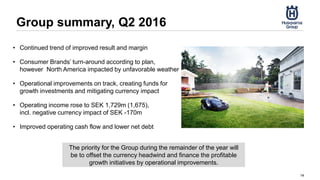

- Operating income rose to SEK 1,729m (1,675), though currency impacts reduced income by SEK -170m. Operational improvements are on track to fund growth initiatives and mitigate currency effects. - While the turnaround of Consumer Brands is proceeding as planned, its North American business was impacted by unfavorable weather during the peak season. - Continued margin improvements and trends of better results, but the priority is now to offset currency headwinds through further operational enhancements. Operating cash flow and net debt also improved.


